Add more logged detail to fetch?

I have logging set to !script but would like more details logged for a particular fetch command within the script.

Here is the script:

/system
:local cdate [clock get date] 
:local yyyy  [:pick $cdate 0  4]
:local MM    [:pick $cdate 5  7]
:local dd    [:pick $cdate 8 10]
:local identitydate "$[identity get name]_$yyyy-$MM-$dd"
/export show-sensitive file="$identitydate"

/tool fetch upload=yes mode=ftp ascii=no src-path="/$[$identitydate].rsc" dst-path="/mikrotik-backups/$[$identitydate].rsc" address=192.168.2.22 port=21 user=mikrotik password=<password>

/file remove "$identitydate.rsc"

:log info ("Uploaded rsc backup to 192.168.2.22 as ".$identitydate)

With !script, the last line does not show up in the log (I wish it did).

But, the fetch command produces this in the log:

Upload to 192.168.2.22 FINISHED

Is there a way to change or add to the fetch log entry?

Would be nice if the log entry included $identitydate

Thank you.

That loud silence…

fetch is a log topic, so first thing you want to do is enable that in /system/logging! You may need to add !raw - as it can log too much!
e.g. Here is 301 Redirect “hard failure” in 7.17 shown in logs:

2024-09-27 17:41:08 fetch,debug Download from > https://wttr.in/@mikrotik.com?format=4 > to RAM FINISHED
2024-09-27 17:41:11 ipsec,info initiate new phase 1 (Identity Protection): 108.211.142.61[500]<=>166.170.51.117[500]
2024-09-27 17:41:49 fetch,raw,write GET /@mikrotik.com?format=4 HTTP/1.1\r\n
2024-09-27 17:41:49 fetch,raw,write Accept-Encoding: deflate, gzip\r\n
2024-09-27 17:41:49 fetch,raw,write Host: wttr.in\r\n
2024-09-27 17:41:49 fetch,raw,write User-Agent: MikroTik\r\n
2024-09-27 17:41:49 fetch,raw,write \r\n
2024-09-27 17:41:49 fetch,raw,read HTTP/1.1 301 Moved Permanently\r\n
2024-09-27 17:41:49 fetch,raw,read Access-Control-Allow-Origin: *\r\n
2024-09-27 17:41:49 fetch,raw,read Location: > https://wttr.in/@mikrotik.com?format=4\r\n
2024-09-27 17:41:49 fetch,raw,read Date: Sat, 28 Sep 2024 00:41:49 GMT\r\n
2024-09-27 17:41:49 fetch,raw,read Content-Length: 233\r\n
2024-09-27 17:41:49 fetch,raw,read Content-Type: text/html; charset=utf-8\r\n
2024-09-27 17:41:49 fetch,raw,read \r\n
2024-09-27 17:41:49 fetch,info Download from wttr.in FAILED: Fetch failed with status 301 (Location: "> https://wttr.in/@mikrotik.com?format=4> ")
2024-09-27 17:41:49 fetch,debug Download from > http://wttr.in/@mikrotik.com?format=4 > to RAM FAILED: Fetch failed with status 301 (Location: "> https://wttr.in/@mikrotik.com?format=4> ")
2024-09-27 17:41:50 script,warning fetch got hard error: failure: Fetch failed with status 301 (Location: "> https://wttr.in/@mikrotik.com?format=4> ")

Anything that’s not a 200 HTTP status code goes to log, and there is no more information available in scripting that what’s logged for the non-200 error codes. So enabling “fetch,!raw” or if not enough just “fetch” in system loging is really the best you can to do troubleshoot issues. Most of the time it’s figuring out the right format/escaping when initially scripting something - there logging (especially in recent V7) can help a lot. And, once command right, it should rarely fail. If it did it be logged, at least that it happened. That’s at least that’s Mikrotik’s theory here. e.g. if you’re getting something like a 301 — which is pretty common… That’s a redirect and the “correct URL” is in the logs. So you change the url= in fetch to what the 301 error showed in the logs for “Location:”. Although Mikrotik should add some “follow-redirects=yes” since curl has that option, and a 301 is “fixable error” and should retry it for the scripter (or at least return the location) — sorry my pet peeve on this fetch logging topic.

Basically scripting itself is limited in what it can get from /tool/fetch, logs have more. So often do nothing more than call /tool/fetch and check if ->“data” is what you expect is the best plan. And make sure you debug your script using logs when initially writing it.

But you want to pedantic, you can use :onerror - which get the “hard” HTTP errors but be same message as long. Here is an example using :onerror – but again “nothing is more”:

:global safeFetch do={
    :local resp
    :local httperror [ :onerror err in={
        :set resp [/tool fetch url=$url output=user-with-headers as-value]
        :if (($resp->"status") != "finished") do={
            /log warn "fetch did not finish: $[:tostr $resp]"
            return true
        }
        return false
        } do={ 
            /log warn "fetch got hard error: $[:tostr $err]" 
        } ] 
    :if $httperror do={
        :error "fetch failed, check logs"
    }
    return $resp
}
# works:
:put [$safeFetch url="https://wttr.in/@mikrotik.com?format=4"]
# hard error - bad url:
:put [$safeFetch url="https://wttr.in?"]
# hard error - redirect:
:put [$safeFetch url="http://wttr.in/@mikrotik.com?format=4"]
# hard error - HTTP 500 status code
:put [$safeFetch url="https://postman-echo.com/status/500"]
#

Wow, thank you Amm0. I now have a much better understanding of the log topics “fetch” and “raw”

Unfortunately, I did not do a good job of communicating my goal.

I maintain:

/system logging
set 0 topics=info,!script
add action=remote prefix="192.168.2.2 " topics=info,!script
add action=logserver prefix="serial=HDA0xxxxH MikroTik" topics=hotspot
add action=logserver prefix="serial=HDA08xxxxZH MikroTik" topics=!debug,!packet,!snmp

The reason for the !script is because I run the Splunk script by @Jotne every 5 minutes (the last 2 lines above). I also am playing with using Dude as a syslog server. And, I do not wish to see in either memory or Dude’s syslog server the Splunk script output.

But, I have other scripts, including the one in my OP, that run on a schedule that create log entries that I do want to see.

I thought about adding to the script to either disable/remove/edit the /system/logging so that it does not include !script but that just adds undesired log entries.

So my goal is to be able to have some scripts create log entries that are shown in memory and sent to remote, and other scripts that do not.

Possible?

Thank you.

I have not studied @jonte’s Splunk scripts, so bit blind on what they might capture. Fundamentally, the logging system has some limits - which @jonte/others have cataloged. The one trick logging does have is adding more/“duplicate” /system/logging/actions (and use them for different subsets) – so that’s kinda the tools we’re playing with here.

For example, if you have some “!script” today, you should be able to a “2nd memory” with a different “name=”, that can be used for topics=script to prevent those from hiding splunk/etc. Essentially you’re allowed to have multiple target=memory (or other target=):

/system/logging/action/add name=script target=memory 
/system/logging/add topics=script action=script-memory

For /tool/fetch logging, similarly, you can create another log action. But, if you ask me, there are two use case for logging & each has different approach:

  • Case A: when interactively writing the script to get the right parameter to fetch, and get an error/issue
  • Case B: after fetch script is “done”, what to do when it “fails”
    … & each has different solution.

For case A with /tool/fetch, with the newer logging in recent V7, you can essentially replicate curl/wget’s “verbose” option that will output logs you can use the “echo” action. For example, here is a call that gets a 301 error, which will be shown on the console when you’re entering because to the “action=echo” in logs:

/system/logging/add topics=fetch action=echo comment="fetch debug"
/tool/fetch url="http://postman-echo.com/status/301"


status: failed
failure: Fetch failed with status 301 ( Set-cookie: “sails.sid=s%3AdV8YXvKdMKPcpB
6QK1X2_VGykfh_xiMX.U3HgJ8engUfXhHSpYiWuf9EbcyXMUUOG6tFtddyM7iU; Path=/; HttpOnly”
)
(5 messages discarded)
08:06:31 echo: fetch,raw,read HTTP/1.1 301 Moved Permanently\r\n
08:06:31 echo: fetch,raw,read Date: Sun, 29 Sep 2024 15:06:31 GMT\r\n
08:06:31 echo: fetch,raw,read Content-Type: application/json; charset=utf-8\r\n
08:06:31 echo: fetch,raw,read Content-Length: 19\r\n
08:06:31 echo: fetch,raw,read Connection: keep-alive\r\n
08:06:31 echo: fetch,raw,read Server: nginx/1.25.3\r\n
08:06:31 echo: fetch,raw,read ETag: W/“13-exJghAlC9Ebmzy4CXRTzhbeVAQc”\r\n
08:06:31 echo: fetch,raw,read set-cookie: sails.sid=s%3AdV8YXvKdMKPcpB6QK1X2_VGyk
fh_xiMX.U3HgJ8engUfXhHSpYiWuf9EbcyXMUUOG6tFtddyM7iU; Path=/; HttpOnly\r\n
08:06:31 echo: fetch,raw,read \r\n
08:06:31 echo: fetch,raw,read {\n “status”: 301\n}
08:06:31 echo: fetch,info > Download from postman-echo.com FAILED: Fetch failed wit
h status 301 ( Set-cookie: “sails.sid=s%3AdV8YXvKdMKPcpB6QK1X2_VGykfh_xiMX.U3HgJ8
engUfXhHSpYiWuf9EbcyXMUUOG6tFtddyM7iU; Path=/; HttpOnly”)

08:06:31 echo: fetch,debug Download from > http://postman-echo.com/status/301 > to 30
1 FAILED: Fetch failed with status 301 ( Set-cookie: "sails.sid=s%3AdV8YXvKdMKPcp
B6QK1X2_VGykfh_xiMX.U3HgJ8engUfXhHSpYiWuf9EbcyXMUUOG6tFtddyM7iU; Path=/; HttpOnly
")

And what’s in bold above has a topics=info, so that’s the ONLY message that goes elsewhere (at least in default script where “info” is covered by default memory/etc log actions. The rest is just shown on your console when entering it at CLI. Now this does have a side-effect that it applies to any fetch going on - not just the one at the CLI. But this can be helpful to troubleshoot some operational failure. But you way want to turn off the “echo” logging when not using scripting or debugging recurring some operational issue with fetch.

For case B of /tool/fetch, i.e. how to log failures from some scheduled/etc script in operation. This is trickier since you do not have a lot of control of the logs going out (i.e. no regex, filters, or anything). And particular to your case if your NOT logging topics=script to the remote logging, then using “/log” etc in script may not go anywhere. So my “safeFetch” function example would be BAD in your case. And, in general, it’s bad example for a lot of cases.

To deal with these operational failures, I kinda believe it’s better to “let it fail” for all the “hard failures” (dns, no route, server errors, etc) from /tool/fetch… BUT instead make sure the data returned (i.e. the ->“data” from /tool/fetch) is in the form you expect. If the ->“data” is bad, then also “fail” the script, but /logs that as an error (which should pass through, depending on your acting logging rules).

Since you might want to know more about what failed from a /tool/fetch when you did get the “single failure message” in remote logging system. And, since you are limited to /system/logging/action… you can use yet another target=memory (or use some local file logging work too). This way when you see the one failure message upstream… you can go to the router to check it’s local logs for what happened during fetch (and getting same data shown above for “echo”).

These 2nd and 3rd “memory” in /system/logging/action, do show up in winbox as drop-downs so you can filter them “normal” logs from the “script” or “fetch” logs there:
LoggingDropdown.png
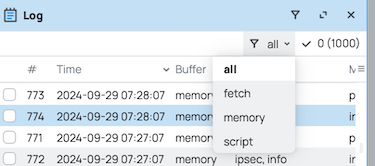
So something like this:

/system/logging/action
add name=fetch target=memory
add name=script target=memory
add memory-lines=20 name=recentonly target=memory
/system logging
add action=script topics=script
add action=echo topics=fetch
add action=fetch topics=fetch

Lastly… since you mention the The Dude… You can add Dude device – or even a simple netwatch “http-get” monitor on router could work too (which be a netwatch topic in logs) to monitor the web server fetch is using. This allow you to check the web server itself that fetch is using is up and responding to HTTP, and thus also get log message about that server’s failure (and be red in Dude map) - so that be a pretty good clue why you’d see fetch failure elsewhere in logs.