I monitor the ping round trip time from the Dude 3.4 server to ip address 10.5.5.55
There seems to be a 5/6ms difference between the Dude’s ping and a ping from the Windows command prompt.
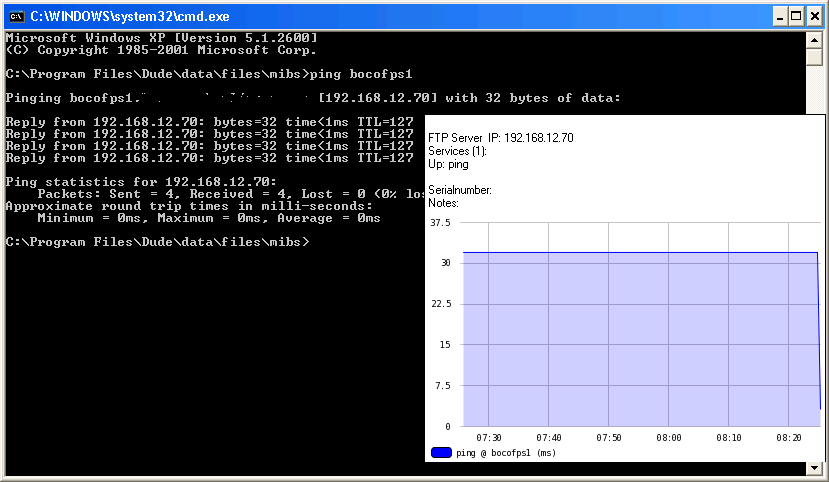
Windows ping reports a steady 21-22ms rtt, Dude reports a steady 15ms.
Yes sure looks like that , but in networking and computing it isn’t, have seen applications perform significantly poorer when 5ms latency was added to the rtt
If I ping another site (60 miles away) Windows ping reports 4ms rtt, Dude reports 0ms rtt (wish for that 0ms to be true), so looks to me there is something not adding up in the Dude’s Ping function
On 2k3 sp2 pings are usually way higher than reality.
There is no way that bocofps1 is 30 ms away. It is Gigabit Ether channel connected.
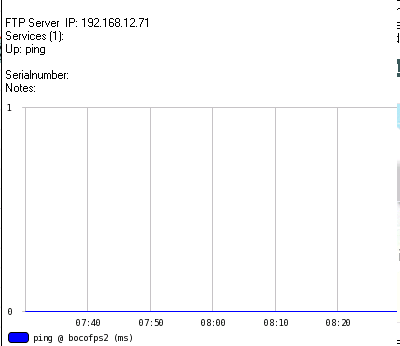
Interestingly enough bocofps2 is 0ms away… They are on the same switch.
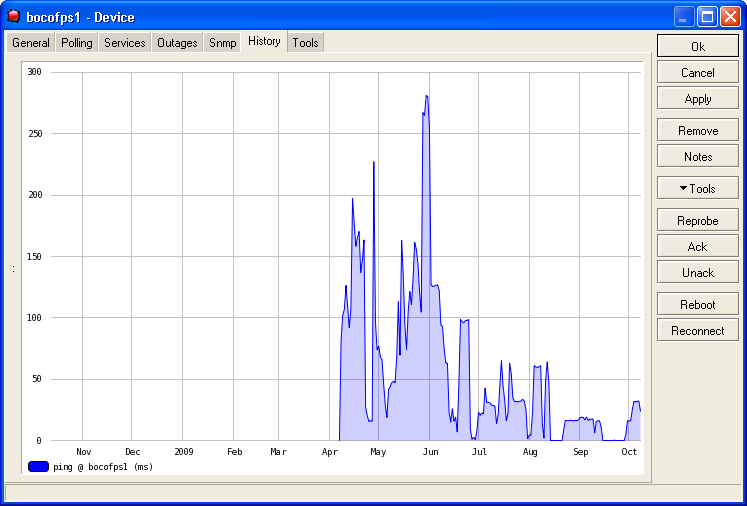
It has never been more than 1ms away but over the year the dude is crazy
would it be possible to get the code for that ping probe.
I have been trying to create a probe showing the rtt but I am quite new to this and not very successfull as yet.
thanks for the reply… I actually did find out my error.
I was getting a “parse error” all the time and was wondering why, actually it’s because I forgot to put “” (empty string) in the error field.
Either add a bunch of devices to a chart or manually build different ping probes with the IP address specified for the target and add them all to one device. Chart would be easier.
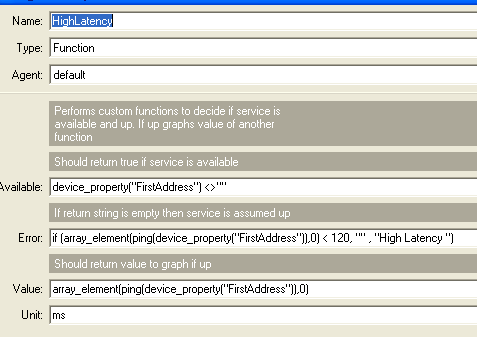
Create a new probe, give it a name, select type function.
In available put your RTT function or call the function directly like below.
Do the same thing for error and value. Value is what is graphed.
I just took a guess as to how yours should look.
Available: RTT()<>“”
error: if (RTT()< 120,“”,“high latency”)
value: RTT()
unit:ms