We have a new concept for the packet flow diagram, applying to RouterOS v6. Please make suggestions for more example drawings, or other comments.
UPDATED
We have a new concept for the packet flow diagram, applying to RouterOS v6. Please make suggestions for more example drawings, or other comments.
UPDATED
I think they’re great ![]()
However, I don’t know what the letters/numbers mean.
Otherwise, awesome.
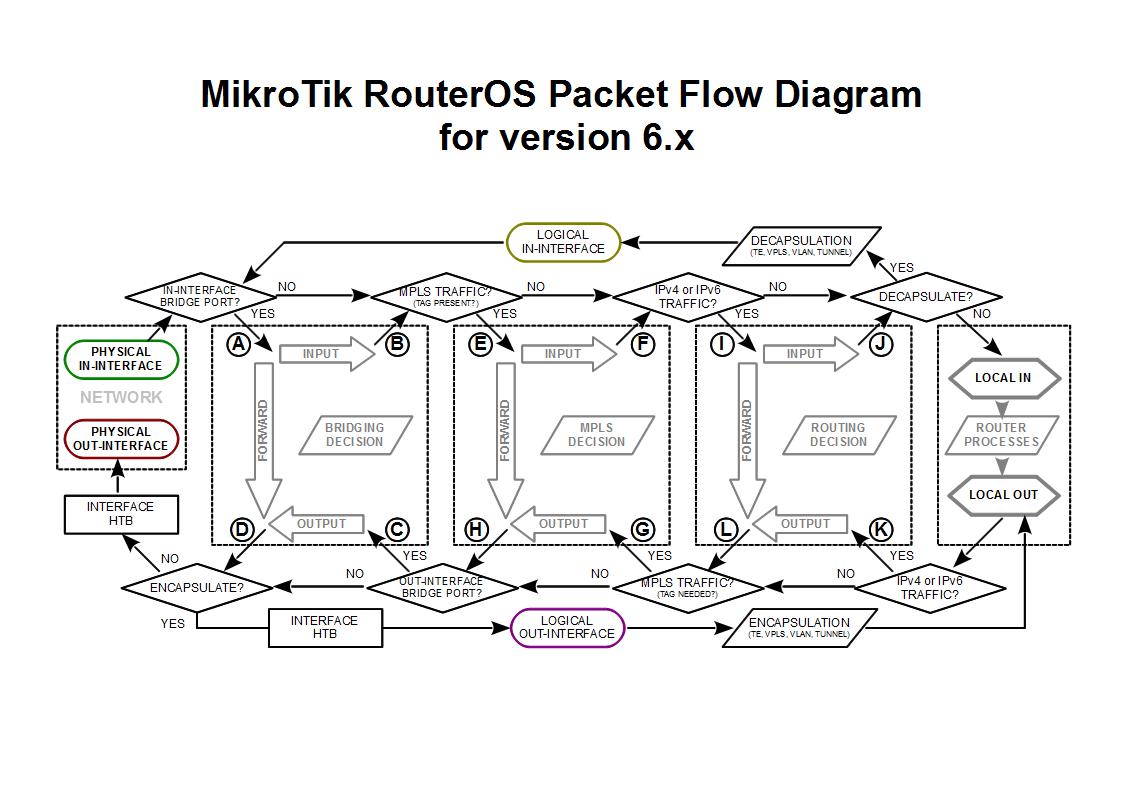
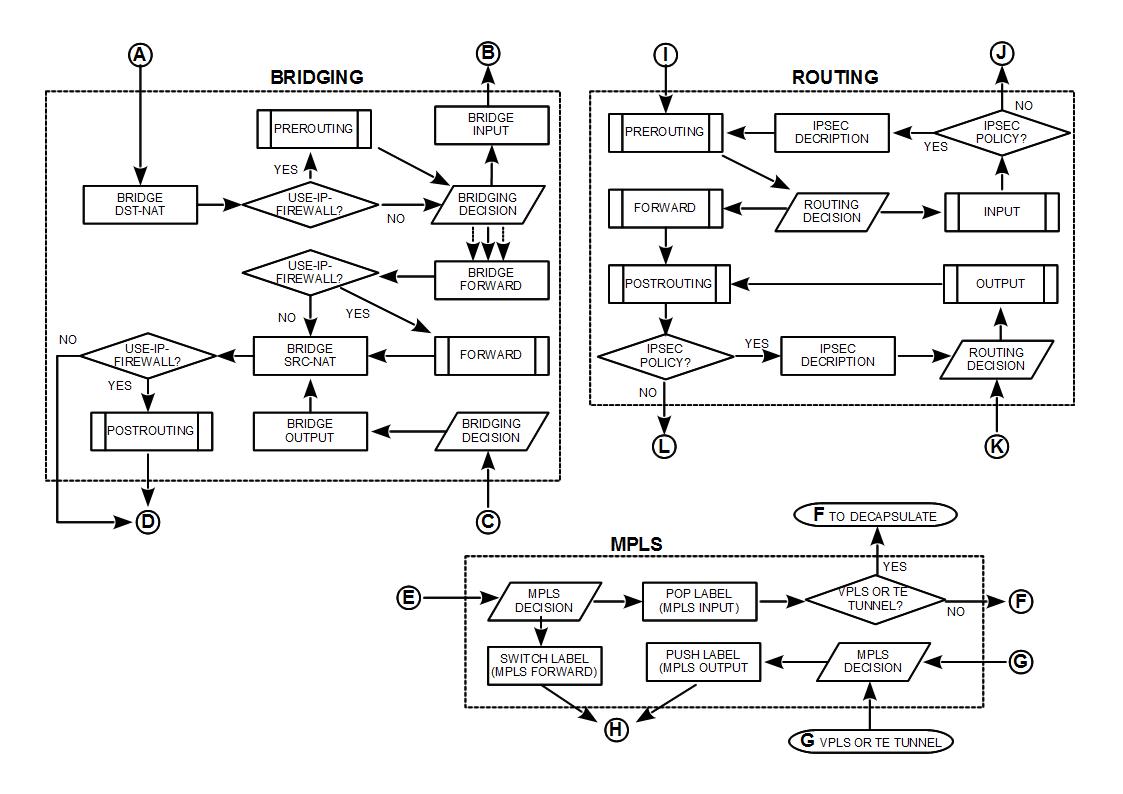
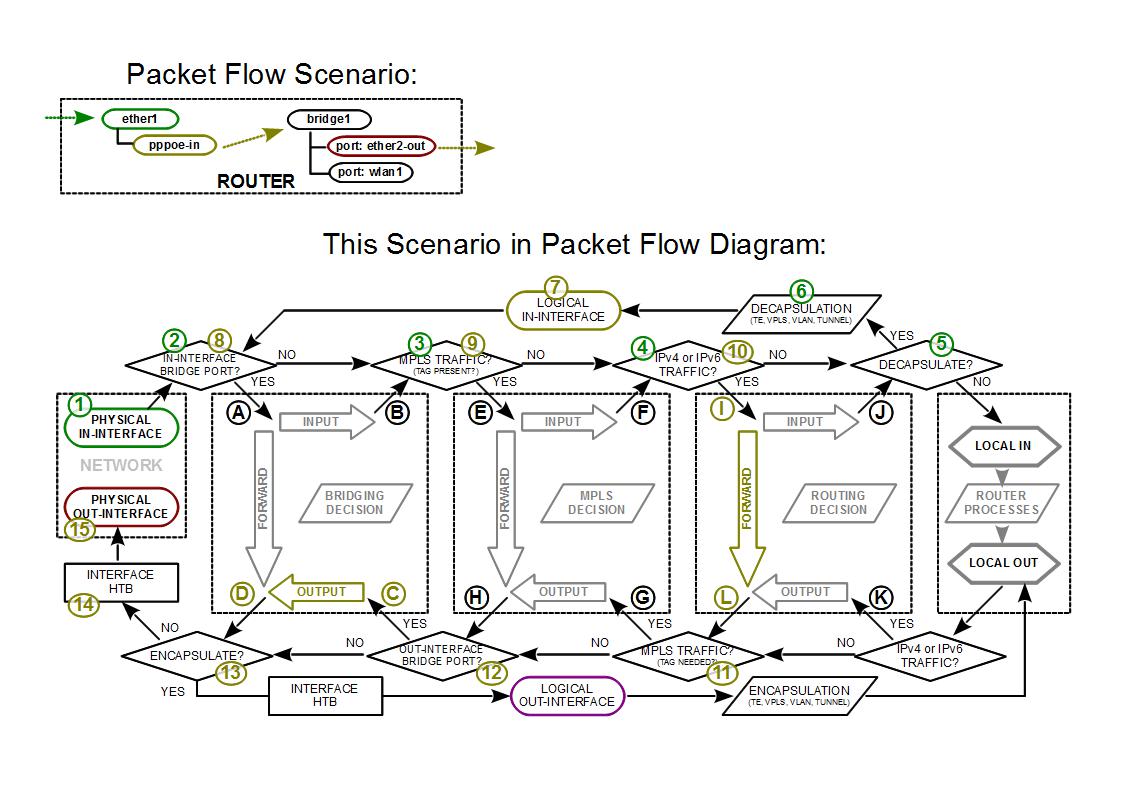
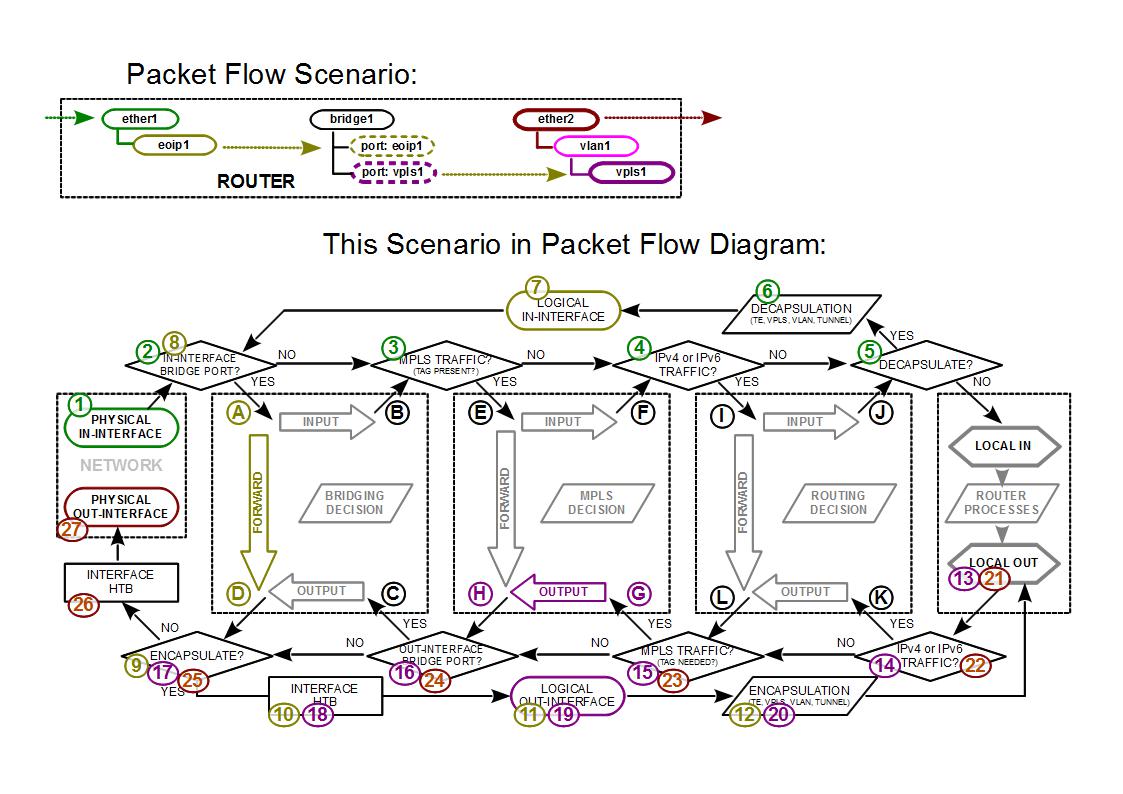
The letters in the circles are jumps. So, for example, the output from mpls chart at H goes back into the main loop at H.
Sent from my XT912 using Tapatalk 2
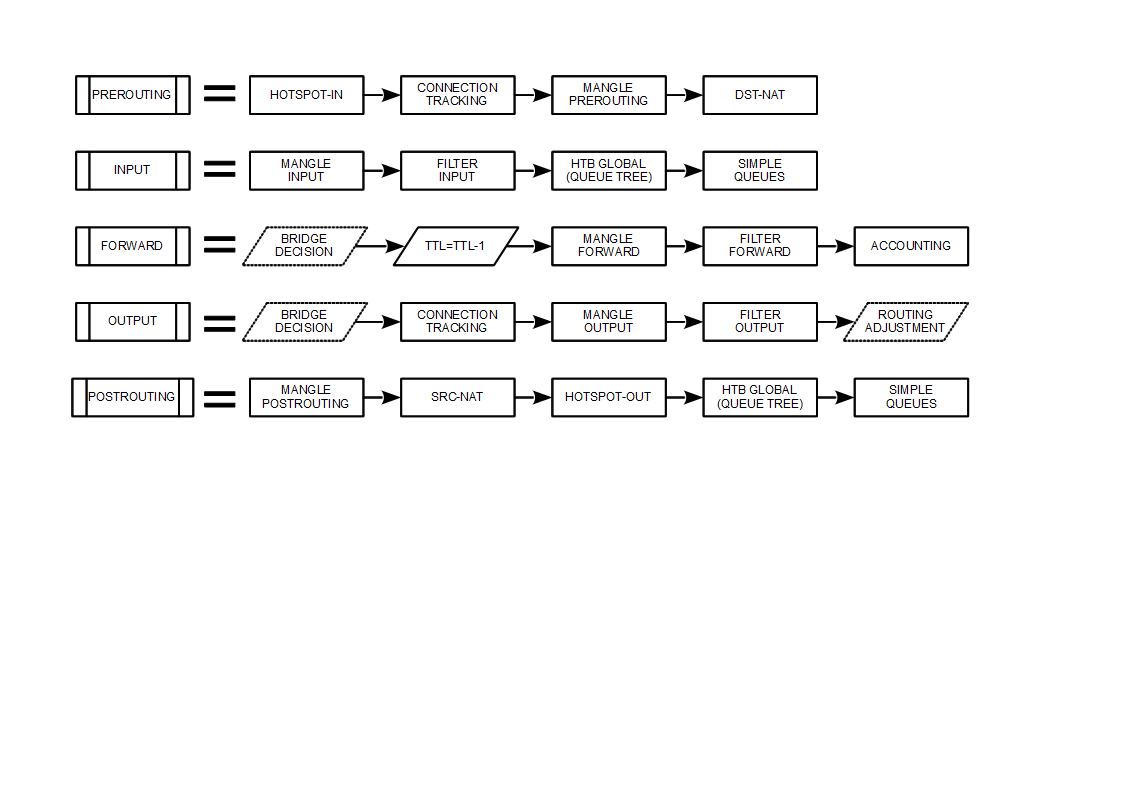
please please please can we do something before hotspot in, maybe like pre-hotspot-in or move it after mangel pre-routing so that we don’t have to count all traffic in a hotspot users sessions.
I really need to allow some sites not to be accounted for in a hotspot session!
letters are transition points from the first main diagram to more detailed ones. This way we reduced amount of information in main diagram
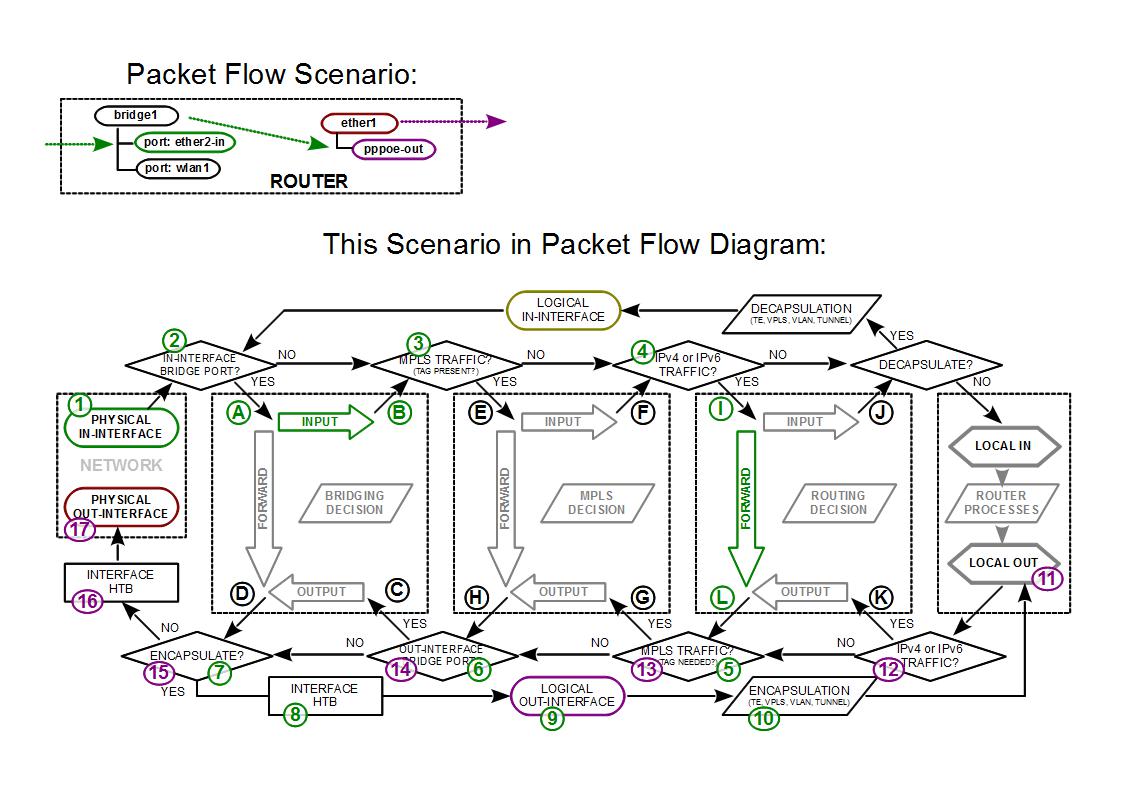
numbers are used to show packet path through router
The new diagram is really good.
It is clearer than the previous diagram.
Like the new diagrams. One suggestion is to add detail on the “Use MPLS?” and “Use Route?”. If you compare these decisions in the flow chart to the first decision after physical input, “In-Interface Bridge Port?”, it seems to me that the first decision is much more self describing than the others – “Is the in-interface in a bridge?” vs. “Are we going to use MPLS?” If it was more clear as to the logic for “Use MPLS” or “Use Route”, then it might be more useful in learning RouterOS.
Looks clean guys. Nice work.
Thanks for the suggestions. First post has been updated with new images. Please make more suggestions, what more examples would you need in the manual?
Not quite clear where the entrance/exit points are. In my opinion, it would be better if physical interface nodes were visually “open” (not frame-bounded to each other).
they are indicated by green/red color
very nice. maybe soon i could understand hope so
Very nice but unfortunately still no place for old feature request Umetered Content for PPP http://forum.mikrotik.com/viewtopic.php?f=1&t=45934&start=50#p235456
When it will be use in 6.x ? ![]()
it IS, just like the previous one. it’s just a look from another point. like a map VS globe - the Earth is still the same ![]()
I am not sure if I understand it correctly. If possible, can you write some explanation under each packet flow diagram?
traffic goes into the “green” physical interface. then follow the arrows and answer questions.
How do trunks (LACP) come into this?
Or are they “transparent” as far as the packet flow diagram is concerned?
Please help me understand as I’m obviously missing something here…
In ROS 5 you could double-QoS by:
1)Mangle in prerouting, prioritise in Global-In HTB (all in prerouting sub-section)
2)Mark in forward/postrouting, shape in Interface HTB
Now in ROS 6 the global HTB resides in the Input chain, not the prerouting chain!?
So how do I achieve double-QoS with ROS6 then?
Regards
Ekkas
in v6: