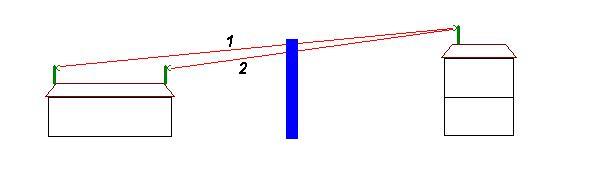
I have P2P link (RB411AH) at 5GHz and almost a LOS (Program said it’s LOS but in a fact it isn’t)…
I’m talking about meters at the distance of 3 km.
Therefore I raise antenna (19 dB) a little higher (but now can’t comfirm did LOS reached)…
Anyway, I have a stable -66 dB signal (Tx strenght default) but it’s not working good…
Whenever some significant capacity is reached a link is going down.
(And I need 10Mbps at most…)
My questions are:
If I have enough signal (like <70 as here) should my NLOS link work? In other words, is signal strenght only criteria for link connection?
Can I somehow improve it by wider or narrow ch size or Tx strenght or so?
I know I should take 2,4 (less is not an option) but right now I don’t have any so it will have to wait… Until then I would like to determine a problem and solve it if it’s possible…
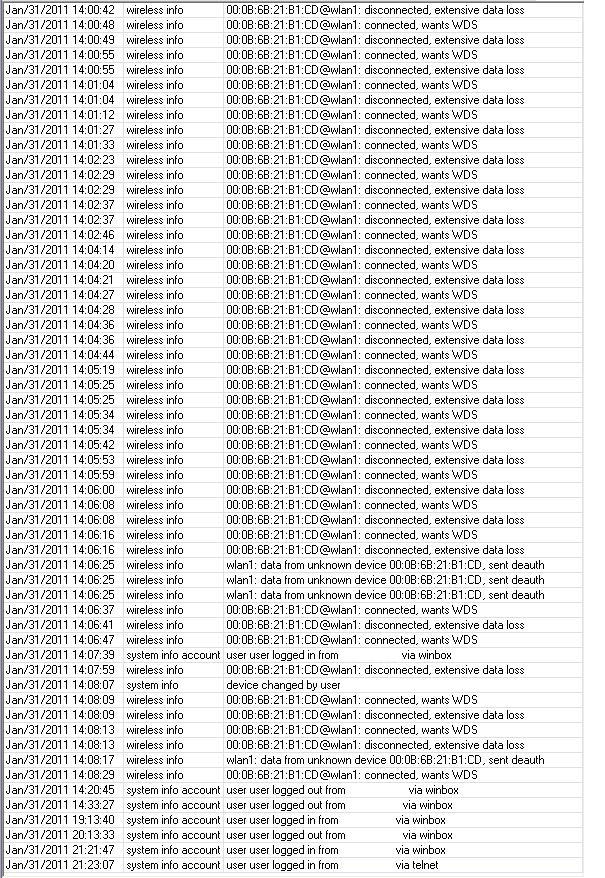
What does the station log have? I had problems with this when my system got busy, and my signal was around -50db on each. These were my entries:
On AP:
jan/14 02:46:53 wireless,info 00:0C:42:60:F9:CE@wlan1: lost connection, no beacons received jan/14 02:46:55 wireless,debug wlan1: must select network
jan/14 02:46:55 wireless,debug 00:0C:42:60:F9:CE: on 5825 AP: yes SSID WiFiBridgeMain caps 0x421 rates 0xff00 basic 0x100 MT: yes
jan/14 02:46:55 wireless,debug 00:0C:42:23:32:A0: on 5745 AP: yes SSID WiFiBridge1 caps 0x421 rates 0xff00 basic 0x100 MT: yes
jan/14 02:46:55 wireless,info 00:0C:42:60:F9:CE@wlan1 established connection on 5825, SSID WiFiBridgeMain
I solved it by entering the station mac address in the AP wireless access-list, the AP mac address in the station wireless connect-list, then set “default-authentication=no” on both.
No disconnects for over two weeks, and I used to get them 4 to 5 times a day.
I enabled wireless logging to see the log entries in bold type.
Did you already solve the problem?
Imho it is caused due poor link quality.
Normal 802.11 links with CSMA or RTS/CTS are quite sensitive for multipath receipts or missing or corrupted frames.
By having links in NLOS or with ´Fresnel zone obstruction`a link can show high signal levels but when it comes to sending (lots of) data too many frames will get corrupted due to distraction, collisions or absorption of the signal fragments (vegetation). Also the noise at the receiver due multi-beam (reflections from elements on or off the surface) will be causing deteriorating signal quality.
A link that shows fine under almost idle circumstance might completely go wrong the moment high data streams are put on it.
Look at your Tx/Rx frames - Hw Tx/Rx frames to see how bad the link is. CCQ is a first sign as well.
To improve things is off course to alter the heights of the antenna. (Higher!)
Second is to use narrower beam antenna’s (better directional with higher gain)
Sometimes it helps a little to DEcrease signal output on one or both ends (as long as you stay below -75).
Setting lower Data rates in the AP (leave CPE at default) makes link also more stable. Set one data rate only (and basic rate at same).
You can also try 10Mhz channel width instead of 20Mhz. Or, even 5Mhz. (But now your throughput is also only 25% of set date rate.
Last option if all above don’t work and link is really important; split it in two. Setup new tower in-between both points to reach at the location where LOS is becoming NLOS! (Thus where the Freznel would be disturbed/obstructed most.)
Hope this is of help if your problem is not already solved anyway..
thank you for your care.
I’ve solved the problem, here what I did.
Unfortunally, I can not get LOS from any place of the object but I put antenna on further wall of the object so I have better signal (I did this in the first place but I had errors).
I also get maximum height and for bigger pole I would need more serious tower which then has several difficulties…
Anyway, I think problem was in 10 MHz channel that I put by default. Then I put 20 and it’s working fine.
As you I also expected narrow channel size would be better. Why is not so I don’t know.
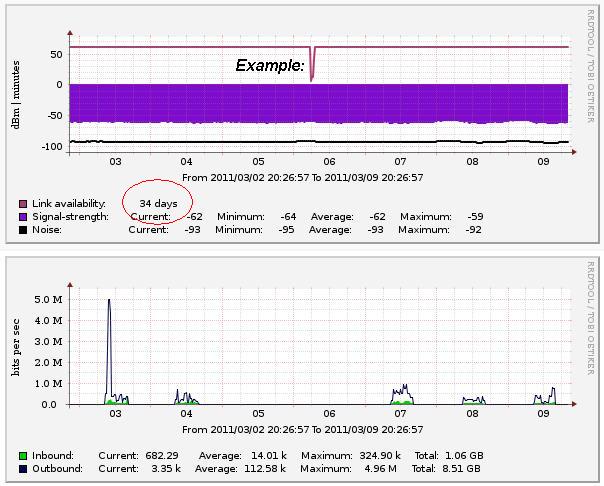
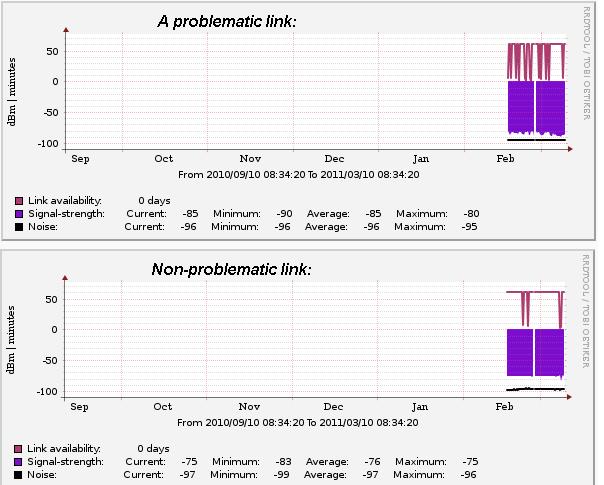
Here is my link now (from Cacti):
From the picture you can see:
Signal level (arround 62 dBm)
Noise level (arround 93 dBm - decreesed dut to NLOS but still enough).
Link availability (it’s 34 days so it’s perfect. No problem even once. Red line would be straight but I just showed what would happen if link go down at some point so you get a gap. Of course, in that case Link availability would start from 0 again).
Bit per sec - you can see 5 Mbps on the graph. It goes even better.
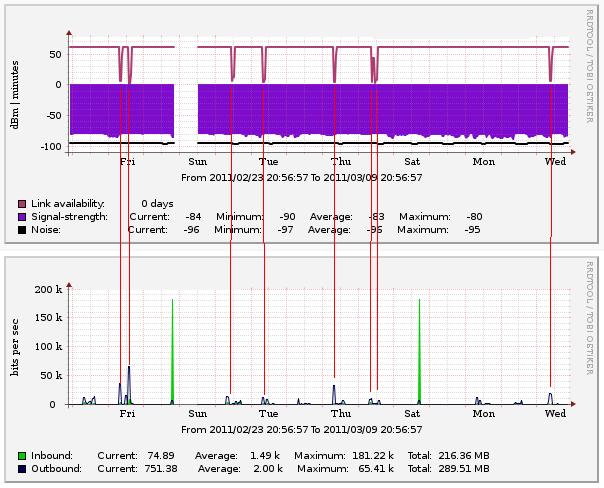
Now, what has actually happened?
I’ve notice that every time speed was big (and I would say more than 10 Mbps) with 10 MHz channel size - a link gone down.
Why is that happening I don’t know… From my opinion it should only reduce throughput and not break the link. But it’s not happening.
Look at this one problematic link… The outbounde traffic crash the link (and inbound not).
And look how small rates those are… But ok, this one is not so important therefore still didn’t get time to improve it
However, it’s very interesting to see what’s going on…
And that was same problem with my upper link but it was problematic when traffic was over 10 Mbps.
When I put channel size at 20 MHz everything is fine!
Very good explanation!
How did you produce these graphs? I want to set something up like that since I am, together with many others, fighting with several links that have regular disconnects in further very strong and stable links. It all happened after introducing nv2 package or even the use of it.
To find out if the traffic throughput in relation to the physical limit of the link has anything to do with it I could really use such tool.
Can you please spare me the details and how to set it up? Maybe some config examples on rb’s as well on how it is setup?
Thnks in advance..
To create SNR graph is not problem.
You need just a MIB’s for signal and for noise then put them together.
But the magic was in link availability
Since Cacti take samples from a 5 min periods it’s useless for instantaneous link loss that last for a second.
Idea is to map Uptime in Registration tab of Wireless Tables.
When link go down after new connection Uptime start from 0.
Then it doesn’t matter anymore that you taking 5 minutes samples (or more) since it has lower value.
Now you just need to collect those data
In a long term this graph would constantly grow. I don’t need that, so we made it to have maximum of 60 (minutes).
If Uptime is less then 60 it graphs real time value. If is greater then 60 it graphs 60.
So you can see gaps of link break ups as a saw line.
And value of uptime is writed as a number value below graph.
Also, it takes minimum values (not average) so in a long term periods you can stil see gaps (average would make all of them at 60).
Minimum value of Uptime, Minimum value of Signal and Maximum value of noise.
In a 6 month graph they look like this:
So you can easily see problematic and non problematic link
I’ll check if there’s somewhere link of this script and I’ll let you know.