Netwatch
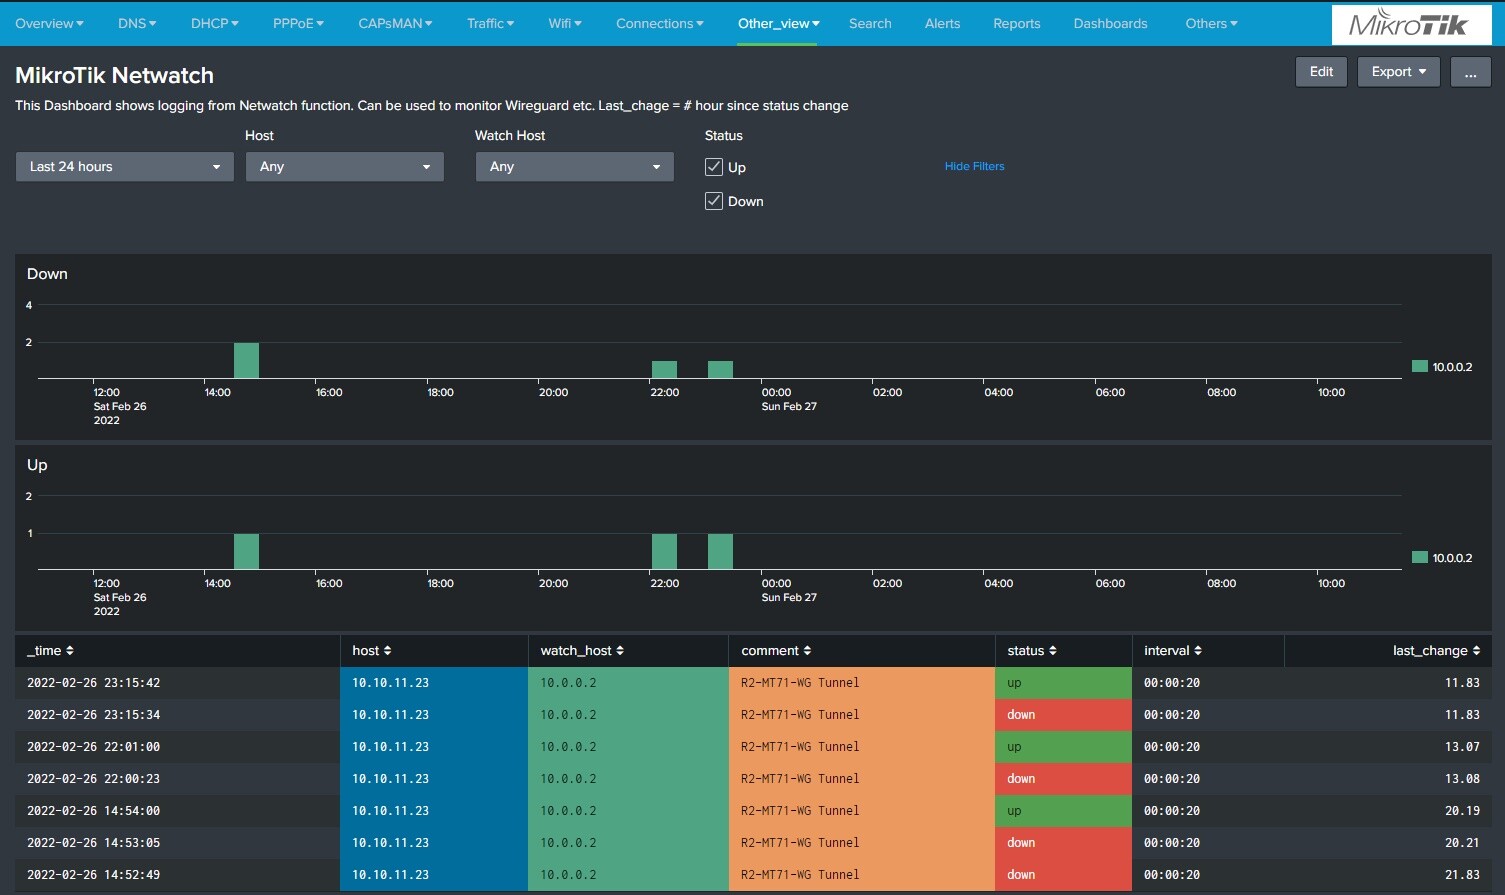
This part shows how to use the MikroTik Netwatch dashboard.
Idea with this part are to monitor one or many IP and get a good logging information of up/down time of a watched IP.
Setup.
Lets say you like to monitor a WireGuard VPN tunnel. There are noe traces of up down status for WireGuard in the RouterOS, so using Netwarch to see if remote IP is up or down is a way to see status of it.
Script
System->Scripts->Add script.
Name: Netwatch
Script:
####################################
# Netwatch script
#
# Used as both up and down script
# Created Jotne 2021 v1.5
#
####################################
:local Host $host
/tool netwatch
:local Status [get [find where host="$Host"] status]
:local Comment [get [find where host="$Host"] comment]
:local Interval [get [find where host="$Host"] interval]
:local Since [get [find where host="$Host"] since]
:log info "script=netwatch watch_host=$Host comment=\"$Comment\" status=$Status interval=$Interval since=\"$Since\""
Tools->Netwatch
Add Host ip. For WireGuard, that would be ip on the other side of the tunnel.
Host: 10.0.0.2
Up: Netwatch
Down: Netwatch
Comment: WG-Tunnel-22 (This name is important to set, since this will identify what this Netwatch do watch.)
/tool netwatch
add comment=WG-Tunnel-22 down-script=Netwatch host=10.0.0.2 up-script=Netwatch
You can ass as many netwatch IP as you like. It will take resource from the router, so do not add to many that test to often.
.