Using Splunk to analyse MikroTik logs

This software has been updated. 2.0 found here:
https://forum.mikrotik.com/viewtopic.php?f=2&t=137338


If you like the perfect tool for analyze MikroTik logs, look at Splunk.
For up to 500MB of log pr day, its absolutely free :slight_smile:


Here is a simple install tutorial:

Download and install Splunk (Windows or Linux(recomended))

Change to free license group. Very important to do before 30 day of use. !!!
Settings->licensing->Change license group->Free licnse->Save

Open Windows Firewall for UDP on Windows
Start->type “adv”->Select:Widows Firewall with Advanced Security->Sect Inbound rules->Right Click “Inbound Rules”>New Rule-Port-Next->UDP->Specific local ports->514->Next->Next->Next->Name “syslog”

Allow UDP 514 (syslog)
Setting->Datainputs->Add new (behind the UDP)->Port 514->Next->Sourcetype type syslog and select syslog->Next-Submit

Install “SNMP”
At launch page click the gear near the Apps
Brows more apps->in search field-> SNMP Modular Input->Install->use your user/password (from splunk.com)

Download the ZIP file
Extract it with all its folders and copy them to %Splunk home%/etc/app
MikroTik_1.1.zip (44 KB)
NB!! files in folder splunk/etc/apps/MikroTik/bin needs to be executable. Do this:

chmod +x *.sh

On your Mikrotik
Send Sylog from your Mikrotik to Splunk
System->Logging->Action->Add New->Name (your server name)->Type:Remote->Remote Address:ip your syslog->Ok

add name=Server_Name remote=192.168.1.x target=remote

To get all logs except debug (normal ok)
System->Logging->Rules->Add new->Enable:v->Topics:!debug->Prefix:MikroTik->action:your syslog server->Ok
It is very important to name the prefix like this “MikroTik” and not “mikrotik” or some other. It will break all.

Edit: This gets all logs from dhcp and hotspot, incluing debug, pluss it gets info logs from all other modules, except snmp that I do not need.

add action=remote prefix=MikroTik topics=dhcp
add action=remote prefix=MikroTik topics=!debug

Then you can start select what to log.
You should at least log this rule “defconf: drop all not coming from LAN”
IP->Firewall->selec:defconf: drop all not coming from LAN->Log:v->Log Prefix:FW_Drop_all_from_WAN

add action=drop chain=input comment="Drop all from WAN " in-interface=ether1 log=yes log-prefix=FW_Drop_all_from_WAN

To make the Splunk work you need to name the roules, so Splunk knows where it come from.
Start Firewall rules with “FW_”, Nat rules with “NAT_” etc. Do not use space in name.
Example on logging Nat session to my web server:

add action=netmap chain=dstnat comment="Web -> Server" dst-port=80 in-interface=ether1 log=yes log-prefix=NAT_Web_Server protocol=tcp to-addresses=192.168.1.58 to-ports=80

Get data from MikroTik with SSH (does only work with Linux Splunk version)
https://wiki.mikrotik.com/wiki/Use_SSH_to_execute_commands_(DSA_key_login)
Add the private key to the folder: MikroTik\bin
Change script in MikroTik\bin to use correct key and IP (your MikroTik)

To get accounting data, you need to enable it on the MikroTik router
Web Gui
IP-> Accounting → Enable Accounting → mark - Apply
I have set threshold to 2560 (not sure what is default)

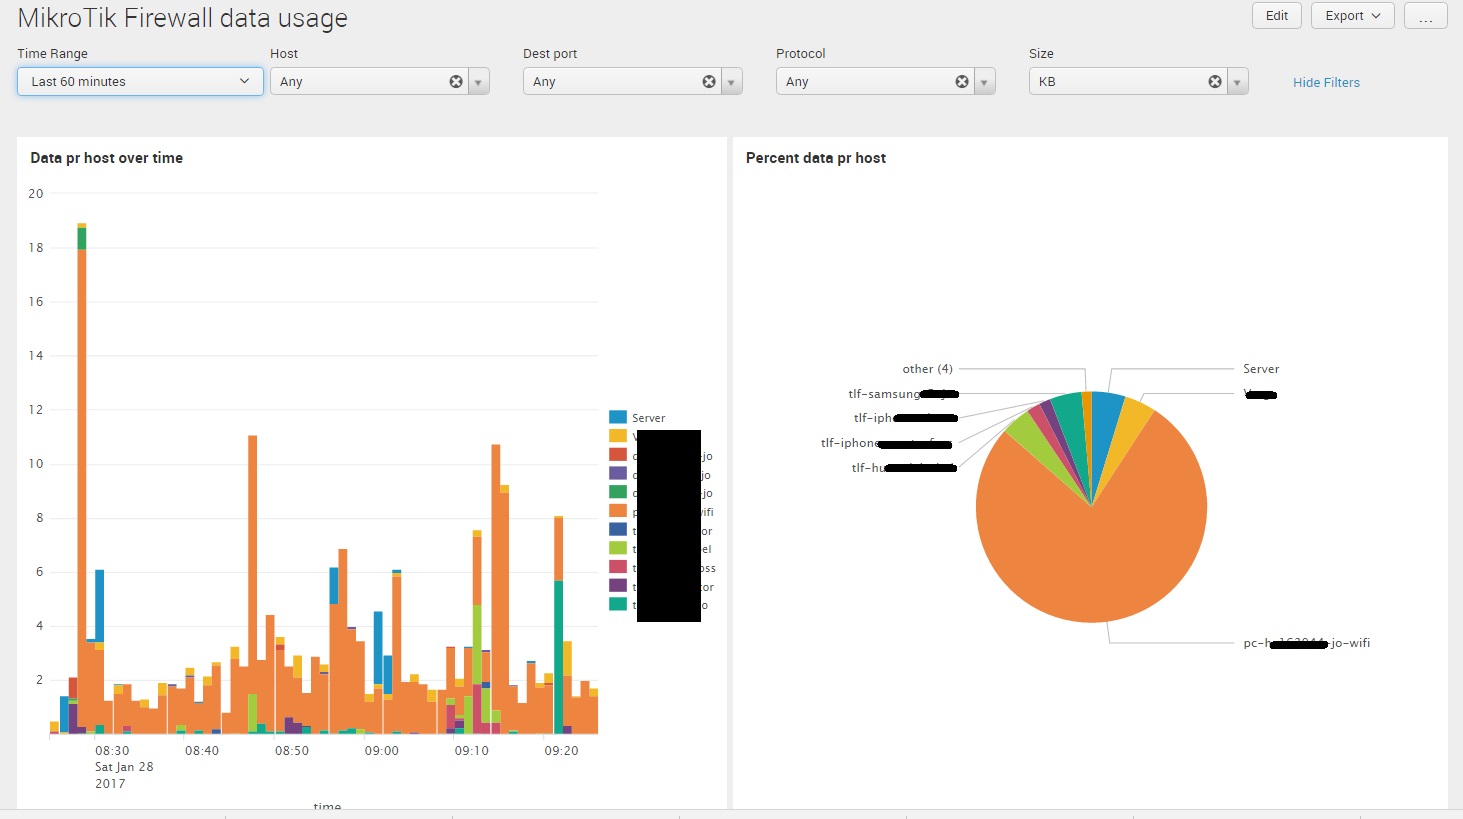
MikroTik Firewall data usage (MikroTik Traffic) (in Mikrotik/defaul/data/ui/views/mikrotik_firewall_data_usage.xml
Edit all lines with:
search ip=“10.10.10.0/24”
to your inside IP


Script to get DHCP pool information. Important that it use the same name as below:
DHCP-Pool-information

# List stats for IP -> Pool
# v1.1
# http://forum.mikrotik.com/t/ip-pool-statistics/36541/1
# criticalthreshold = output pool display in red if pool used is above this %
# warnthreshold = output pool display in gold if pool used is above this %

:local criticalthreshold 90
:local warnthreshold 80
:local hostname [/system identity get name]

# Internal processing below...
# ----------------------------------
/ip pool {
   :local poolname
   :local pooladdresses
   :local poolused
   :local poolpercent
   :local minaddress
   :local maxaddress
   :local findindex
   :local tmpint
   :local maxindex
   :local line

 #  :put ("IP Pool Statistics")
 #  :put ("------------------")

# Iterate through IP Pools
   :foreach p in=[find] do={

      :set poolname [get $p name]
      :set pooladdresses 0
      :set poolused 0
      :set line ""

      :set line ("pool=" . $poolname)

#   Iterate through current pool's IP ranges
      :foreach r in=[:toarray [get $p range]] do={

#      Get min and max addresses
         :set findindex [:find [:tostr $r] "-"]
         :if ([:len $findindex] > 0) do={
            :set minaddress [:pick [:tostr $r] 0 $findindex]
            :set maxaddress [:pick [:tostr $r] ($findindex + 1) [:len [:tostr $r]]]
         } else={
            :set minaddress [:tostr $r]
            :set maxaddress [:tostr $r]
         }

#       Convert to array of octets (replace '.' with ',')
         :for x from=0 to=([:len [:tostr $minaddress]] - 1) do={
            :if ([:pick [:tostr $minaddress] $x ($x + 1)] = ".") do={
               :set minaddress ([:pick [:tostr $minaddress] 0 $x] . "," . \
                                       [:pick [:tostr $minaddress] ($x + 1) [:len [:tostr $minaddress]]]) }
         }
         :for x from=0 to=([:len [:tostr $maxaddress]] - 1) do={
            :if ([:pick [:tostr $maxaddress] $x ($x + 1)] = ".") do={
               :set maxaddress ([:pick [:tostr $maxaddress] 0 $x] . "," . \
                                       [:pick [:tostr $maxaddress] ($x + 1) [:len [:tostr $maxaddress]]]) }
         }

#      Calculate available addresses for current range
         :if ([:len [:toarray $minaddress]] = [:len [:toarray $maxaddress]]) do={
            :set maxindex ([:len [:toarray $minaddress]] - 1)
            :for x from=$maxindex to=0 step=-1 do={
#             Calculate 256^($maxindex - $x)
               :set tmpint 1
               :if (($maxindex - $x) > 0) do={
                  :for y from=1 to=($maxindex - $x) do={ :set tmpint (256 * $tmpint) }
               }
               :set tmpint ($tmpint * ([:tonum [:pick [:toarray $maxaddress] $x]] - \
                                                    [:tonum [:pick [:toarray $minaddress] $x]]) )
               :set pooladdresses ($pooladdresses + $tmpint)
#         for x
            }

#      if len array $minaddress = $maxaddress
         }

#      Add current range to total pool's available addresses
         :set pooladdresses ($pooladdresses + 1)

#   foreach r
      }

#   Now, we have the available address for all ranges in this pool
#   Get the number of used addresses for this pool
      :set poolused [:len [used find pool=[:tostr $poolname]]]
      :set poolpercent (($poolused * 100) / $pooladdresses)

#   Output information
      :set line ([:tostr $line] . " used=" . $poolused . " total=" . $pooladdresses)
      :set line ([:tostr $line] . " percent=" . $poolpercent . " hostname=" . $hostname)

#   Set colored display for used thresholds
      :if ( [:tonum $poolpercent] > $criticalthreshold ) do={
         :log error ("IP Pool " . $poolname . " is " . $poolpercent . "% full")
         :put ([:terminal style varname] . $line)
      } else={
         :if ( [:tonum $poolpercent] > $warnthreshold ) do={
            :log warning ("IP Pool " . $poolname . " is " . $poolpercent . "% full")
            :put ([:terminal style syntax-meta] . $line)
         } else={
            :put ([:terminal style none] . $line)
         }
      }

# foreach p
   }
# /ip pool
}

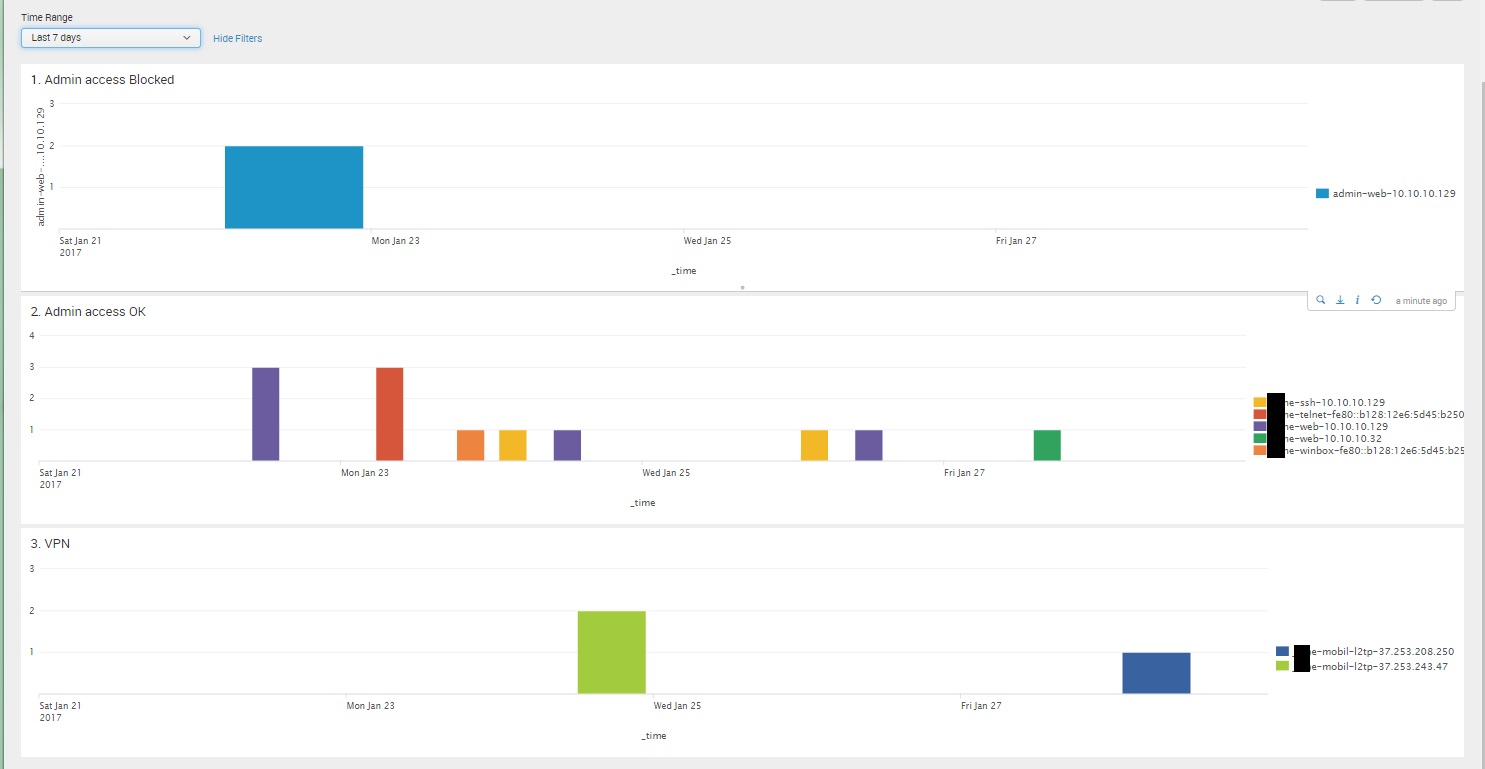
Gives a view of what the firewall does.
DNS Live view.jpg
I use this to see who is online. You can also create views to see the actual DNS request
Firewall analyzer.jpg
Shows all DHCP request
DHCP requests.jpg

Here you see all the tries to log inn the the admin gui of the Mikrotik, as well using various tunnels.
Live atack.jpg
Who is hammering on your blocked firewall ports?
Remote access.jpg
Who is eating up your bandwith?
Firewall data usage.jpg

Temperature and voltage in the MikroTik.
Volt-Temperature.jpg

Sure I will do.

Setup where the logging should go:
System->Logging->Action->remote
Type:Remote
Remote Address: your Splunk or other logging servers IP
Remote port: 514 (default)

Then you setup what to log.
System->Loging-Rules->Add new
Enabled x
Topics: ! ups (see the not. So I log all but not ups. This is a tric to get all)
Prefix: MikroTik (I set this so that all i tagget MiktroTik in the syslog)
Action: Remote (Send to syslog server)

You can also add logging of firewall.
Eksample last rule that block all that is not allowed:
10 ;;; defconf: drop all from WAN
chain=input action=drop in-interface=ether1 log=yes log-prefix=“rule_10”

Her I have set log=yes and log-prefix=“rule_10”
I give all log rule and nat rule different number. Then its easy to see in Splunk what rule that block the data.

I have also added a module for Splunk so that it can read SNMP.

Can you graph data usage by MAC address?


Sent from my iPad using Tapatalk

If you disable “debug” instead of “ups” your log space is not wasted with unuseful “debug” information for not debugging.
For logging all firewall must be one rule at the top chain=forward action=log (and if is needed to monitor router CPU traffic chain=input action=log and chain=output action=log)

Yes.
As long as its in the log message. Ex DHCP has MAC in their message.
You can also make a CSV table in Splunk with IP/MAC/Hostname etc and do a lookup on the fly.


Good tip. I did also add !SNMP since SNMP request from Splunk flods my log.

Will try it out.

would love some more info on the searches you have used to build the graphs etc here, they look great.

A very brief MikroTik-Splunk wiki perhaps? :wink:

Its not just as simple as post the search.

Splunk is a complex tool, and you need to have some insight on how tings works.
Best way to make it easy for other to use is to make an app of it.
I have done som app before, but its time consuming.

Example this dashboard that show live attack.

<form>
  <label>MikroTik Live attack</label>
  <fieldset submitButton="false">
    <input type="time" token="global_time">
      <label>Time span</label>
      <default>
        <earliest>rt-5m</earliest>
        <latest>rt</latest>
      </default>
    </input>
    <input type="dropdown" token="port">
      <label>Port</label>
      <choice value="*">Any</choice>
      <default>*</default>
      <fieldForLabel>info</fieldForLabel>
      <fieldForValue>dest_port</fieldForValue>
      <search>
        <query>sourcetype=mikrotik module=firewall chain=input rule=10
        | top limit=0 dest_port
        | eval info=dest_port ." (".count.")" 
        | sort - count</query>
        <earliest>$global_time.earliest$</earliest>
        <latest>$global_time.latest$</latest>
      </search>
    </input>
  </fieldset>
  <row>
    <panel>
      <map>
        <search>
          <query>sourcetype=mikrotik
          module=firewall
          chain=input
          rule=10
          dest_port=$port$
          | lookup dnslookup clientip as src_ip OUTPUT clienthost as src_host
          | iplocation src_ip
          | eval City=if(isnull(City) OR City="", "Unknown", City)
           ,src_host=if(isnull(src_host) OR src_host="", src_ip, src_host)
           ,info=src_host."-".City."-".Country."-".dest_port.":".protocol
           | geostats globallimit=0 count by info</query>
          <earliest>$global_time.earliest$</earliest>
          <latest>$global_time.latest$</latest>
          <sampleRatio>1</sampleRatio>
        </search>
        <option name="drilldown">all</option>
        <option name="mapping.choroplethLayer.colorBins">5</option>
        <option name="mapping.choroplethLayer.colorMode">auto</option>
        <option name="mapping.choroplethLayer.maximumColor">0xDB5800</option>
        <option name="mapping.choroplethLayer.minimumColor">0x2F25BA</option>
        <option name="mapping.choroplethLayer.neutralPoint">0</option>
        <option name="mapping.choroplethLayer.shapeOpacity">0.75</option>
        <option name="mapping.choroplethLayer.showBorder">1</option>
        <option name="mapping.data.maxClusters">100</option>
        <option name="mapping.map.center">(0,0)</option>
        <option name="mapping.map.panning">1</option>
        <option name="mapping.map.scrollZoom">0</option>
        <option name="mapping.map.zoom">2</option>
        <option name="mapping.markerLayer.markerMaxSize">50</option>
        <option name="mapping.markerLayer.markerMinSize">10</option>
        <option name="mapping.markerLayer.markerOpacity">0.8</option>
        <option name="mapping.showTiles">1</option>
        <option name="mapping.tileLayer.maxZoom">7</option>
        <option name="mapping.tileLayer.minZoom">0</option>
        <option name="mapping.tileLayer.tileOpacity">1</option>
        <option name="mapping.type">marker</option>
      </map>
    </panel>
  </row>
</form>

It needs several extraction and trans coding.
Like how to get modul type out.

EXTRACT-mikrotik_modul_status = ^(?<module>[^\s,]+)(,|)(?<info1>.*?)(,|)(?<severity>(debug|info|warning|critical)|)(,(?<info2>(packet|account|state|calc|event))|\s)

Nice! :smiley:
https://www.graylog.org/ is an alternative, if you need more than 500 MB of logs per day.

Wow! That screenshots are great.
We need to log firewall activity and some security warnings. Is it possible to do on out of the box installation, or additional splunk tuning required?
By this time we installed splunk, configured to listen on 514 port, also configured MikroTik to send logs, but its totally mess.
I suppose, that i should create custom views or may be you can share your’s or make some begginers guide. Thanks.

Splunk is not easy to use out of the box.
It needs to learn how the structure of the data that is entering the index.

To make this to work, you need to tag all message with Mikrotik.
System-Logging-Rules
Edit the rule that sends syslog and in Prefix add MikroTik

I will post some files that help you to get going.

Create a folder so its like this: (your splunk default folder may be different)
/opt/splunk/etc/apps/MikroTik/default

Create this files:
props.conf

[source::tcp:514]
TRANSFORMS-force_mikrotik = force_mikrotik

[source::udp:514]
TRANSFORMS-dns=remove_dns_query,remove_dns_answer
TRANSFORMS-force_mikrotik = force_mikrotik

[syslog]
TRANSFORMS-force_mikrotik = force_mikrotik

[mikrotik]
SHOULD_LINEMERGE = false

EXTRACT-mikrotik_ip_accounting = ^(?<src_ip>\d+\.\d+\.\d+\.\d+)\s(?<dest_ip>\d+\.\d+\.\d+\.\d+)\s(?<byte>\d+)\s(?<packet>\d+)
EXTRACT-mikrotik_modul_status = ^(?<module>[^\s,]+)(,|)(?<info1>.*?)(,|)(?<severity>(debug|info|warning|critical)|)(,(?<info2>(packet|account|state|calc|event))|\s)
EXTRACT-mikrotik_ssh_user = ^ssh,debug .*(user|auth req):\s(?<user>\S+)\s
EXTRACT-mikrotik_system_info = ^system,info,account .*user\s(?<user>\S+)\slogged in from\s(?<user_location>\S+)\svia\s(?<user_system>\S+)
EXTRACT-mikrotik_system_action = ^system,info .*:\s(?<change>.*)\s(?<action>[\S]+)\sby\s(?<user>\S+)

EXTRACT-mikrotik_firewall_info1 = ^firewall,info.*?(|rule_(?<rule>\d+))\s(?<chain>(srcnat|dstnat|input|output|forward)):\sin:(?<in_if>\S+)\sout:(?<out_if>\S+),\ssrc-mac\s(?<src_mac>\S+),\sproto\s(?<protocol>[^ ,]+)[^\d]+(?<src_ip>[^:]+):(?<src_port>[^-]+)->(?<dest_ip>[^:]+):(?<dest_port>[^,]+),\s(NAT.*|)len\s(?<length>\d+)

EXTRACT-mikrotik_dns_src = dns,packet.*from\s(?<src_ip>[^:]+):(?<src_port>\d+)
EXTRACT-mikrotik_dns_site = dns,packet.*question:\s(?<site1>[^:]+):(?<site_type>[^:]+):(?<site_direction>[^:]+)
EXTRACT-mikrotik_dns_record_1 = dns.*query from\s(?<src_ip>[^:]+):\s#(?<ses_id>\d+)\s(?<site>\S+)\.\s(?<record_type>\S+)
EXTRACT-mikrotik_dns_record_2 = dns,packet.*\s<(?<site2>[^:]+):(?<record_type>[^:]+):(?<record_id>[^=]+)=(?<record_info>[^>]+)
EXTRACT-mikrotik_l2tp_src_ip = first L2TP UDP packet received from\s(?<src_ip>\S+)
EXTRACT-mikrotik_pptp_src_ip = TCP connection established from\s(?<src_ip>\S+)
EXTRACT-mikrotik_user_logged_in_1 = (?<user>\S+)\slogged in(,| from)\s(?<user_ip>\S+)(\svia\s(?<system>\S+)|)
EXTRACT-mikrotik_user_logged_in_2 = login failure for user\s(?<user>\S+)\sfrom\s(?<user_ip>\S+)(\svia\s(?<system>\S+)|)

transforms.conf

[code][force_mikrotik]
DEST_KEY =  MetaData:Sourcetype
REGEX =  \sMikroTik:\s
FORMAT =  sourcetype::mikrotik

eventtypes.conf
[ssh_user_authorized]
search = “ssh,debug * user: * authorized”

[ssh_user_auth_req]
search = “ssh,debug * auth req:”

[dns_got_query]
search = “dns,packet * got query from”

[dns_query]
search = “dns* query from*#”

[dns_question]
search = “dns,packet * question:”

[dns_reply]
search = “dns,packet * <::=>”

[dhcp_doman_server]
search = “dhcp,debug,packet * Domain-Server =”

[dhcp_received_request]
search = “dhcp,debug,packet * DHCP-Inside received request with id”

[l2tp_connection_from]
search = “l2tp,info MikroTik: first L2TP UDP packet received from”

[l2tp_user_logged_in]
search = “l2tp,ppp,info,account* logged in,”

[pptp_connection_from]
search = “pptp,info* TCP connection established from”

[pptp_user_logged_in]
search = “pptp,ppp,info,account* logged in,”

[adm_user_logged_in]
search = “system,info,account* user * logged in from * via”

[adm_user_login_failure]
search = “system,error,critical* login failure for user * from * via”[/code]

Thanks a lot for sharing!, its a good point to start using splunk with Mikrotik

Yes, as long as Mikrotik sends out any information to the Splunk you can graph it.

Here are some example on where mac is used.

firewall,info MikroTik: rule_11 dstnat: in:ether2-master out:(none), src-mac d0:e7:82:d6:71:b5, proto UDP, 10.10.10.132:44407->8.8.8.8:53, len 60
firewall,info MikroTik: rule_99 input: in:ether1 out:(none), src-mac 00:05:00:01:00:01, proto TCP (RST), 81.xx.xx.210:443->92.xx.xxx.134:52490, len 40
dhcp,info MikroTik: DHCP-Inside assigned 10.10.10.252 to AC:BA:54:00:FE:CC

But here I see some Mikrotik should fix. Use upper or lower case on the mac, not both…

With this I can graph stuff by mac.
Since we have a connection between mac and IP, you can store it to a db within Splunk and then later use it as lookup for other stuff.

Hello Jotne,

Can you please share your complete application ?

Thank you.

would also love if you could share your views.

thanks

Simon

Would you kindly tell me what and how I must configure from SPLUNK’ s side?

It’ s fully unclear for me…

Thanks in advance

Good Job!
I have successfully installed it and now everything is fine! but couldn’t find some of the options as you captured for example " Input Interface" and so on…
what about SNMP grabbing as you mentioned?

Here is what I use to get some SNMP information from the MikroTik:

inputs.conf

[snmp://MikroTik-info]
communitystring = public
destination = 10.10.10.1
do_bulk_get = 0
do_get_subtree = 1
ipv6 = 0
object_names = 1.3.6.1.4.1.14988.1.1.3
port = 161
snmp_mode = attributes
snmp_version = 2C
sourcetype = mikrotik
split_bulk_output = 1
trap_rdns = 0
v3_authProtocol = usmHMACMD5AuthProtocol
v3_privProtocol = usmDESPrivProtocol

It runs every 60 seconds (default) and gets the environment tree.
http://www.mibdepot.com/cgi-bin/getmib3.cgi?win=mib_a&r=mikrotik&f=MIKROTIK-MIB&v=v2&t=tree
You can use it to get any SNMP data you like. Eks interface statistics.

PS You need SNMP input module:
https://splunkbase.splunk.com/app/1537/