Stupid question, is it possible that the traffic to/from that single PC takes some other path than the L2TP/IPsec one? I.e. when you ping it from the remote site and run /tool sniffer quick interface= ip-address=ip.of.that.pc, can you see both the ping requests and the responses?
Morning.
I am not good with this sniffing, but I made two screen shots:
- pinging from central site to remote site computer to which traffic runs well
- ping from central site to remote site computer to which traffic runs extremly slow (also couple of other computers on remote network)
That seems ok right?
I was wondering, if turning on/off ipsec, maybe something goes wrong with dynamic ipsec creation?
Maybe manualy set peers and policies? never done that though.
Just for “fun” I asked they to plug some “faulty” pc into port on which the working pc is.
Could it mean something that working pc is the first in the ip pool? 50… all later don’t work.
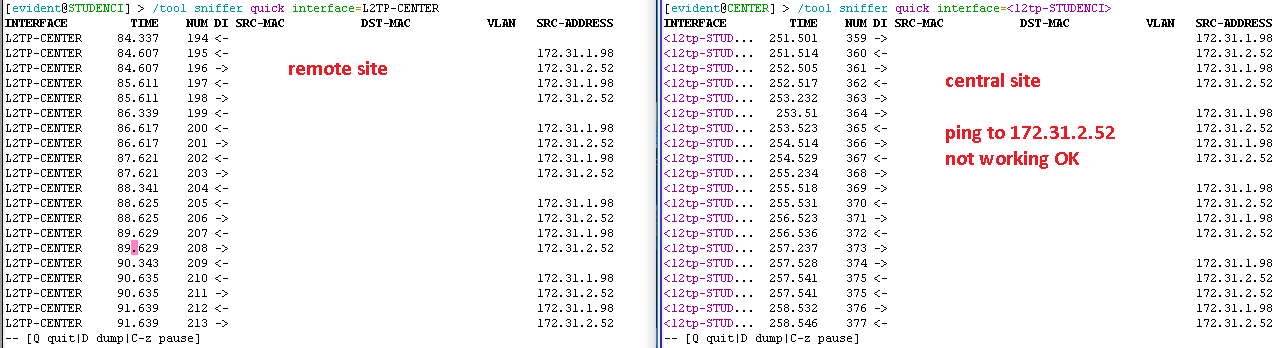
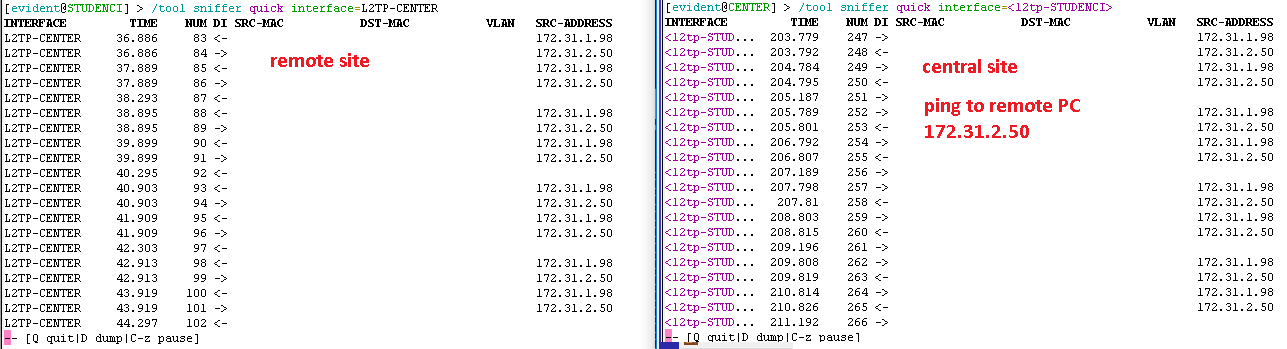
Both sets of sniff outputs show that both directions of the ping go through the tunnel. So that’s not the reason.
The easiest way is to use a_dd copy-from_ (only possible on command line), using the dynamically created items as templates for the static ones and changing only the parameters which have to differ, so peer name and, at the client side, the address, which you will change to the proper one later once you set use-ipsec to no). But I don’t think doing so will change anything, the actual processing of the packets by IPsec doesn’t know whether the configuration has been created dynamically or manually.
You took some shortcut here, I did’t get what you actually mean. Are you saying that any PC works fine if its IP address is .50? Or that any PC works fine if it is plugged into a particular Ethernet inteface of the 4011? How is the IP address assigned related to the physical interface used?
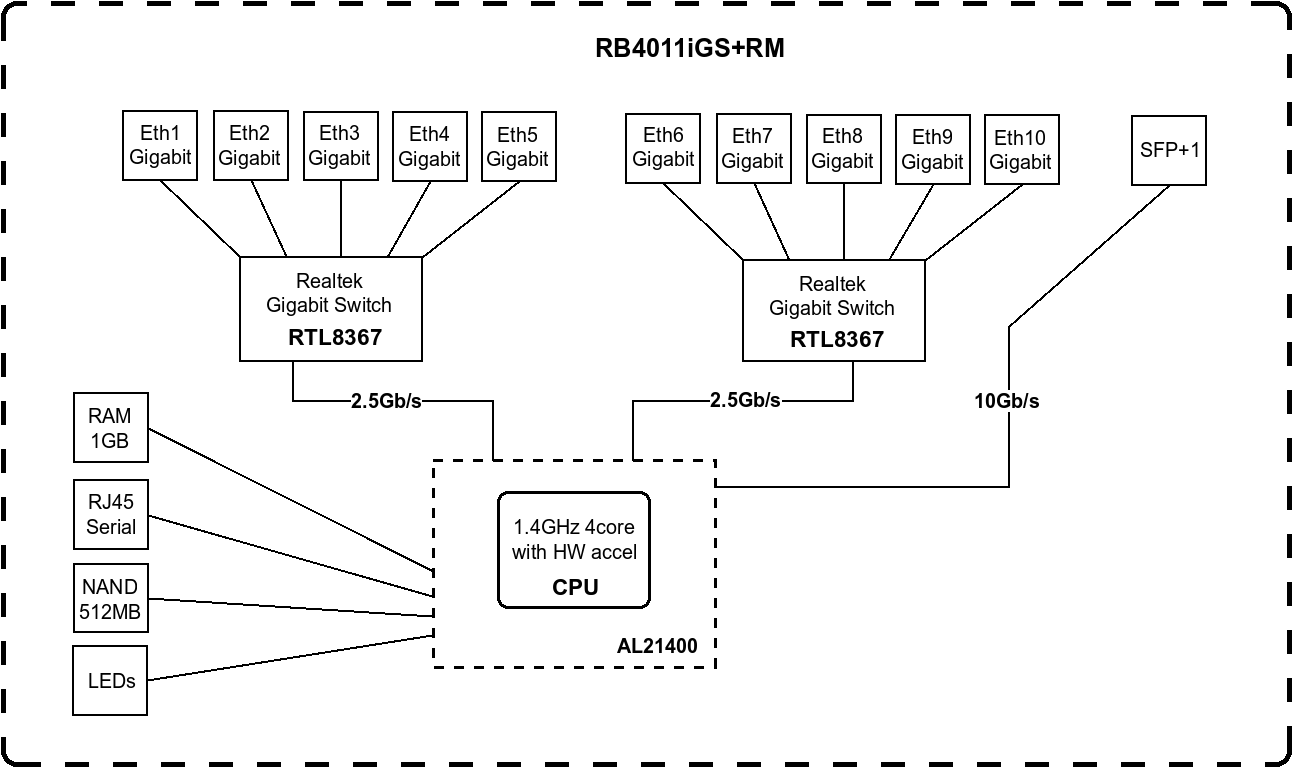
I could imagine something to be related to the block structure of the router.
Just for “fun” I asked they to plug some “faulty” pc into port on which the working pc is.
Could it mean something that working pc is the first in the ip pool? 50… all later don’t work.You took some shortcut here, I did’t get what you actually mean. Are you saying that any PC works fine if its IP address is .50? Or that any PC works fine if it is plugged into a particular Ethernet inteface of the 4011? How is the IP address assigned related to the physical interface used?
I ment that I am about to try:
- ask remote user to physicaly replug “non-working” pc into port where “working” pc is currently plugged
- to assign “working” pc IP address to a “non-working” one
- ask ISP to reset/check modems (must be in bridge)
I know these are voodoo shit attempts, but I am in a no clue land at the moment ![]()
I could imagine something to be related to the block structure of the router.
I would imagine that when I whiped all config, downgraded, that any “cached” stuff would be gone. Is it safe to assume that?
OK, so it is a plan, not a result.
If modems are in bridge mode, the ISP may have no management access to them.
I can imagine the ISP to selectively throttle IPsec traffic (although it would surprise me in your part of Europe), but that would have to affect all the connections running inside the tunnel, so the single “good” PC would have to be affected too.
That’s why I’ve talked about sniffing. It would make sense to sniff into file at both ends while speedtesting as described above, to see whether the packets get lost between the routers or whether already the sending router sends them slowly.
The only 100% sure way is netinstall, which requires physical access to the devices. The configuration done via RouterOS management interface is just the top of the iceberg, so theoretically something may remain wrong below even if you wipe the RouterOS config.
But back to the block diagram, I can imagine that PCs connected to the same switch chip like the WAN link have better conditions as each of the internal 2.5 Gbps lanes connecting the CPU to the switch chip may be linked to particular CPU cores, and having some stages of packet processing executed by one core and other stages of processing the same packet by another core could have an impact on the outcome. But it’s just a speculation, I have got no insider info.
Updates.
-
ISP reset/flushed/checked their modems. They are in bridged mode, no filtering enabled
Problem remains. Not a modem issue. -
Physicaly replugged working <=> nonworking pc
Problem remains. working pc is still working even if plugged elsewhere… nonworking pc still not working even if plugged into “working” port.
So it is not a port issue. -
I reassigned remote subnet from 172.31.2.0/24 to 172.31.3.0/24 and rebooted.
All workstations received new settings.
Working PC is still working.
Nonworking PCs still not working.
Is the problem in workstation somehow? (although I went to remote location yesterday with my laptop and it was also not working)
Is the problem on central router/network somehow?
Can you point me into sniffing again? how to make some useful snifs to check?
At both machines:
/tool sniffer set file-name=ipsec-xxx.pcap file-limit=5000
(5 megabytes should be enough to see what’s going on and not clog your ramdisk)
If /ip ipsec installed-sa print shows also :port in the dst-address and src-address, run /tool sniffer quick interface=ether1 port=4500; if there are only IP addresses, run /tool sniffer quick interface=ether1 ip-protocol=esp.
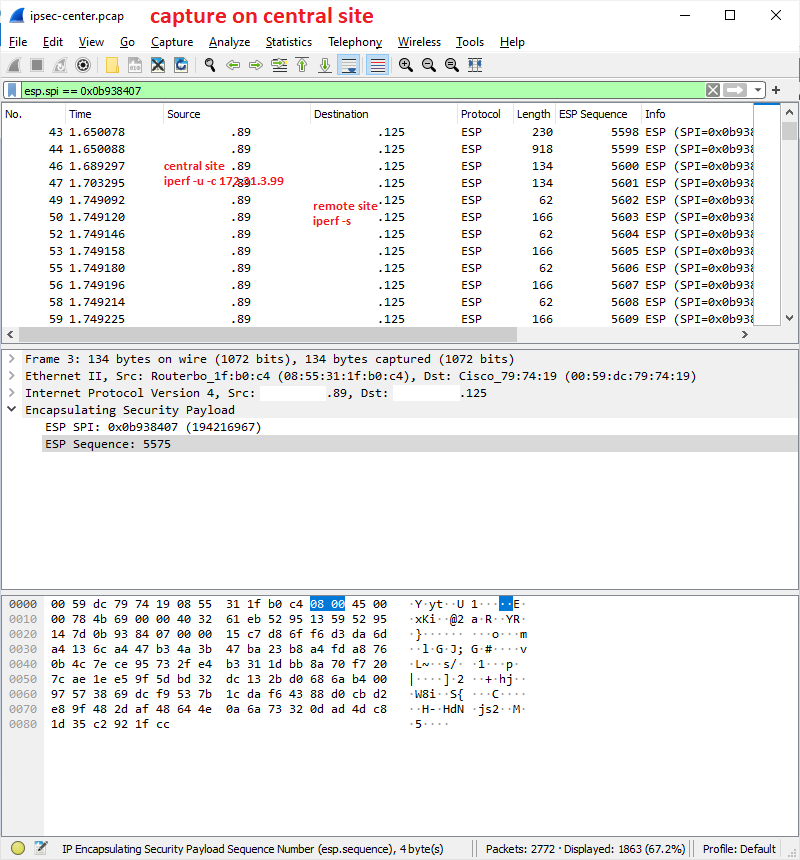
Now run the iperf in UDP mode for a few seconds. Then stop it, download the files, and open them using Wireshark. Set the display filter to esp. Select one packet which has the IP of the router, to which the iperf receiver is connected, in destination address in the packet list; expand the Encapsulating Security Payload, right-click the ESP SPI row that appears, and choose Apply as Filter → Selected. Then, right-click the ESP Sequence row, and choose Apply as Column.
Now look whether the sequence numbers are contiguous at both sides.
That’s just the first step, further steps will follow depending on the results.
SO SORRY TO ASK HERE!!!
I have access to my ISP ROS v6.29.1, THEY Provide PPPoE Connections…(btw they provide ubiquiti antennas to catch internet and Tenda routers…)
everything i learnt till now from Google isnt the same there, I am seeing there every User-Router is connected via ‘PPPoE Server Binding’ and different ‘Queues’ for all users BUT BUT BUT…
Everything is D-Dynamic there means i just cant remove or edit any queue and Interface (excluding WAN-Bridge), and in ‘IP-services’ there are two ports opened ‘www and winbox’…(everytime)
and there is a radius server for ppp only 13.57.xx.xx SO MY question is how do they add a pppoe user and from where they’re doing this… i have access to it for a long time and i will never HARM anything but MY Curious mind is trying to solve this mystery and If anyone can help me then im TOO much greatful to you guys… (apart from this THERE’S no api port open)
i also asked them about their websites but they told that they didnt host any website yet.
YAA They didnt have that ‘User Manager’
[quote=jazzLinda49 post_id=847031 time=1615028231 user_id=183594]
SO SORRY TO ASK HERE!!!
[/quote]
Why can’t you just open your own dedicated topic rather than randomly choosing unrelated ones?
The ISP simply holds the database of user credentials and connection parameters on an external server, and when a connection request arrives from a user, the router uses RADIUS to query that external server; if authentication passes successfully, the IP address, bandwidth restriction parameters etc. are provided to the router, which creates corresponding dynamic items. So no API needed.
Running 6.29.1 & management access open to clients, what sort of ISP is that…
[quote=sindy post_id=847036 time=1615029182 user_id=110692]
[quote=jazzLinda49 post_id=847031 time=1615028231 user_id=183594]
SO SORRY TO ASK HERE!!!
[/quote]
Why can’t you just open your own dedicated topic rather than randomly choosing unrelated ones?
The ISP simply holds the database of user credentials and connection parameters on an external server, and when a connection request arrives from a user, the router uses RADIUS to query that external server; if authentication passes successfully, the IP address, bandwidth restriction parameters etc. are provided to the router, which creates corresponding dynamic items. So no API needed.
Running 6.29.1 & management access open to clients, what sort of ISP is that…
[/quote]
Ohkk thanks… but how can i access the user database or External server as im curious about my unique Local ISP…(who just have some 200 users )
I am about to start capture, but I noticed something interesting.
If I run iperf server on remote site and iperf client on central site, I get slow connection - this is how I was running it.
But now I ran iperf client on remote site and iperf server on central site - I get normal result on problematic workstation.
REMOTE <=> CENTRAL
iperf -s <=> iperf -c 172.31.3.98 ==> slow: (sender 0 / receiver 253kbits)
iperf -c 172.31.1.98 <=> iperf -s ==> normal: (sender 62Mbits / receiver 61Mbits/)
What the heck…what is this telling us?
EDIT:
If I run iperf -u -c in direction when tcp is normal, udfp traffic is slow, like 1Mbits…
I don’t know how exactly iperf client and server talk to each other, but it seems like some NAT or routing issue, maybe on the iperf server and client machines rather than the Mikrotiks. So sniffing on the machines themselves might help understand the difference.
I did try to initiate a file copy from both sites to both sites and it is not going anywhere.
Will start capturing traffic now.
Packets on central site (initiating iperf) are in sequence.
Packets captured on remote site (iperf receiver) are kind of not in sequence, has gaps.
Did I capture it right?
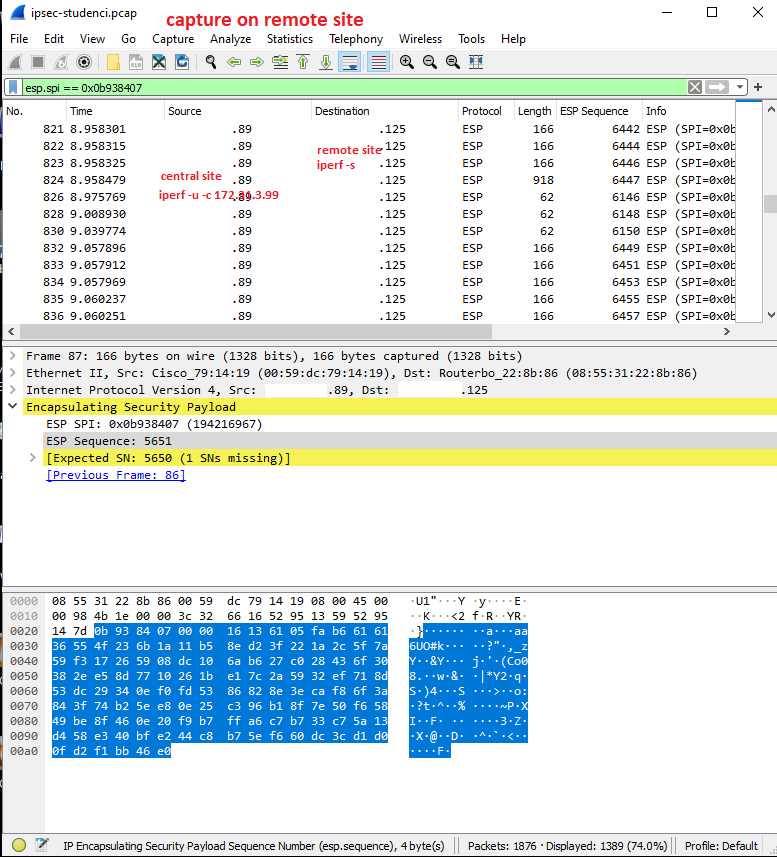
If this capture is a snapshot of what goes into the tunnel and capture what comes on the other side out, then it means that something is lost between mikrotiks?
What a mess!
Scroll the lists so that both show the same packet range, to make sure that the shuffling happens en route and not at the sending side.
In what you’ve posted, at the “client” side, half of the packets seem to have been lost, and packets with sequence numbers 61xx came among packets with sequence numbers 64xx, so I’d like to see that they have been sent in proper order.
Also, you can click the column header (ESP Sequence) of the packet list in the sniff from the receiving side, to make Wireshark sort the packets by ESP sequence numbers instead of capture order; this should show you whether the packets have been only shuffled or really lost.
left is sender: iperf -u -c 172.31.3.99
right is receiver: iperf -s
I sorted columns and positioned.
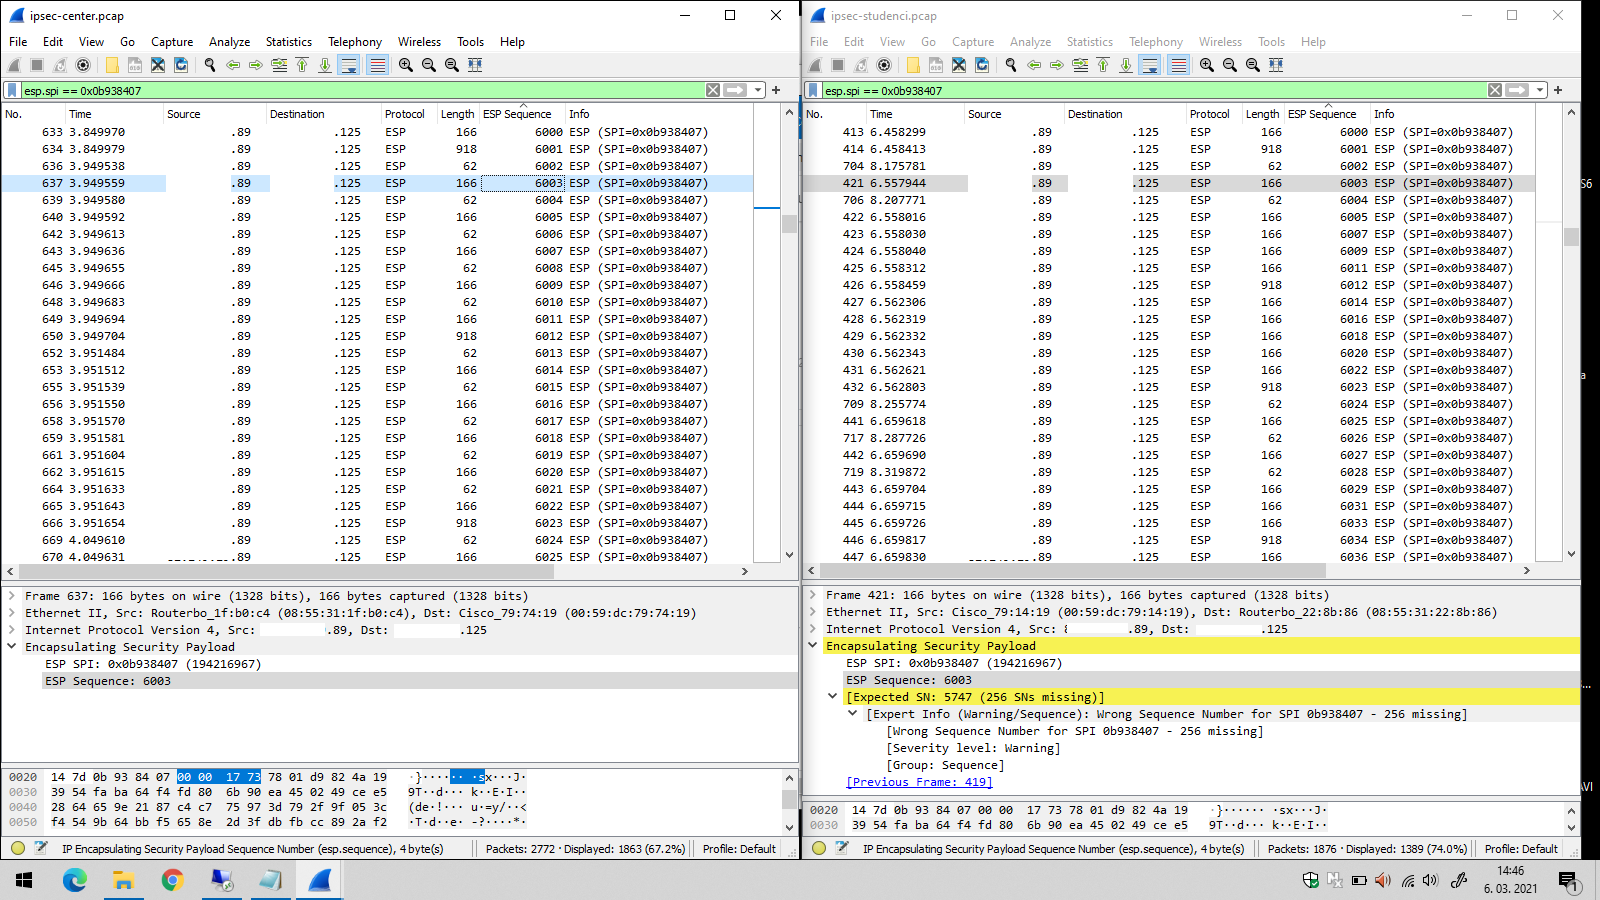
So some packets are completely missing, and some come more than 1.5 seconds late.
OK, so before starting to yell at the ISP, check whether you can mirror traffic at the switch chip.
Find (or make) a free port on switch chip 1 (etherX) and remove that port from the bridge. Then try the following command:
/interface ethernet switch set switch1 mirror-source=ether1 mirror-target=etherX
If that succeeds, connect an Ethernet port of a PC to etherX and sniff using Wireshark on it.
In the existing captures, Wireshark says the expected next sequence number was N but N+256 has arrived instead, which is weird (256 is a round number in computing). So if there is something wrong with the sending stack and the sniffer running directly on the Mikrotik doesn’t show that, this way you can make verify that the sending stack really sends the packets in correct sequence. Of course do that while sniffing at the receiving end as well, as the issue appears randomly. In fact it would be best to do this at both ends, but I understand that it may not be exactly easy to do in Studenci.
If the issue is really in the network, it could be related to the fact that since both routers have public IPs directly on themselves, the IPsec negotiates use of bare ESP which is more efficient. And ESP may be handled weird in the ISP network. So you may want to try to force NAT into the path between the IPsec stacks. Let me think for a while about the simplest way.
Sindy, I think I got it.
I added this mangle rule on both sides (with reverse addresses on another side) and I think I have full bandwidth now.
Let me test some more…
If this proves to be a fix I would appreciate if we can make some sense out of it.
/ip firewall mangle
add chain=forward action=change-mss new-mss=1350 passthrough=yes tcp-flags=syn protocol=tcp src-address=172.31.3.0/24 dst-address=172.31.1.0/24 tcp-mss=!0-1350
This is not a fix for UDP. Are you saying you are running iperf in TCP mode all the time?