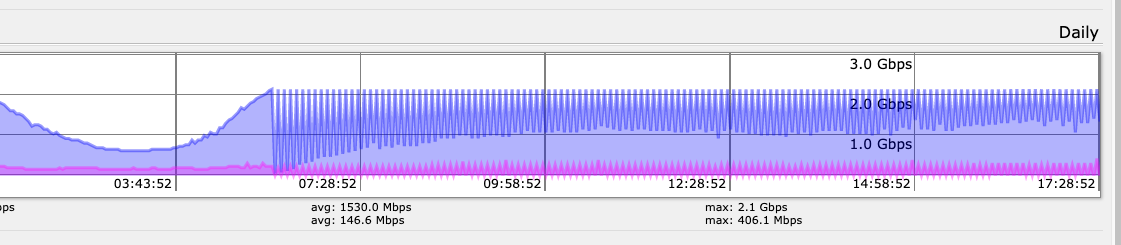
Having a weird problem, this is a CCR1072 running 6.44.3. Under Tools → Graphing, our upstream interface graph shows this:
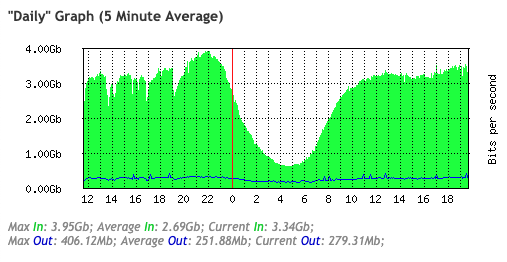
However, we are pushing closer to 4Gbps at peak times, which reflects in the HTML-based graph view:
Anyone have an idea why this is? I gave our service provider a riot act reading for capping us, then realized it was our monitoring that was failing.
I would say so, yes. Once your rate exceeds 2,147,483,647bps it seems to be doing a wraparound with -2.1Gbps as the starting point. It is a similar problem to SNMPv1 counter overflow. You can see the strange zig-zag pattern once you hit 2.1Gbps, the low “zags” every other datapoint are actually showing you the rate above 2.1Gbps (2.1Gbps becomes zero in those moments). So around the end of your graph where you see the low “zags” reach about “1.3Gbps” or so, that is actually 1.3Gbps above 2.1Gbps so your actual rate there would have been about 3.4Gbps.
I’ve never even looked there for graphs before. I watch the realtime graph in the interface sometimes and I look at the graphs webpage and both of those don’t seem to have any issue.