Probe Thread

I agree also.

What do you mean by
“i use this to take auto discovered wireless devices and auto ID them into Wirless APs device type.”

I really don’t understand probes and what all can be done with them. Could i make one that would tell me which port on a switch the workstation is attached to?

I think what he means is that when the devices are discovered, they will placed on the map as AP’s not switches or other devices which is what the Dude with my AP’s the first time around forcing me to manually change them into AP’s on the map. Thanks for the script.

As for what probes are and what you can do with them…probes are the method by which things are discoverd, and by things it can cover a pretty broad area. Hardware, software, protocols, configuration, etc. As to what you can do with them, that is what this thread was created for. Given enough experience and knowledge about things work, connect, and talk to each other, and with some study of the OIDs, you can build custom probes to perform a great many tasks.

As far as it goes, I am still learning about custom probes myself, this is why I suggested making this a sticky and inviting others to participate. I am sure that there are some among the 14000+ membersip here who would be willing to share knowledge with the rest of us.

Ok - I think i have the basics of snmp and OID’s but how do you implement probes. Can anyone give like some really basic examples to get started with?

yeah, just read the backscroll of this thread to get an idea of what people are using these for. i like the cisco processor one myself. i was wondering how to do that. the network is your oister.

Some more of my own

Is the proxy service up?
Name: proxy08080-google.es
Type: TCP
Port: 8080
Connect only: Unchecked
First receive, then send:Unchecked
Send: GET http://www.google.com/ HTTP/1.1\r\n\r\n
Receive: HTTP/1.1 200 OK

Be careful with this probe because it will fail in the following cases:

  1. You have an authenticated proxy
  2. You are in other country and you get a redirection (in my case to http://www.google.es, so I don’t get a 200 OK).

And the socks service? This is also a good reference for the syntax of the escape secuences in probes
Name: socks01080-ftp.drivehq.com
Type: TCP
Port: 1080
Connect only: Unchecked
First receive, then send:Unchecked
Send: \x05\x01\x02
Receive: \x05
Send: \x05\x01\0\x03\x0fftp.drivehq.com\0\x15
Receive: 220 Welcome to the

Be careful with this probe because it will fail in the following cases:

  1. You have an authenticated socks
  2. This is for a V5 socks.
  3. The \x0f before ftp.drivehq.com must have the length of the string ftp.drivehq.com . If you change the target server then the length of the dns name will change and you should change the length accordingly.

Thanks for the probes, and thanks for listing reasons why they might fail. That should keep some of us out of trouble. :laughing:

Shameless bump of topic.

Hi, two more. They need snmp.

The TCP retransmissions measures the number of TCP segments that the queried computer has needed to retransmit due to lost frames. This may be due to line congestion or LAN congestion, or non-responding computers. A flat zero line says that no frame is lost. Note that some media like frame relay specifically allows the drop of some frames.
Usually if you do a measure of the retransmissions over a second the result will be zero. You should measure them in a minute basis.

function
tcp_retrans_segs
tcp retransmited segments
oid(“1.3.6.1.2.1.6.12.0”)
Probe
tcp_retrans
Function
AV: tcp_retrans_segs()
ER: if(tcp_retrans_segs(), “”, “down”)
VAL: rate( tcp_retrans_segs() *60 )
UN: Packets
Rate: Minute


TCP Connections gives the number of established or closewait connections of the queried device. The number depends on the usage of the device. A cache/proxy/load-balancing-device may have a really high number of tcp connections.

function
tcp_currestab
number of tcp established or closewait connections
oid(“1.3.6.1.2.1.6.9.0”)

Probe
tcp_estab
Function
AV: tcp_currestab()
ER: if(tcp_currestab(), “”, “down”)
VAL: tcp_currestab()
UN: connections

Regards
------ Post Edit ----
As mr. Winkelman posted before, the OID for the currently established or closewait tcp connections is 1.3.6.1.2.1.6.9.0 . THX for the correction. Sorry for the typo.

I’m trying to get a problem working that checks the SU RSSI level and then creates a graph off it. I guess I’ve gotten it working ok once. It graph’d correctly at least. The OID for signal strength seems to change from mikrotik to mikrotik, so I haven’t figured out to deal with that. Anyway. Anybody had any luck in this department that might show me an example?

is there any documentation for custom functions and such?

Dis is what I ended up with so far:

Available : rssi_avail() > 0

which is –

array_size(oid_column(“iso.3.6.1.4.1.14988.1.1.1.2.1.3”))


and then for value i have

array_element(oid_column(“iso.3.6.1.4.1.14988.1.1.1.2.1.3”), 0)


it seems to work ok.

Nice, but not entieryly correct (I suspect copy-paste error :slight_smile:): established TCP connections is on oid(“1.3.6.1.2.1.6.9.0”)

Hi,
I would love to have a probe for an AS400 system (CPU / Network / HD)

I don't understand why it works with MRTG and I cannot get it to work using The Dude.

How can I do to translate this from MRTG to a probe in TheDude and why can't TheDude see the network cards ?

Thanks for you help

MRTG File used to query the SNMP on the AS400:

Interface 2 >> Descr: 'ETHLINE' | Name: '' | Ip: 'xx.xx.xx.xx' | Eth: '00-09-6b-eb-d8-56'

Target[s44r1755_2]: 2:xxxxxxxx@s44r1755:
SetEnv[s44r1755_2]: MRTG_INT_IP="xx.xx.xx.xx" MRTG_INT_DESCR="ETHLINE"
MaxBytes[s44r1755_2]: 12500000
Title[s44r1755_2]: Traffic Analysis for 2 -- S44R1755.xxxxxxxxxxxx.xxxxxxxx
PageTop[s44r1755_2]:

Traffic Analysis for 2 -- S44R1755.xxxxxxxxxxxx.xxxxxxxxx

System: S44R1755.xxxxxxxxx.xxxxxxxx in
Maintainer:
Description: ETHLINE
ifType: ethernetCsmacd (6)
ifName:
Max Speed: 100.0 Mbits/s
Ip: xx.xx.xx.xx (s44r1755.xxxxxxx.xxxxxxxx)

Interface 3 >> Descr: 'ETHLINE2' | Name: '' | Ip: 'xx.xx.xx.xx' | Eth: '00-09-6b-eb-d8-57'

Target[s44r1755_3]: 3:xxxxxx@s44r1755:
SetEnv[s44r1755_3]: MRTG_INT_IP="xx.xx.xx.xx" MRTG_INT_DESCR="ETHLINE2"
MaxBytes[s44r1755_3]: 12500000
Title[s44r1755_3]: Traffic Analysis for 3 -- S44R1755.xxxxxx.xxxxxx
PageTop[s44r1755_3]:

Traffic Analysis for 3 -- S44R1755.xxxxx.xxxxx

System: S44R1755.xxxxxx.xxxxx in
Maintainer:
Description: ETHLINE2
ifType: ethernetCsmacd (6)
ifName:
Max Speed: 100.0 Mbits/s
Ip: xx.xx.xx.xx (vsiprd.xxxxxxx.xxxxxxx)
\ \ ### Interface 4 >> Descr: 'TRNLINE' | Name: '' | Ip: 'xxx.xxx.xxx.xxx' | Eth: '40-00-00-00-08-20' ###

Target[s44r1755_4]: 4:xxxxx@s44r1755:
SetEnv[s44r1755_4]: MRTG_INT_IP="xxx.xxx.xxx.xxx" MRTG_INT_DESCR="TRNLINE"
MaxBytes[s44r1755_4]: 2000000
Title[s44r1755_4]: Traffic Analysis for 4 -- S44R1755.xxxxxx.xxxxxx
PageTop[s44r1755_4]:

Traffic Analysis for 4 -- S44R1755.xxxxxx.xxxxxx

System: S44R1755.xxxxxxx.xxxxxx in
Maintainer:
Description: TRNLINE
ifType: iso88025TokenRing (9)
ifName:
Max Speed: 16.0 Mbits/s
Ip: xxx.xxx.xxx.xxx (ASGRASSE.xxxxxx.xxxxxx)

CPU

YLegend[s44r1755.processorLoad]: % Utilization
Options[s44r1755.processorLoad]: growright,gauge,nopercent,nobanner
Target[s44r1755.processorLoad]: .1.3.6.1.2.1.25.3.3.1.2.1&.1.3.6.1.2.1.25.3.3.1.2.2:xxxxxxx@s44r1755
MaxBytes[s44r1755.processorLoad]: 100
Title[s44r1755.processorLoad]: S44R1755 : Utilisation du Processeur
ShortLegend[s44r1755.processorLoad]: %
Legend1[s44r1755.processorLoad]: Utilisation Processeur #1
Legend2[s44r1755.processorLoad]: Utilisation Processeur #2
Legend3[s44r1755.processorLoad]: Utilisation Processeur #1 (Maximum)
Legend4[s44r1755.processorLoad]: Utilisation Processeur #2 (Maximum)
LegendI[s44r1755.processorLoad]:  Load:
LegendO[s44r1755.processorLoad]:  Load:
PageTop[s44r1755.processorLoad]:

S44R1755 : Utilisation du Processeur

System: S44R1755

HD

YLegend[s44r1755.Disk]: Occupation Disque
Options[s44r1755.Disk]: growright,gauge
Target[s44r1755.Disk]: .1.3.6.1.2.1.25.2.3.1.6.1&.1.3.6.1.2.1.25.2.3.1.5.1:xxxxxxxx@s44r1755 * 4096
MaxBytes[s44r1755.Disk]: 281555238912
Title[s44r1755.Disk]: S44R1755 : Occupation Disque
ShortLegend[s44r1755.Disk]: o
Legend1[s44r1755.Disk]: Occupation disque
Legend2[s44r1755.Disk]: Taille du disque
Legend3[s44r1755.Disk]: Occupation disque Maximum
Legend4[s44r1755.Disk]: Taille disque Maximum
LegendI[s44r1755.Disk]:  Occupé :
LegendO[s44r1755.Disk]:  Taille :
PageTop[s44r1755.Disk]:

S44R1755 : Occupation Disque

System: S44R1755

I believe this is a correction to the first post of the cisco cpu function… The 0 where the -1 was keeps this probe from being added to devices that do not have a value in the cisco cpu OID. More specifically I think “if(x>0,1,-1)” returns not false in and “if(x>0,1,0)” returns false. I noticed a lot of other functions in this thread have -1 in the return on false, those can be fixed also by following this example.

Test and correct me if I am wrong.

Cisco CPU
Type: Function
Available: if(oid(“1.3.6.1.4.1.9.2.1.58.0”)>0, 1, 0)
Error: “”
Value: oid(“1.3.6.1.4.1.9.2.1.58.0”)
Unit: % of cpu load

Thanks for the great thread! keep it up :slight_smile:
Sweet!!!

Some APC UPS probes I made based on the one from above… They all seem to work I just haven’t actually tested them.
Create a new probe with the type of function and paste the lines.
Name is line 1,
Available is line 2,
Error is line 3,
value is line 4,
Unit is line5, but if you want similar values to show up on the same graph give them the same Unit description.

Checks to see if there is voltage on the input.
APC_Vin
if(oid(“1.3.6.1.4.1.318.1.1.1.3.2.1.0”)>0, 1, 0)
if(oid(“1.3.6.1.4.1.318.1.1.1.3.2.1.0”)>0, “”, “No Power”)
oid(“1.3.6.1.4.1.318.1.1.1.3.2.1.0”)
total

Measure battery temperature , should fix it to complain if too hot…
APC Battery Temperature
if(oid(“1.3.6.1.4.1.318.1.1.1.2.2.2.0”)>0, 1, 0)
if(oid(“1.3.6.1.4.1.318.1.1.1.2.2.2.0”)>0, “”, “No Temp reading”)
oid(“1.3.6.1.4.1.318.1.1.1.2.2.2.0”)
total

Battery Capacity errors if battery less than half. needs testing.
APC Capacity
if(oid(“1.3.6.1.4.1.318.1.1.1.2.2.1.0”)>0, 1, 0)
if(oid(“1.3.6.1.4.1.318.1.1.1.2.2.1.0”)>50, “”, “Battery less than half”)
oid(“1.3.6.1.4.1.318.1.1.1.2.2.1.0”)
%

Total load on UPS, complains if load is over 80. Need to test.
APC_Load
if(oid(“1.3.6.1.4.1.318.1.1.1.4.2.3.0”)>0, 1, 0)
if(oid(“1.3.6.1.4.1.318.1.1.1.4.2.3.0”)<80, “”, “Over Load”)
oid(“1.3.6.1.4.1.318.1.1.1.4.2.3.0”)
%

An improved battery temperature… complains if it is out of range. Now if I could figure out how make it keep graphing when it is out of range. I am certain I could solve that with another probe but WHY :slight_smile:


APC Battery Temperature
if(oid(“1.3.6.1.4.1.318.1.1.1.2.2.2.0”)>0, 1, 0)
if(or(oid(“1.3.6.1.4.1.318.1.1.1.2.2.2.0”)<20,oid(“1.3.6.1.4.1.318.1.1.1.2.2.2.0”)>40),concatenate(“temperature out of range = “,oid(“1.3.6.1.4.1.318.1.1.1.2.2.2.0”)),””)
oid(“1.3.6.1.4.1.318.1.1.1.2.2.2.0”)
total

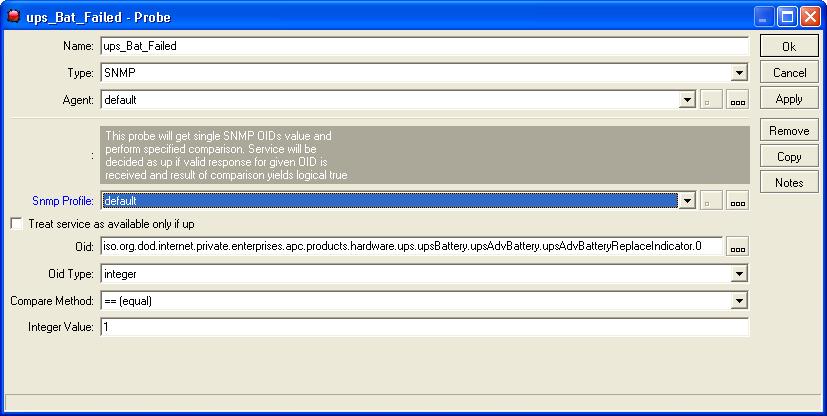
A quick way to make a probe… Causes your UPS to show when a battery is needing replaced.

Snmpwalk the device you are wanting to create a probe for, right click on the oid once you find it, select create probe.

You can modify the function but this one worked with no changes…


iso.org.dod.internet.private.enterprises.apc.products.hardware.ups.upsBattery.upsAdvBattery.upsAdvBatteryReplaceIndicator.0
probe.JPG
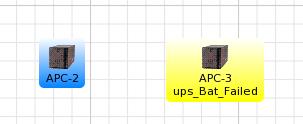
Lucky or not here they are :slight_smile:
failed.JPG

Are these SNMP oid’s via MT or straight to the APC ups?

For the APCs I read the device directly, reading the oid … You might need PowerNet-MIB.mib.

I have some VMWare ESX Servers and NetApp filers.
and wrote the following functions and probes to instrument CPU and Memory for them in The Dude:
(also there is a windows service probe)

FUNCTIONS

cpu_mem_disk_enhanced
Same as supllied cpu_mem_disk, but with added support for VMWare and NetApp CPU load
concatenate(
if(cpu_usage_available(), concatenate("cpu: ", round(cpu_usage()), "% "), “”),
if(vmcpu_usage_available(), concatenate("cpu: ", round(vmcpu_usage()), "% "), “”),
if(netappcpu_usage_available(), concatenate("cpu: ", round(netappcpu_usage()), "% "), “”),
if(mem_usage() > 0, concatenate("mem: ", round(mem_usage()), "% "), “”),
if(virtual_mem_usage() > 0, concatenate("virt: ", round(virtual_mem_usage()), "% "), “”),
if(hdd_usage() > 0, concatenate("disk: ", round(hdd_usage()), "% "), “”),
if(netapphdd_usage() > 0, concatenate("disk: ", round(netapphdd_usage()), "% "), “”)
)

device_performance_enh
Adjusted to call cpu_mem_disk_enhanced
if(
string_size(cpu_mem_disk_enhanced()) > 0,
concatenate(cpu_mem_disk_enhanced(), "
"),

“”
)

failed_service_summary
Shows failed services. Used to produce summary information on maps
if (device_property(“ServicesCount”)<>device_property(“ServicesUpCount”), concatenate(“Services (”, device_property(“ServicesUpCount”), “/”, device_property(“ServicesCount”), ")
", if (device_property(“ServicesUnstableCount”), concatenate("Unstable: ", device_property(“ServicesUnstableCount”), "
"), “”), if (device_property(“ServicesDownCount”), concatenate("Down: ", device_property(“ServicesDownCount”), "
"), “”), if (device_property(“ServicesAckedCount”), concatenate("Acked: ", device_property(“ServicesAckedCount”), "
"), “”), if (device_property(“ServicesUnknownCount”), concatenate("Unknown: ", device_property(“ServicesUnknownCount”), "
"), “”)), “”)

netappcpu_usage
Reports the CPU usage in percent of a NetApp
oid(“1.3.6.1.4.1.789.1.2.1.3.0”)

netappcpu_usage_available
Detects whether NetApp CPU usage is available
if(oid(“1.3.6.1.4.1.789.1.2.1.3.0”),1,0)

netapphdd_usage
Reports NetApp Total Storage usage as a percentage.
oid(“1.3.6.1.4.1.789.1.5.7.3.0”)

vmcpu_usage
Report the CPU usage in percent on a VMWare server
100-oid(“1.3.6.1.4.1.2021.11.11.0”)

vmcpu_usage_available
Detects whether VMWare CPU usage is available.
if (oid(“1.3.6.1.4.1.2021.11.11.0”),1,0)

FUNCTION PROBES

VMWare – cpu
Monitor the host CPU on a VMWare server
Available: vmcpu_usage_available()
Error: if(vmcpu_usage_available(), “”, “down”)
Value: vmcpu_usage()
Unit: %
Rate: none

NetApp - active disks
Number of active RAID disks
Available: if(oid(“1.3.6.1.4.1.789.1.6.4.2.0”)>0,1,0)
Error: if(oid(“1.3.6.1.4.1.789.1.6.4.2.0”)>0,“”,“none”)
Value: oid(“1.3.6.1.4.1.789.1.6.4.2.0”)
Unit:
Rate: none

NetApp - bad disks
Number of failed RAID disks
Available: if(oid(“1.3.6.1.4.1.789.1.6.4.7.0”)=0,1,0)
Error: if(oid(“1.3.6.1.4.1.789.1.6.4.7.0”)=0,“”,“bad disks”)
Value: oid(“1.3.6.1.4.1.789.1.6.4.7.0”)
Unit:
Rate: none

NetApp - bad fans
Number of failed cooling fans.
Available: if(oid(“1.3.6.1.4.1.789.1.2.4.2.0”)=0,1,0)
Error: if(oid(“1.3.6.1.4.1.789.1.2.4.2.0”)=0,“”,“bad fans”)
Value: oid(“1.3.6.1.4.1.789.1.2.4.2.0”)
Unit:
Rate: none

NetApp - bad power
Number of failed power supply units.
Available: if(oid(“1.3.6.1.4.1.789.1.2.4.4.0”)=0,1,0)
Error: if(oid(“1.3.6.1.4.1.789.1.2.4.4.0”)=0,“”,“bad psu”)
Value: oid(“1.3.6.1.4.1.789.1.2.4.4.0”)
Unit:
Rate: none

NetApp – cpu
CPU Busy % time
Available: netappcpu_usage_available()
Error: if(netappcpu_usage_available(), “”, “down”)
Value: netappcpu_usage()
Unit: %
Rate: none

NetApp - space used
Percentage of disk space used
Available: if(oid(“1.3.6.1.4.1.789.1.5.7.1.0”)>0,1,0)
Error: if(oid(“1.3.6.1.4.1.789.1.5.7.1.0”)>1,“disk space low”,“”)
Value: oid(“1.3.6.1.4.1.789.1.5.7.3.0”)
Unit: %
Rate: none

NetApp – spare disks
Number of spare disks in NetApp array
Available: if(oid(“1.3.6.1.4.1.789.1.6.4.8.0”)>0,1,0)
Error: if(oid(“1.3.6.1.4.1.789.1.6.4.8.0”)>0,“”,“no spares”)
Value: oid(“1.3.6.1.4.1.789.1.6.4.8.0”)
Unit:
Rate: none

NetApp – total disks
Total number of disks in NetApp array
Available: if(oid(“1.3.6.1.4.1.789.1.6.4.1.0”)>0,1,0)
Error: if(oid(“1.3.6.1.4.1.789.1.6.4.1.0”)>0,“”,“no disks”)
Value: oid(“1.3.6.1.4.1.789.1.6.4.1.0”)
Unit:
Rate: none

Windows Service MyService
Is the Windows Service MyService up
Available: if(array_find(oid_column(“1.3.6.1.4.1.77.1.2.3.1.1”),“MyService”)>0, 1, 0)
Error: if(array_find(oid_column(“1.3.6.1.4.1.77.1.2.3.1.1”),“MyService”)>0, “”, “MyService not detected by SNMP probe”)
Value: 1
Unit:
Rate: none

*Need to replace MyService with the name of the service that you actually want to monitor

SNMP PROBES

NetApp - over temp
Probe to detect NetApp temperature limit
Oid: iso.org.dod.internet.private.enterprises.netapp.netapp1.sysStat.environment.envOverTemperature.0
Type: integer
Compare: ==
String Value: 1

NetApp - status
Probe to detect when the NetApp is not ok
Oid: iso.org.dod.internet.private.enterprises.netapp.netapp1.sysStat.misc.
miscGlobalStatus.0
Type: integer
Compare: ==
String Value: 3


Also in “Server Configuration” → “Map” → “Device Appearance”
I modified the global default for device label to use the enhanced device performance function from the list above

Change Device Appearance Label to:
[Device.CustomField1]
[Device.Name]
[Device.FirstAddress]
[device_performance_enh()][failed_service_summary()]

Hi All,
Do any of you know of a probe that will moniter a port

Regards
Breazer