
Hi all,
This is a somewhat philosophical post - it's not about the actual technical details, which I will use as an example, but about the underlying issues that we are faced with when gauging the capability of Mikrotik devices to perform certain functionality.
The issue at hand is that there are instances when Mikrotik devices stop functioning or experience degraded performance, which manifests itself elsewhere (customer complaints, to start with), and are not easily caught via monitoring of the devices in question. There is a lack of in-depth monitoring and/or logging that makes it extremely hard to debug these issues, and one ends up going around in circles with ever-increasing amounts of gray hair.
First example is the recent problems we've been having with PPPoE sessions getting dropped - I won't reproduce here, but two threads can serve as reference:
viewtopic.php?p=811016
viewtopic.php?p=811132
And one blog post that references the issue head-on, and provides an architectural solution:
https://aacable.wordpress.com/2018/03/2 ... -mikrotik/
All references to PPPoE capabilities I can find are vague, going from "we are doing 200 sessions on box A" to "we are doing 5000 sessions on box B", with no clear indication of configuration, topology, or supporting infrastructure.
The second example is DNS. Our architecture in terms of DNS is "waterfall-like", where downstream devices use upstream devices as their respective resolvers:
We recently started experiencing increased volumes of customer complaints, pointing to DNS issues. Tests across the network, including packet traces on all devices in the chain, showed some requests would not get answered or timed out, others would get SERVFAIL. However, all CPU statistics on the CCRs showed sub-1% CPU utilization (using Profile). We tried all kinds of settings, from increasing timeouts all the way to stupid values like 15 seconds, to increasing number of concurrent requests to 30.000, etc. Nothing worked.
Eventually, we moved the network-level CCRs (the colored ones in my drawing) to use a bind9 server we setup at the DC, and removed DNS duties from the main CCR1072. Here is the CPU graph of the main CCR1072 last week, when the change was implemented. Can anyone guess what day it was done?
It was mid-day on the Friday. There was NO impact on CPU usage in graphing, and no impact on Profile tool either. It's as if DNS duties are not captured by Profile. We simply had no way to see the 1072 was choking. The impact for customers was noticeable, we jumped from daily traffic peaks of 8.3Gbps to over 9.5Gbps.
I have just implemented a chart to show the DNS statistics on the bind9 server, and it's showing some 300 queries per second at peak times. Quite how the 1072 was not able to handle this, or where the failure point was, is a mistery:
I would plead to Mikrotik for implementation of low-level debugging tools that allowed us to spot these kinds of trends and patterns, I'm sure there is a place in RouterOS that measures DNS queries, failures, etc. - just like we have a way to see RADIUS statistics (even though the WebFig UI has been broken for months...).
If there are hardware resource issues that affect critical functionality, there should be a way to trace them without the slowness of Profile (which doesn't allow you to see time-series changes with fine resolution, for example...). We just have no way to know when the next architectural or configuration problem will be spotted by our customers first, for the only reason of not having the tools to be pre-emptive.
Here is a post from 2014, asking specifically for more details on Profile tool:
viewtopic.php?t=90315
and the reply was "sorry, you need to watch really close and see if you can spot something". To me, this is the analogy - make sure you try and spot "disturbances in the Matrix":
(That one said with a dose of humor, I'm a big Mikrotik fan, but get frustrated by some of their responses to customer problems and requests...)
-

-
flameproof
Member Candidate

- Posts: 128
- Joined:
Architecture and growth - how to know when to change
You do not have the required permissions to view the files attached to this post.

Re: Architecture and growth - how to know when to change
Absolutely. But note that forum is not a way how to get support from mikrotik. If you open a ticket directly at them with such description, they will ask you for access, maybe install the debugging package and try to find and correct the problem. At least this is my repeated experience with mikrotik support. Writing such thing on the forum is good to inform others about your difficulties but will not help to solve such situation. How the support worked in thus case? If you asked them...
-
-
flameproof
Member Candidate
- Posts: 128
- Joined:
Re: Architecture and growth - how to know when to change
Hi jarda, thanks for your input - we spent weeks trying to get support to react, and when things stalled, I emailed the CEO with copy to the CTO, who replied and said he'd put someone on the case. We were never offered the option to give them remote access, install extra software or tools to debug, nothing - the final statement literally was:
"Unfortunately, we have to conclude that all your observations indicate to insufficient resources of Cloud Core Router devices in the particular setup and it cannot be fixed."
I assume from their explanation that certain tasks can only be handled by a set number of cores (possibly just one?) and thus no matter how many cores you throw at an issue, things won't improve.
I have since seen suggestions and blog posts that effectively split duties across two or more CCRs, so one does PPPoE, the other NAT, etc. - which is something that was not suggested by Mikrotik either.
What I'm missing is a clear statement on performance that includes what tasks are spread across multiple cores and which are not, with individual per-functionality performance data. That would allow us to make a calculated decision. Other vendors are much more transparent on this, granted that at a considerable markup, but we end up losing brand reputation, sales, and increase churn, as a result, so the old saying of "the cheap comes out expensive" applies.
Re: Architecture and growth - how to know when to change
In this case you had not any other option. I was always suspicious to many core cpu as routeros is not able to use them well. Single core performance is essential for it. But you were not able exhaust even one core by dns service and it was not able to work reliably even at that situation. The answer what you get from mikrotik is really shame. Bad to get such result after you have invested... Hope future will be better for everyone.
-

-
StubArea51
Trainer

- Posts: 1739
- Joined:
- Location: stubarea51.net
- Contact:
Re: Architecture and growth - how to know when to change
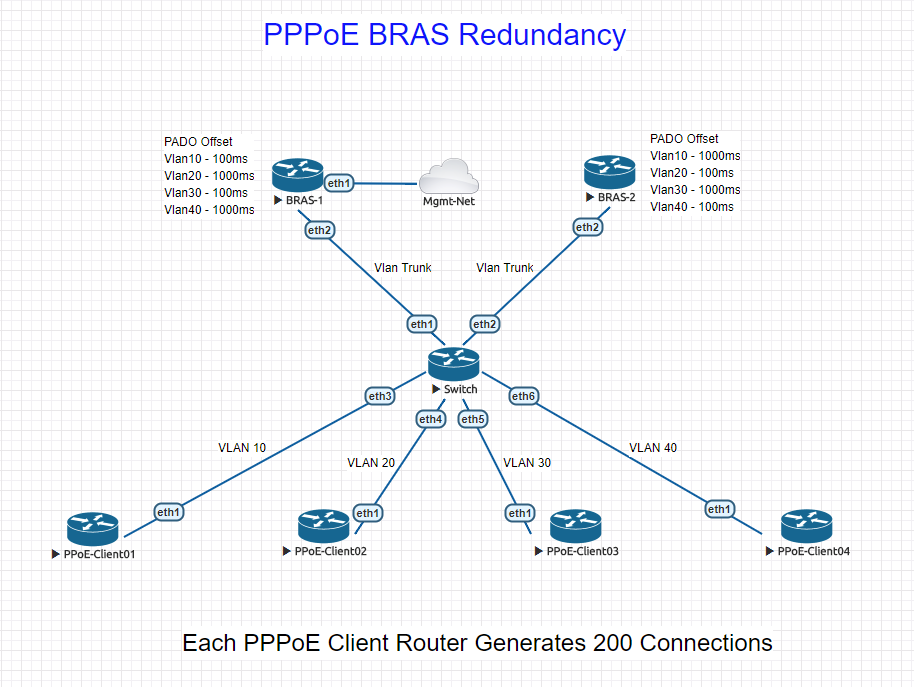
From an architecture perspective as it relates to PPPoE you need something that can load balance and scale laterally. This is true whether it's MikroTik or Cisco/Juniper.
This will allow you to add resources as needed based on load and performance observations. Most of the time we use CHR to terminate PPPoE.
The article below details an architecture we came up with and use successfully to scale connections
https://stubarea51.net/2018/04/23/pppoe ... atorsbras/
This will allow you to add resources as needed based on load and performance observations. Most of the time we use CHR to terminate PPPoE.
The article below details an architecture we came up with and use successfully to scale connections
https://stubarea51.net/2018/04/23/pppoe ... atorsbras/
-
-
joegoldman
Forum Veteran

- Posts: 767
- Joined:
Re: Architecture and growth - how to know when to change
I think you are also expecting too much of sub-set services. The CCR's are not made to be an ISP grade DNS resolver. DNS server is mostly built in to do its own lookups - and recursive for local cache in the stance of home/smb/corporate. When you are talking 100's or 1000's of clients, and waterfalling recursive up to a single machine, is not a good design or solution at all - and I think Mikrotik's response is appropriate, that the CCR is not made to run that much DNS.
I wouldn't even be handing out recursive to your local BRAS - instead on the DHCP/PPPoE I would be handing out direct to a dedicated DNS server - get that function away from your routers, as they are routers. I see you have already installed a dedicated DNS server, and that is 100% the best way to do it.
Sure we could ask for more debugging etc from Mikrotik, but I dont think this case warranted it.
-

-
Maggiore81
Trainer
- Posts: 564
- Joined:
- Location: Italy
- Contact:
Re: Architecture and growth - how to know when to change
I would keep an eye on "cuncurrent connection on DNS", the default is 100 :)
-
-
flameproof
Member Candidate
- Posts: 128
- Joined:
Re: Architecture and growth - how to know when to change
Thanks for that - we actually increased those limits ages ago, and fine-tuned the timeouts, to no avail. These are the stats from the Bind9 server we put into operation to fix the issue:
You can see that peak rate from the entire network (~14.000 CPEs) is some 300 queries per second, of which about 115 are recursive to our upstream provider. I fail to see how a CCR cannot show somewhere that it's choking under load (remember my previous posts where CPUs are almost idle on DNS, and memory use very low).
The bottom line is that a $3000+ device needs to have decent debugging tools that allow you to fully realize its capabilities, or at least, signal when they are running out. If we don't have such tools, and the software stack on a $20 box is essentially the same, it's even suspicious - maybe the vendor doesn't want you to know that the $3000 box cannot really handle much more than the $1000 box, or the $300 box... Maybe 5x $300 boxes will do the same the $3000 box can.
It's all downhill from here, without some clear answers from Mikrotik.
You do not have the required permissions to view the files attached to this post.
Who is online
Users browsing this forum: No registered users and 186 guests