Page 1 of 2
Re: Using Splunk to analyse MikroTik logs 2.6 (Graphing everything)
Posted: Mon Jun 10, 2019 5:49 pm
by Jotne
Updated section 2c regarding
Log prefix.
NB Do not use more than 20 charters, or else it start to clip other part of the log
firewall,info MikroTik: 123456789012345678901234567890 : in:ether1-Wan ...
firewall,info MikroTik: 1234567890123456789012345 forwa: in:ether1-Wan ...
firewall,info MikroTik: 12345678901234567890123 forward: in:ether1-Wan...
firewall,info MikroTik: 12345678901234567890 forward: in:ether1-Wan ...
As you see here the chain word
forward is eat'n up by the prefix.
MT is this a bug???
If not, set a warning in the gui

Re: Using Splunk to analyse MikroTik logs 2.6 (Graphing everything)
Posted: Thu Jun 13, 2019 1:54 pm
by Jotne
Updated section 2f)
Script updated to collect and show how many dynamic/static address lists entry there are.
Eks output
script,info MikroTik: script=address_lists list=rdp_stage2 dynamic=24 static=0
script,info MikroTik: script=address_lists list=rdp_stage1 dynamic=28 static=0
script,info MikroTik: script=address_lists list=ftp_stage2 dynamic=1 static=0
script,info MikroTik: script=address_lists list=ftp_stage1 dynamic=1 static=0
script,info MikroTik: script=address_lists list=black_list_rdp dynamic=42 static=0
script,info MikroTik: script=address_lists list=black_list_ftp dynamic=1 static=0
script,info MikroTik: script=address_lists list=Whitelist_IP dynamic=3 static=2
script,info MikroTik: script=address_lists list=Router dynamic=0 static=1
script,info MikroTik: script=address_lists list=IPSEC dynamic=1 static=0
script,info MikroTik: script=address_lists list=FW_Block_user_try_unkown_port dynamic=1089 static=0
script,info MikroTik: script=address_lists list=Clients dynamic=0 static=2
script,info MikroTik: script=address_lists list=Blocked dynamic=1 static=7
This will later be used in its own graph to see variation in the lists.
PS only one IP en the ssh black list
black_list_ssh is due to that I do not use default port.
You can update script only and wait for new Mikrotik Splunk app to be updated later.
Re: Using Splunk to analyse MikroTik logs 2.6 (Graphing everything)
Posted: Thu Jun 20, 2019 9:59 am
by zandhaas
Hello Jotne,
I want to upgrade my Splunk version 7.2 environment tot Splunk 7.3
Is the mikrotik app compatible with Splunk 7.3?
Re: Using Splunk to analyse MikroTik logs 2.6 (Graphing everything)
Posted: Thu Jun 20, 2019 1:43 pm
by Jotne
Yes, I do try to not use anything special in the APP so it should be compatible with all new version.
Re: Using Splunk to analyse MikroTik logs 2.6 (Graphing everything)
Posted: Fri Jun 21, 2019 9:29 pm
by Jotne
Updated section 2f)
Updated script to v2.4 and fixed reserved DHCP leases to be taken inn to account.
Re: Using Splunk to analyse MikroTik logs 2.6 (Graphing everything)
Posted: Sun Jun 23, 2019 2:59 am
by pidde
Hi!
Must say you did a great work with this app!
Is it possible to add option82 to dhcpserver part?
And is it also possible decode the option82 from hex?
Re: Using Splunk to analyse MikroTik logs 2.6 (Graphing everything)
Posted: Tue Jun 25, 2019 10:34 am
by zandhaas
Updated section 2f)
Updated script to v2.4 and fixed reserved DHCP leases to be taken inn to account.
When I look at the current script under 2f I only see the "# Collect DHCP Pool information" part.
It seems the rest of the script is missing.
Re: Using Splunk to analyse MikroTik logs 2.6 (Graphing everything)
Posted: Tue Jun 25, 2019 1:09 pm
by Jotne
You are 100% correct. Copy past error.
Fixed.
PS It's getting closer to the release of v 2.7 of Splunk for MikroTik
Re: Using Splunk to analyse MikroTik logs 2.6 (Graphing everything)
Posted: Fri Jun 28, 2019 2:10 pm
by Jotne
Script to get information on the router is upgraded to 2.6 section 2f
Simpler DHCP calculation.
Fixed comment so it start on the beginning of the line.
Fixed Script names
Re: Using Splunk to analyse MikroTik logs 2.7 (Graphing everything)
Posted: Mon Jul 01, 2019 1:15 pm
by Jotne
Upgraded to
2.7
There are a lot of new changes to the app as listed below, so its a larger upgrade.
Simplest way to upgrade, if you have not made changes your self, remove (uninstall) previous version, install new version.
Please report any problems back to this thread, and I will try to fixed.
PS If you do upgrade, you also need to upgrade script in section
2f (fist post) on all router you like to get data from.
Just cut/past the script over the old one.
PS2 File is found under section
1g first post
Request to changes are also welcome
What new:
# 2.7 (01.07.2019)
# New view added "Address Lists Counters"
# Changes most view to use "Base Search"
# Changed "MikroTik DHCP request" to use stats and fixed host flaw
# Changed "MikroTik System Changes" to use 30 day and 4 hour span and maxspan in transaction
# Removed changes to "DHCP leases" in "MikroTik System Changes"
# Added search in dropdown for "MikroTik DNS Live usage"
# Added Time picker for "MikroTik Device List"
# Speeded up "MikroTik Remote Connection"
# Fixed wrong timestamp of packets logged
# Changed "MikroTik DHCP request" to use stats and fixed host flaw and maxspan in trnsaction
# Added search in dropdown for "MikroTik DNS Live usage" and added IP to client and change sorting
# Fixed "MikroTik DNS request" to use correct dropdown lists
# Fixed "MikroTik Firewall Rules" to use better searh, removed base level, added counters, long prefix
# Rewritten "MikroTik Live attack" to speed up and added more dropdown
# Fixed "MikroTik Resources" to give correct host number
# Changed "MikroTik System Changes" to use 30 day and 4 hour span, removed DHCP info
# Fixed "MikroTik Traffic" to use script= and some clean up
# Fixed "MikroTik uPnP" script name, added ip to dropdown
# Added to ">MikroTik Uptime" dropdown menu
# Fixed "MikroTik Volt/Temperature" sorting
# Fixed "MikroTik VPN Connection" faster search
# Fixed "MikroTik Web Proxy" sorting and some code clean up
# Changed "MikroTik Wifi strength" to use script tag and some clean up
# Added "dashboard.css" to set menu color global
# Fixed "props.conf" to better handel wrong prefixed and some other changes
Re: Using Splunk to analyse MikroTik logs 2.7 (Graphing everything)
Posted: Wed Jul 03, 2019 5:36 am
by fengyuclub
I have been paying attention to this post, very powerful chart, but the cumbersome construction and the lack of relevant knowledge have been unsuccessful. I can only temporarily use the mrtg icon inside routeros to temporarily cope with it. I hope the poster can write the deployment manual from the perspective of the technology-poor. .
Re: Using Splunk to analyse MikroTik logs 2.7 (Graphing everything)
Posted: Wed Jul 03, 2019 3:17 pm
by Jotne
Its written so that a user with some knowlege should be able to set it up.
You can start by telling me what your problem is, and we may be able to help you out.
Re: Using Splunk to analyse MikroTik logs 2.7 (Graphing everything)
Posted: Sat Jul 06, 2019 6:50 am
by fengyuclub
Reinstalled splunk on ubuntu18.04, is a virtual machine under esxi, the deployment is very simple and normal, according to the steps of the top post, but the splunk dashboard can not see the task data incoming. Very strange, what else do I need to pay attention to? Please forgive my English using Google Translate, I am from China
1.png
Re: Using Splunk to analyse MikroTik logs 2.7 (Graphing everything)
Posted: Sat Jul 06, 2019 10:43 am
by Jotne
After starting Splunk, go to Search & Reporting menu. Add following search:
and set last 24 hour.
Do you then see any data?
If not try to just use a
* (star) and last 24 hour.
If you do not see any data, make sure
Router is sending data to correct IP/Port.
Splunk is listening on correct IP/port
No local firewall (Windows/Linux) are blocking incoming data.
Re: Using Splunk to analyse MikroTik logs 2.7 (Graphing everything)
Posted: Mon Jul 08, 2019 12:57 pm
by fengyuclub
After starting Splunk, go to Search & Reporting menu. Add following search:
and set last 24 hour.
Do you then see any data?
If not try to just use a
* (star) and last 24 hour.
If you do not see any data, make sure
Router is sending data to correct IP/Port.
Splunk is listening on correct IP/port
No local firewall (Windows/Linux) are blocking incoming data.
According to what you said carefully, but still can not receive the data, I introduced the cdb1016 log file db format, can be displayed to splunk, indicating that splunk no problem, is the data input problem, I see ros is the log The output is udp514 port, but I only see tcp listening port settings in splunk's receiving settings. Is this the reason?
1.png
2.png
3.jpg
Re: Using Splunk to analyse MikroTik logs 2.7 (Graphing everything)
Posted: Mon Jul 08, 2019 1:36 pm
by Jotne
It need to be UDP/514. Its there Router OS sends its syslog.
But:
If you use UDP/514, you need to run Splunk as root user. (allow ports below 1024 need root permission)
If you can not do that, there are two workaround.
1. Send syslog to other port above 1023, like 1514 for UDP syslog.
2. Set up a local syslog server like r-syslog and let Splunk read the lr-syslog log files.
PS updated original post with this information.
Re: Using Splunk to analyse MikroTik logs 2.7 (Graphing everything)
Posted: Tue Jul 09, 2019 5:51 am
by fengyuclub
There is no local listening udp514, now there is data in, but click on the meter in the Mikrotik2.7 dashboard, most of them do not have any charts, how to add or customize the dashboard you need here, for example, I want The wan's real-time or past and downstream traffic in a certain period of time, as well as the system temperature, the number of online hosts, and so on. How to do it?
Re: Using Splunk to analyse MikroTik logs 2.7 (Graphing everything)
Posted: Tue Jul 09, 2019 8:29 am
by Jotne
514 UDP do need to be active
Do you run it on Linux?
If so, as Root, type:
You should see one line like this:
udp 0 0 0.0.0.0:514 0.0.0.0:* 23557/splunkd off (0.00/0/0)
if not UDP/514 is not running.
One the mikrotik, post the output of:
You should see some like:
# jul/09/2019 07:26:37 by RouterOS 6.43.16
# software id = E4B6-94N8
#
# model = RouterBOARD 750G r3
# serial number = xyz
/system logging action
set 3 remote=ip_your_syslog_server
/system logging
set 0 disabled=yes
add action=remote prefix=MikroTik topics=dhcp
add action=remote prefix=MikroTik topics=hotspot
add action=remote prefix=MikroTik topics=!debug
There should be IP for your server, and prefix for all action with
MikroTik. If one letter is wrong in the prefix, it will fail. See capital
M and
T in the
MikroTik.
Re: Using Splunk to analyse MikroTik logs 2.7 (Graphing everything)
Posted: Thu Jul 11, 2019 1:03 pm
by fengyuclub
It’s true that I set it wrong, Mikrotik changed to MikroTik, and it should be fine, then I will report it.
Re: Using Splunk to analyse MikroTik logs 2.7 (Graphing everything)
Posted: Thu Jul 11, 2019 1:32 pm
by haaroons
Hello Jotne,
I am new to this forum.
I have install MikroTik logs 2.7.
MikroTik DNS Live usage and MikroTik DNS Live request is not working. if i do search eventtype=dns_query No item found
Do advice how to fix this.
Re: Using Splunk to analyse MikroTik logs 2.7 (Graphing everything)
Posted: Thu Jul 11, 2019 11:43 pm
by Jotne
DNS information are coming from standard logs on the router.
What do you get if you go to search window and search with the following line:
sourcetype=mikrotik earliest=-24h latest=now() | stats count by module
I do get some like this:
module		count
dhcp		12764
dns		324512
firewall	1349
ipsec		7
script		91182
upnp		308
Re: Using Splunk to analyse MikroTik logs 2.7 (Graphing everything)
Posted: Fri Jul 12, 2019 6:02 am
by fengyuclub
The data is coming, some of the tables are already filled, some still have no data, such as dns, it doesn't matter, I want to know how to monitor the flow table of an interface (wan), just like mirkrotik's built-in mrtg chart, every 5 minutes, 30 minutes and so on. . . As shown
1.png
Re: Using Splunk to analyse MikroTik logs 2.7 (Graphing everything)
Posted: Fri Jul 12, 2019 8:05 am
by Jotne
That is why I need the output of the above command.
Some data are coming from the logg.
Some are comming from scripting
Log:
-------
dhcp,dhcp_static,dns,firewall,ipsec,upnp
script:
-------
IPSEC_failed,address_list,healt,pool,resource,sysinfo,traffic,uncounted,upnp
So I guess you have some log problems. Read section 2b carefully.
Re: Using Splunk to analyse MikroTik logs 2.7 (Graphing everything)
Posted: Fri Jul 12, 2019 11:42 am
by fengyuclub
Splunk is too powerful. If I have multiple ccr1016, how can I transfer data to the splunk server, how do I distinguish syslogs from different mikrotik routers?
Re: Using Splunk to analyse MikroTik logs 2.7 (Graphing everything)
Posted: Fri Jul 12, 2019 1:29 pm
by Jotne
All the view for MikroTik in Splunk has a host drop down. So if you have more than one router, just select the host you like to monitor.
There is one possible problem, if you have many routers with same IP that sends log to same Splunk.
That could be solved using unique ID for each router and some small change to the code.
Re: Using Splunk to analyse MikroTik logs 2.7 (Graphing everything)
Posted: Mon Jul 15, 2019 6:24 am
by fengyuclub
How can I write the interface tx-bits-per-second parameter to the log and then plot it in splunk.
Re: Using Splunk to analyse MikroTik logs 2.7 (Graphing everything)
Posted: Mon Jul 15, 2019 8:06 am
by Jotne
What command do you use on the router to see this data?
Re: Using Splunk to analyse MikroTik logs 2.7 (Graphing everything)
Posted: Mon Jul 15, 2019 10:07 am
by fengyuclub
What command do you use on the router to see this data?
interface monitor-traffic ether1
Search forums see scripts with such calls
  "/interface monitor-traffic ether1 once do={
:put ($"tx-bits-per-second"/1000 /1000 )
}"
Re: Using Splunk to analyse MikroTik logs 2.7 (Graphing everything)
Posted: Tue Jul 16, 2019 8:12 pm
by Jotne
It can be done.
I do use IP accounting to see the traffic going trough the router.
This way are more generic and does work without any modification.
If you monitor one and one interface, this has to be adopted for each setup.
Re: Using Splunk to analyse MikroTik logs 2.7 (Graphing everything)
Posted: Fri Jul 19, 2019 5:03 am
by fengyuclub
{
:local iname;
:local monitor;
:local speedRX;
:local speedTX;
:local mbpsRX;
:local mbpsTX;
:foreach interface in=[/interface find] do={
:delay 100ms;
:set $iname [/interface get $interface name];
:set $monitor [/interface monitor-traffic $iname as-value once];
:set $speedRX ($monitor->"rx-bits-per-second");
:set $speedTX ($monitor->"tx-bits-per-second");
:set $mbpsRX (($speedRX/1000)/1000);
:set $mbpsTX (($speedTX/1000)/1000);
:put "$iname RX:$mbpsRX Mbps TX:$mbpsTX Mbps";
}
}
I found the script for
this post available, but after running it is all interfaces, I don't want all interfaces, only a few interfaces are needed, for example, I only need ether1, ether2, how to modify the script, and how can I get it? Let him display in the log, I use the splunk search call, and display it as 14.5Mbps instead of 14528. I hope to get everyone's help.
Re: Using Splunk to analyse MikroTik logs 2.7 (Graphing everything)
Posted: Fri Jul 19, 2019 9:29 am
by Jotne
Info
It seems that data you get from monitor are just moment blink of data going through the interface. So it will fly up and down for every time you run it. If it would be like cisco, average last 5 min, it would be perfect to rune every 5 min. Not sure if it are useful at as is.
If you have not renamed interface
:foreach interface in=[/interface find] do={
To
:foreach interface in=[/interface find where (name~"^ether1\$" || name~"^ether2\$") ] do={
or use regex
:foreach interface in=[/interface find where name~"^ether[12]\$" ] do={
Anchor
^ \$ are used to distinguish
ether1 from
ether11 etc.
Edit
You can use ID instead of name, so you can change from:
:set $iname [/interface get $interface name];
:set $monitor [/interface monitor-traffic $iname as-value once];
to
:set $monitor [/interface monitor-traffic $interface as-value once]
PS2, no need to declare variables, use them directly
do not divide data by 1000 two times, let splunk do that, so you do not loose any resolution
use equal sign for splunk to read data directly
you do not need semicolon behind each line
;
So final script could be some like this
:foreach interface in=[/interface find where name~"^ether[12]\$"] do={
	:delay 100ms
	:local iname [/interface get $interface name]
	:local monitor [/interface monitor-traffic $interface as-value once]
	:local speedRX ($monitor->"rx-bits-per-second")
	:local speedTX ($monitor->"tx-bits-per-second")
	:log info message="script=monitor interface=$iname RX=$speedRX bps TX=$speedTX bps"
	}
Re: Using Splunk to analyse MikroTik logs 2.7 (Graphing everything)
Posted: Fri Jul 19, 2019 11:47 am
by fengyuclub
Your script, the regular expression method, no success without any output, it doesn't matter, my code is as follows
I want to know how to search for rich charts, and there are 14.8Mbps and 14833 display problems. This is not important. The important thing is how splunk draws charts.
mycode
{
:local iname;
:local monitor;
:local speedRX;
:local speedTX;
:local mbpsRX;
:local mbpsTX;
:foreach interface in=[/interface find where (name~"WAN-ether2") ] do={
:delay 100ms;
:set $iname [/interface get $interface name];
:set $monitor [/interface monitor-traffic $iname as-value once];
:set $speedRX ($monitor->"rx-bits-per-second");
:set $speedTX ($monitor->"tx-bits-per-second");
:set $mbpsRX ($speedRX/1000);
:set $mbpsTX ($speedTX/1000);
:put "$iname RX=$mbpsRX Kbps TX=$mbpsTX Kbps";
:log info "WAN-ether2 down RX=$mbpsRX Kbps";
:log info "WAN-ether2 up   TX=$mbpsTX Kbps"
}
:foreach interface in=[/interface find where (name~"adsl-tx") ] do={
:delay 100ms;
:set $iname [/interface get $interface name];
:set $monitor [/interface monitor-traffic $iname as-value once];
:set $speedRX ($monitor->"rx-bits-per-second");
:set $speedTX ($monitor->"tx-bits-per-second");
:set $mbpsRX ($speedRX/1000);
:set $mbpsTX ($speedTX/1000);
:put "$iname RX=$mbpsRX Kbps TX=$mbpsTX Kbps";
:log info "adsl-tx down RX=$mbpsRX Kbps";
:log info "adsl-tx up   TX=$mbpsTX Kbps"
}
:foreach interface in=[/interface find where (name~"bonding1") ] do={
:delay 100ms;
:set $iname [/interface get $interface name];
:set $monitor [/interface monitor-traffic $iname as-value once];
:set $speedRX ($monitor->"rx-bits-per-second");
:set $speedTX ($monitor->"tx-bits-per-second");
:set $mbpsRX ($speedRX/1000);
:set $mbpsTX ($speedTX/1000);
:put "$iname RX=$mbpsRX Kbps TX=$mbpsTX Kbps";
:log info "bonding1 down RX=$mbpsRX Kbps";
:log info "bonding1 up   TX=$mbpsTX Kbps"
}
}
After the schedule is displayed as follows
1.png
Re: Using Splunk to analyse MikroTik logs 2.7 (Graphing everything)
Posted: Fri Jul 19, 2019 12:26 pm
by fengyuclub
Tested on other ccr1016 your script is successful, it should be the problem of the interface name, but it is important to draw the splunk graphics, I hope you can add to the new version.
3.png
Re: Using Splunk to analyse MikroTik logs 2.7 (Graphing everything)
Posted: Fri Jul 19, 2019 1:38 pm
by Jotne
When you have multiple interface, use only one section, no a section for every interface
change
:foreach interface in=[/interface find where (name~"WAN-ether2") ] do={
to
:foreach interface in=[/interface find where (name~"WAN-ether2" || name~"adsl-tx" || name~"bonding1") ] do={
Test code that should output data to screen:
{
:foreach interface in=[/interface find where (name~"WAN-ether2" || name~"adsl-tx" || name~"bonding1") ] do={
	:delay 100ms
	:local iname [/interface get $interface name]
	:local monitor [/interface monitor-traffic $interface as-value once]
	:local speedRX ($monitor->"rx-bits-per-second")
	:local speedTX ($monitor->"tx-bits-per-second")
	:put "script=monitor interface=$iname RX=$speedRX bps TX=$speedTX bps"
	}
}
, when testing cut and past on the cli, you need to wrape all script in brackets
{} !!!
PS how often would you like to run the script? every 5 min. Do you know if monitor could show average 5 min data?
Re: Using Splunk to analyse MikroTik logs 2.7 (Graphing everything)
Posted: Fri Jul 19, 2019 1:58 pm
by Jotne
Try this
Add this to the
Data_to_Splunk_using_Syslog script
# Get interface data (test)
# ----------------------------------
:foreach interface in=[/interface find where (name~"WAN-ether2" || name~"adsl-tx" || name~"bonding1")(name~"WAN-ether2" || name~"adsl-tx" || name~"bonding1") ] do={
	:delay 100ms
	:local iname [/interface get $interface name]
	:local monitor [/interface monitor-traffic $interface as-value once]
	:local speedRX ($monitor->"rx-bits-per-second")
	:local speedTX ($monitor->"tx-bits-per-second")
	:log info message="script=monitor interface=$iname RX=$speedRX bps TX=$speedTX bps"
	}
Then in Splunk do this search for the last 4 hour.
sourcetype=mikrotik script=monitor| timechart avg(RX) as RX avg(TX) as TX by interface limit=10
May take some time to nice graphs.
Re: Using Splunk to analyse MikroTik logs 2.7 (Graphing everything)
Posted: Fri Jul 19, 2019 7:06 pm
by zandhaas
Nice,
I have added the additional script entries and changed the inteface names to the names I use.
But............
The sourcetype entry in the search entry schould be "sourcetype=
Mikro
Tik"

Re: Using Splunk to analyse MikroTik logs 2.7 (Graphing everything)
Posted: Fri Jul 19, 2019 7:32 pm
by Jotne
In Splunk, search ignore case
Even if this works, I like better the view in Splunk
MikroTik Traffic, that uses accounting for creating the graphs.
There you can see who is generating the traffic, compare to only see what interface traffic goes in/out.
Re: Using Splunk to analyse MikroTik logs 2.7 (Graphing everything)
Posted: Fri Jul 19, 2019 9:06 pm
by zandhaas
Even if this works, I like better the view in Splunk MikroTik Traffic, that uses accounting for creating the graphs.
There you can see who is generating the traffic, compare to only see what interface traffic goes in/out.
The current "Mikrotik Traffic" overview is indeed a nice oveview.
But apart from knowing who is generating the traffic I am very interested in the amount of traffic that floats over each individual interface. And especially the WAN interface(s) and ISL interfaces. And when you see a bottleneck on one of your interfaces you can drill down to your traffic overview to identify the source of all that traffic.
Re: Using Splunk to analyse MikroTik logs 2.7 (Graphing everything)
Posted: Sat Jul 20, 2019 5:46 am
by fengyuclub
Jotne,Great, I did it according to your script, and the beautiful chart shows normal. I tried to add scripts to my multiple ccr and routerboards, so my interface has a lot of duplicate names, such as bonding1 and bridge1, how can I distinguish between them, or change the name for each interface.
4.png
Re: Using Splunk to analyse MikroTik logs 2.7 (Graphing everything)
Posted: Sat Jul 20, 2019 5:59 am
by fengyuclub
Understand, add host=x.x.x.x in front of the search statement you gave to open my ccr and rb.
Re: Using Splunk to analyse MikroTik logs 2.7 (Graphing everything)
Posted: Sat Jul 20, 2019 7:10 am
by fengyuclub
Host=x.x.x.x Although this option is available, some devices have an internet connection that is a dynamic ip obtained by adsl dialing. So before the log warning, add an identity=xxxxx to distinguish the mikrotik device. After testing, it is feasible and runs very well.
Re: Using Splunk to analyse MikroTik logs 2.7 (Graphing everything)
Posted: Mon Jul 22, 2019 10:24 am
by Jotne
@ fengyuclub
Nice to see you are getting it to work.
@ All
Section 2c) Logging prefix has been updated with sample on how to name to logs.
Re: Using Splunk to analyse MikroTik logs 2.7 (Graphing everything)
Posted: Mon Jul 22, 2019 3:44 pm
by Jotne
Script in section 2f) updated to 2.9
It now support to get interface counters and you can also set modules true/false if you do not like to monitor one section.
If you do not have wifi/dhcp, you can just set them to false.
Re: Using Splunk to analyse MikroTik logs 2.7 (Graphing everything)
Posted: Wed Jul 24, 2019 8:23 am
by Jotne
Script in section 2f) updated to 3.0
Do now get CDP neighbors
Re: Using Splunk to analyse MikroTik logs 2.7 (Graphing everything)
Posted: Thu Jul 25, 2019 12:46 pm
by fengyuclub
Splunk is really powerful, I see splunk have a lot of apps to install, in our China use wechat (similar to facebook, telegram) this social software, I saw this social software related app, WeChat Alert App for Splunk, I installed this App, sending test messages from wechat is successful, but I don't know much about splun's alert settings, set it many times, only a single success, can you help me?
5.png
Re: Using Splunk to analyse MikroTik logs 2.7 (Graphing everything)
Posted: Thu Jul 25, 2019 1:44 pm
by Jotne
No need for extra app to send message. Sending email using a gmail account is easy and works well.
But there is a big issue.
If you have a free Splunk license, you do loose a lot of thing.
* Monitor and Alerting (needed for sending alerts)
* 500MB pr day maximum
* Cluster
* Universal Forwarder
* HA
* Distributed Search
* Perfomance Acceleration
* Access controll (only on user)
* LDAP
+++
This is why I have not included any Alerting in the project.
There is a workaround. You can setup an batch job that runs search from command line and do stuff from it. (I have not tested it)
Re: Using Splunk to analyse MikroTik logs 2.7 (Graphing everything)
Posted: Sat Jul 27, 2019 4:56 am
by fengyuclub
I have Splunk Enterprise license, gmail alert can't be real-time, mobile mail client can't update mail in real time, there is a delay of about 10 minutes, so I choose wechat alert.I received some wechat alert, but some of them use the search to save as an alert, I can't receive a wechat alert, I don't know where the problem is.
6.jpg
7.jpg
Re: Using Splunk to analyse MikroTik logs 2.7 (Graphing everything)
Posted: Sat Jul 27, 2019 8:30 am
by Jotne
Splunk do handle real time alerts (or close to)
https://docs.splunk.com/Documentation/S ... TimeAlerts
It should not depend of type of action you are using, starting a program, sending sms, email, wechat etc. Alerts should go out.
But you should not use to many alerts, since it will use more CPU to handle them.
Not sure what your problem is.
Re: Using Splunk to analyse MikroTik logs 2.7 (Graphing everything)
Posted: Fri Aug 02, 2019 10:20 am
by Jotne
Updated script to 3.1
Fixed CDP, since some devices sends long version with new lines breaking up the log lines. (Cisco)
PS still have problem that line is cut in Splunk. Not sure if its MT not sending whole line, or Splunk that cuts the lines.
I do only get 278 characters.
Re: Using Splunk to analyse MikroTik logs 2.7 (Graphing everything)
Posted: Tue Aug 06, 2019 3:34 pm
by antispam
Using 2.7, it's mentioned that the "defconf: drop all not coming from LAN" rule should have the prefix 'FI_D_port-test'. When I set that, the Live Attack dashboard doesn't populate as it appears from the source in the dashboard it is searching for 'FW_Drop_all_from_WAN'. When changing this to 'FI_D_port-test' in the Live Attack dashboard source, it works. Is the FW_Drop_all_from_WAN still required?
Re: Using Splunk to analyse MikroTik logs 2.7 (Graphing everything)
Posted: Tue Aug 06, 2019 4:24 pm
by Jotne
The filter rule prefix was changed to be more uniform. So I may have mixed up some from script to Splunk code.
One the "Live Attack" dashboard, click Edit->Source.
There you will near the top find some like this:
<search id="base_search">
    <query>
      sourcetype=mikrotik
      module=firewall
      rule=FI_D_port-test
Make sure that you use the same name of the rule as in Splunk, or change Spluk to use same name of the rule as on the router.
Will be fixed in 2.8 of Splunk for MikroTik
Re: Using Splunk to analyse MikroTik logs 2.7 (Graphing everything)
Posted: Wed Aug 07, 2019 9:39 am
by fengyuclub
Recently, one of my ccr is a bit problematic. I can only recover from the time when the device is powered off and restarted. The top of the log in winbox can see red like "system, error System rebooted because of kernel failure" or "Out of memory condition was detected", but I can't see it in splunk search. These log messages, how can I output all the log information to splunk for easy query.
Re: Using Splunk to analyse MikroTik logs 2.7 (Graphing everything)
Posted: Wed Aug 07, 2019 1:12 pm
by Jotne
A search like this should give all message:
sourcetype=mikrotik module=system
IF not try this:
Or at last just this
Re: Using Splunk to analyse MikroTik logs 2.7 (Graphing everything)
Posted: Sat Aug 10, 2019 6:04 am
by antispam
The filter rule prefix was changed to be more uniform. So I may have mixed up some from script to Splunk code.
One the "Live Attack" dashboard, click Edit->Source.
There you will near the top find some like this:
<search id="base_search">
    <query>
      sourcetype=mikrotik
      module=firewall
      rule=FI_D_port-test
Make sure that you use the same name of the rule as in Splunk, or change Spluk to use same name of the rule as on the router.
Will be fixed in 2.8 of Splunk for MikroTik
Thanks for the prompt reply, that was exactly what I did to get it fixed - keep up the great work!
Re: Using Splunk to analyse MikroTik logs 2.7 (Graphing everything)
Posted: Sat Aug 10, 2019 2:28 pm
by stuartkoh
It need to be UDP/514. Its there Router OS sends its syslog.
But:
If you use UDP/514, you need to run Splunk as root user. (allow ports below 1024 need root permission)
If you can not do that, there are two workaround.
1. Send syslog to other port above 1023, like 1514 for UDP syslog.
2. Set up a local syslog server like r-syslog and let Splunk read the lr-syslog log files.
PS updated original post with this information.
One thing to be careful of if you're setting this up in an existing Splunk environment - unless you're really familiar with how things are setup, don't enable Splunk's UDP/514 input without first checking that syslog isn't already being received by something like syslog-ng or rsyslog. You could wind up with data loss or have events put into the wrong index or sourcetype.
It's also not best practices to run Splunk as root. For home use I guess you can get away with it, but for any production Splunk environment you will want to have Splunk running as a restricted user (user = splunk and group = splunk is commonly used).
When you install Splunk, you can set it to autostart on boot and also set the user if you want.
[sudo] $SPLUNK_HOME/bin/splunk enable boot-start -user splunk
For receiving syslog - I'm more familiar with syslog-ng, but I also see rsyslog being used successfully. Either one of these will work well for you.
Re: Using Splunk to analyse MikroTik logs 2.7 (Graphing everything)
Posted: Sat Aug 10, 2019 5:32 pm
by Jotne
This is already mention in section 1b)
If you install Ubuntu, (i think from 16.x), rsyslog is installed as default. But its not listening on port 514/UPD as default and you need to edit the config and restart syslog to get it running. So it should normally not be any conflict.
But in production environment I do also recommend running Splunk as a non root user, then use rsyslog to listen on 514/UDP. Then make Splunk index rsyslogs config.
If any is interested, I have a rather complex rsyslog to handle non standard syslog packed that also add time stamp if that is missing on incoming packets.
Re: Using Splunk to analyse MikroTik logs 2.7 (Graphing everything)
Posted: Sat Aug 10, 2019 8:31 pm
by stuartkoh
If any is interested, I have a rather complex rsyslog to handle non standard syslog packed that also add time stamp if that is missing on incoming packets.
I think that syslog-ng has an option that can be used to do this.
keep-timestamp()
Description: Specifies whether syslog-ng should accept the timestamp received from the sending application or client. If disabled, the time of reception will be used instead. This option can be specified globally, and per-source as well. The local setting of the source overrides the global option if available.
https://www.syslog-ng.com/technical-doc ... -timestamp
Re: Using Splunk to analyse MikroTik logs 2.7 (Graphing everything)
Posted: Sat Aug 10, 2019 8:50 pm
by stuartkoh
I also wanted to note that I'm not advocating that anyone switch from rsyslog or whatever they're currently using to syslog-ng unless they have good reason to do so.
I don't even really have an opinion on how they compare. I've been working with syslog-ng a bit so that's what I'm familiar with. I'm not trying to start a flame war over which to use.
Re: Using Splunk to analyse MikroTik logs 2.7 (Graphing everything)
Posted: Thu Aug 15, 2019 1:39 am
by Spotegg
Hello! I have installed Splunk with Mikrotik module. Thanks, it's great!
Is there a way to organize monitoring of Internet connection on the router. For example, there is an Internet channel on ether1, and you need to somehow download data to Splunk about when the Internet crashed on the router. Maybe there is already such a script?
Re: Using Splunk to analyse MikroTik logs 2.3 (Graphing everything)
Posted: Thu Aug 15, 2019 4:10 pm
by ferdytao
Only if your Mikrotik is used as DHCP server continue here, else ignore the following steps.
Check that each IP has a valid comment. I used the comment name as hostname.
Script: manuel_export_dhcp_splunk
:log info "export_dhcp_splunk";
:local hostname;
:local mac;

/file print file="export_dhcp_splunk.txt";

/file set "export_dhcp_splunk.txt" contents="";


:local newdata ("hostname,src_mac\r\n");
/file set "export_dhcp_splunk.txt" contents=([get export_dhcp_splunk.txt contents] . $newdata);

/ip dhcp-server lease;
:log info "Entering export_dhcp_splunk loop";
:foreach i in=[find] do={
  /ip dhcp-server lease;
  :if ([:len [get $i comment]] > 0) do={
    :set hostname [get $i comment];
    :set mac [get $i mac-address];
    :local newdata ($hostname.",".$mac. "\r\n");
    /file set "export_dhcp_splunk.txt" contents=([get export_dhcp_splunk.txt contents] . $newdata);
   } else={
    :set mac [get $i mac-address];
    :local newdata ("NONE,".$mac. "\r\n");
    /file set "export_dhcp_splunk.txt" contents=([get export_dhcp_splunk.txt contents] . $newdata);
  }
}
:log info "Ended export_dhcp_splunk";
This script is not working for me, what you mean with comments? I have no comments on dhcp leases, did you comments each ip manually before?
Re: Using Splunk to analyse MikroTik logs 2.3 (Graphing everything)
Posted: Fri Aug 16, 2019 12:21 pm
by ferdytao
Only if your Mikrotik is used as DHCP server continue here, else ignore the following steps.
Check that each IP has a valid comment. I used the comment name as hostname.
Script: manuel_export_dhcp_splunk
:log info "export_dhcp_splunk";
:local hostname;
:local mac;

/file print file="export_dhcp_splunk.txt";

/file set "export_dhcp_splunk.txt" contents="";


:local newdata ("hostname,src_mac\r\n");
/file set "export_dhcp_splunk.txt" contents=([get export_dhcp_splunk.txt contents] . $newdata);

/ip dhcp-server lease;
:log info "Entering export_dhcp_splunk loop";
:foreach i in=[find] do={
  /ip dhcp-server lease;
  :if ([:len [get $i comment]] > 0) do={
    :set hostname [get $i comment];
    :set mac [get $i mac-address];
    :local newdata ($hostname.",".$mac. "\r\n");
    /file set "export_dhcp_splunk.txt" contents=([get export_dhcp_splunk.txt contents] . $newdata);
   } else={
    :set mac [get $i mac-address];
    :local newdata ("NONE,".$mac. "\r\n");
    /file set "export_dhcp_splunk.txt" contents=([get export_dhcp_splunk.txt contents] . $newdata);
  }
}
:log info "Ended export_dhcp_splunk";
This script is not working for me, what you mean with comments? I have no comments on dhcp leases, did you comments each ip manually before?
Resolved!

Re: Using Splunk to analyse MikroTik logs 2.7 (Graphing everything)
Posted: Sat Aug 17, 2019 5:35 pm
by ferdytao
I'm having a strange problem both on my synology with docker and my windows pc also, I configured everything as described, I got many logs from my router but after a while it stops reading while counters are still increasing.
Checking via tcpdump, logs are arriving to the server but is like they are not processed.
Immagine.jpg
Someone could help me? Maybe I got something wrong, I cannot image the server is flooded by a single router.
Re: Using Splunk to analyse MikroTik logs 2.7 (Graphing everything)
Posted: Sat Aug 17, 2019 5:53 pm
by Jotne
See if your prefix is correct at section 2b. On wrong characters and it break all.
You can also do a search with only a start * and set it to last 24 hour and see what data you get.
Re: Using Splunk to analyse MikroTik logs 2.7 (Graphing everything)
Posted: Sat Aug 17, 2019 7:19 pm
by ferdytao
See if your prefix is correct at section 2b. On wrong characters and it break all.
You can also do a search with only a start * and set it to last 24 hour and see what data you get.
Yes it's correct, if I do that search last packet is 2 ours ago now while the counter is increasing
Immagine.jpg
Re: Using Splunk to analyse MikroTik logs 2.7 (Graphing everything)
Posted: Sat Aug 17, 2019 10:03 pm
by Jotne
What does then stop? (looks correct)
You should from the scrip (if you have installed it) get data every 5 minutes.
So search for star and search for 30 min window, you should see data coming in all the time.
Re: Using Splunk to analyse MikroTik logs 2.7 (Graphing everything)
Posted: Sat Aug 17, 2019 10:34 pm
by ferdytao
What does then stop? (looks correct)
You should from the scrip (if you have installed it) get data every 5 minutes.
So search for star and search for 30 min window, you should see data coming in all the time.
Yes the script is installed, I had the 30 min windows search and no data are showed even when the script starts. The stranger thing is that I have the same problem running Splunk on two different system
Immagine.jpg
Re: Using Splunk to analyse MikroTik logs 2.7 (Graphing everything)
Posted: Sun Aug 18, 2019 8:39 pm
by Jotne
Strange.
Are you 100% your server is listening on Syslog UDP/514?
Here is how to test.
Search for this with REAL-TIME - 1 minute window
Then on a linux server run this command. (Change IP (local host 127.0.0.1) to your server if you do test this on an other server :
echo "<14> test hello" | nc -v -u -w 0 127.0.0.1 514
Linux should respond some like this:
Connection to 127.0.0.1 514 port [udp/syslog] succeeded!
On Splunk, you should get a message like this:
Aug 18 19:32:53 127.0.0.1 test hello
If you do not get this message, you need to examine your UDP/514.
Do you run Syslog as root user?
Does Syslog setup to listen on 514?
If Splunk does not run as root, how has you setup UDP/514? Rsyslog where Splunk reads log files?
Re: Using Splunk to analyse MikroTik logs 2.7 (Graphing everything)
Posted: Sun Aug 18, 2019 11:12 pm
by ferdytao
Strange.
Are you 100% your server is listening on Syslog UDP/514?
Here is how to test.
Search for this with REAL-TIME - 1 minute window
Then on a linux server run this command. (Change IP (local host 127.0.0.1) to your server if you do test this on an other server :
echo "<14> test hello" | nc -v -u -w 0 127.0.0.1 514
Linux should respond some like this:
Connection to 127.0.0.1 514 port [udp/syslog] succeeded!
On Splunk, you should get a message like this:
Aug 18 19:32:53 127.0.0.1 test hello
If you do not get this message, you need to examine your UDP/514.
Do you run Syslog as root user?
Does Syslog setup to listen on 514?
If Splunk does not run as root, how has you setup UDP/514? Rsyslog where Splunk reads log files?
Thanks for all your help and your time, it's very strange as you said... I opened syslog on port 5014 udp, i also checked the file props.conf on MikroTik app match the port.
I also tried as you said with echo "hello" and it's working.
I think there is some problem with timestamp because then it stops collect i got some error in internal index:
08-18-2019 19:09:43.054 +0200 WARN DateParserVerbose - Failed to parse timestamp in first MAX_TIMESTAMP_LOOKAHEAD (32) characters of event. Defaulting to timestamp of previous event (Sun Aug 18 01:28:00 2019). Context: source=udp:5014|host=192.168.1.1|syslog|
I checked around on google but I didn't find a solution
Re: Using Splunk to analyse MikroTik logs 2.7 (Graphing everything)
Posted: Mon Aug 19, 2019 8:21 am
by Jotne
You do not have the possibility to try a test server and install Splunk as root with only follow the first post?`
Whats wrong in your case is a riddle.
Re: Using Splunk to analyse MikroTik logs 2.7 (Graphing everything)
Posted: Mon Aug 19, 2019 9:30 am
by ferdytao
You do not have the possibility to try a test server and install Splunk as root with only follow the first post?`
Whats wrong in your case is a riddle.
It's a real riddle!
The server is running as a root on my last test with ubuntu but nothing is changed. Now I just changed the port from 5014 to default 514 (I used 5014 because on my synology is already kept) and seems to be working. I will keep it running to see what happen!
Thanks for all your support and time spent!

Re: Using Splunk to analyse MikroTik logs 2.7 (Graphing everything)
Posted: Tue Aug 20, 2019 12:19 am
by ferdytao
Finally it's working!
Just uncommented the option: MAX_TIMESTAMP_LOOKAHEAD = 23 "inside /opt/splunk/etc/apps/MikroTik/default/props.conf"
Re: Using Splunk to analyse MikroTik logs 2.7 (Graphing everything)
Posted: Tue Aug 20, 2019 8:27 am
by Jotne
For me it then sounds like you have a time problem. Its important that all clock is synced by using NTP.
Look at time on your router and on Splunk server. It should be within the same second.
Or date stamp is in the wrong format. Not sure how you can get this, since MT sends it in correct format.
You sends UDP directly to Splunk, not using rsyslog or syslog-ng etc?
Something adding data to your UDP packets?
From the manual
MAX_TIMESTAMP_LOOKAHEAD = <integer>
* Specifies how far (in characters) into an event Splunk should look for a timestamp.
* This constraint to timestamp extraction is applied from the point of the TIME_PREFIX-set location.
* For example, if TIME_PREFIX positions a location 11 characters into the event, and MAX_TIMESTAMP_LOOKAHEAD is set to 10, timestamp extraction will be constrained to characters 11 through 20.
So this sets where to look for the time stamp.
Re: Using Splunk to analyse MikroTik logs 2.7 (Graphing everything)
Posted: Sat Aug 24, 2019 5:00 pm
by stuartkoh
After I posted this reply I realized that I goofed.
I didn't read the post I replied to very well. I looked at the event you posted and just looked at the timestamp at the beginning of it and completely missed that it was a Splunk internal log.
So you can probably ignore what I had posted shown below about how to handle the timestamp in your logs. It does show how to setup timestamp detection, but for the wrong logs.
What I originally posted is below:
Finally it's working!
Just uncommented the option: MAX_TIMESTAMP_LOOKAHEAD = 23 "inside /opt/splunk/etc/apps/MikroTik/default/props.conf"
I think you could probably change it to MAX_TIMESTAMP_LOOKAHEAD = 29
The timestamp in your events is "08-18-2019 19:09:43.054 +0200" and Splunk needs to know that all of that is part of the timestamp in order to parse things properly. If you use 23 for the lookahead, Splunk may not catch the timezone.
So maybe:
MAX_TIMESTAMP_LOOKAHEAD = 29
TIME_PREFIX = ^
TIME_FORMAT = %m-%d-%Y %H:%M:%S.%3N %z
Re: Using Splunk to analyse MikroTik logs 2.7 (Graphing everything)
Posted: Sat Aug 24, 2019 5:05 pm
by stuartkoh
BTW, Packt is giving away a free copy of a decent book on Splunk today.
https://www.packtpub.com/free-learning
Implementing Splunk 7 - Third Edition
James D. Miller
Mar 2018
576 pages
What will you learn
Enrich machine-generated data and transform it into useful, meaningful insights
Perform search operations and configurations, build dashboards, and manage logs
Extend Splunk services with scripts and advanced configurations to process optimal results
You have to sign up for an account with them, but I've had one for several years and they haven't been obnoxious about sending me too much e-mail or anything. The offer expires later today (in about 10 hours from when I'm posting this) so I hope people will see this in time to take advantage of this.
My only connection with Packt is as a customer. I've bought some of their books and gotten some good free ones from them too.
Re: Using Splunk to analyse MikroTik logs 2.7 (Graphing everything)
Posted: Sat Aug 24, 2019 5:24 pm
by stuartkoh
See if your prefix is correct at section 2b. On wrong characters and it break all.
You can also do a search with only a start * and set it to last 24 hour and see what data you get.
Yes it's correct, if I do that search last packet is 2 ours ago now while the counter is increasing
Sometimes Splunk will mistakenly identify the timestamp of an event as coming from the future because it misinterprets the timezone (or the sending device has the incorrect time set and actually is telling Splunk the events are from the future.
So it can be useful to run a search with "All time" selected in the time picker. If there are events "from the future" they will show up this way. You can also run an "All time (real time)" search and see events as they come in and see what the timestamps are. Just be careful with real-time searches on Splunk because they use up a lot of resources. So I only use them when I really need to, and I stop them as soon as I have what I want.
(There are some times when you need to have a real-time search running all the time for very time-critical alerting, but it's normally better for performance to change a real-time search into a scheduled one running every 5 minutes or whatever. Each real-time search basically ties up a CPU core, so if you have several real-time searches running at once you can see poor overall performance on your search heads.)
I don't know if you're getting events "from the future" or not, but it might be worth checking.
Re: Using Splunk to analyse MikroTik logs 2.7 (Graphing everything)
Posted: Sat Aug 24, 2019 5:29 pm
by stuartkoh
For me it then sounds like you have a time problem. Its important that all clock is synced by using NTP.
Look at time on your router and on Splunk server. It should be within the same second.
Yes! What Jotne said!
It is extremely important to make sure the clocks on your devices and your Splunk servers are all in sync. Having time properly synced is very important for logging in general, but especially so for things like Splunk where you'll want to correlate events from different devices.
Re: Using Splunk to analyse MikroTik logs 2.7 (Graphing everything)
Posted: Sat Aug 24, 2019 9:28 pm
by Jotne
I think you could probably change it to MAX_TIMESTAMP_LOOKAHEAD = 29
The timestamp in your events is "08-18-2019 19:09:43.054 +0200" and Splunk needs to know that all of that is part of the timestamp in order to parse things properly. If you use 23 for the lookahead, Splunk may not catch the timezone.
So maybe:
MAX_TIMESTAMP_LOOKAHEAD = 29
TIME_PREFIX = ^
TIME_FORMAT = %m-%d-%Y %H:%M:%S.%3N %z
If you see
props.conf in the MikroTik app, the
MAX_TIMESTAMP_LOOKAHEAD = 23 line is not active due to
# in front of it
So you should only change this if it does not work.
Still not sure why you need to sett it. Maybe you have other settings that influence on how Splunk handle MikroTik data.
Re: Using Splunk to analyse MikroTik logs 2.7 (Graphing everything)
Posted: Sun Aug 25, 2019 11:00 am
by ferdytao
Thanks everyone for the answers, It's seems to be working since 7 days now so I prefer to not changing anything!
I just uncommented the line MAX_TIMESTAMP_LOOKAHEAD = 23 and the time zone is also working properly, to be sure I also set the NTP to all devices and nothing else.
If I will have some time to spend, I will try to manage another install of splunk to try the LOOKAHEAD of 29
Re: Using Splunk to analyse MikroTik logs 2.7 (Graphing everything)
Posted: Thu Aug 29, 2019 4:52 pm
by jacauc
I created a dropdown to select rules on the Live Attack View. All my mikrotik prefixes start with either Allow or Drop - Such as DropPings, AllowDNS etc.
Now I can quickly see the entire overview of my rules.
The updated dashboard code is below:
<form theme="dark">
  <label>MikroTik Live attack</label>
  <description>Shows form where ip comes from that tries to access your router on ports that are not opened using rule "FW_Drop_all_from_WAN"</description>
  <!--Version
  2.4.0
  2.5.1 Change to "coalesce"
  2.7.1 Change to base searc
  2.7.2 Revritten to speed up and added more dropdown
  ######################################################
  #
  # Mikrotik Add-On for Splunk
  #
  # Copyright (C) 2019 Jotne
  # All Rights Reserved
  #
  # v2.7
  #
  ######################################################
  -->
  <search id="base_search">
    <query>
      sourcetype=mikrotik
      module=firewall
      rule="*"
      | table _time host dest_port src_ip protocol rule
      | iplocation src_ip
      | replace "" with "Unknown" in City,Country
      | fields - Region
      | search
          host="$Host$"
          protocol="$protocol$"
          dest_port="$port$"
          Country="$Country$"
          rule="$Rule$"
    </query>
  </search>
  <fieldset submitButton="false" autoRun="true">
    <input type="time">
      <label>Time span</label>
      <default>
        <earliest>rt-5m</earliest>
        <latest>rt</latest>
      </default>
    </input>
    <input type="dropdown" token="Host">
      <label>Host</label>
      <search base="base_search">
        <query>
          | eval data=host
          | stats count by data
          | eval info=data." (".count.")"
          | sort -count
        </query>
      </search>
      <choice value="*">Any</choice>
      <fieldForLabel>info</fieldForLabel>
      <fieldForValue>data</fieldForValue>
      <default>*</default>
    </input>
    <input type="dropdown" token="protocol">
      <label>Protocol</label>
      <search base="base_search">
        <query>
          | eval data=protocol
          | stats count by data
          | eval info=data ." (".count.")"
          | sort -count
        </query>
      </search>
      <choice value="*">Any</choice>
      <fieldForLabel>info</fieldForLabel>
      <fieldForValue>data</fieldForValue>
      <default>*</default>
    </input>
    <input type="dropdown" token="port">
      <label>Port</label>
      <search base="base_search">
        <query>
          | eval data=dest_port
          | stats count by data
          | eval info=data ." (".count.")"
          | sort -count
        </query>
      </search>
      <choice value="*">Any</choice>
      <fieldForLabel>info</fieldForLabel>
      <fieldForValue>data</fieldForValue>
      <default>*</default>
    </input>
    <input type="dropdown" token="Country">
      <label>Country</label>
      <search base="base_search">
        <query>
          | eval data=Country
          | stats count by data
          | eval info=data ." (".count.")"
          | sort -count
        </query>
      </search>
      <choice value="*">Any</choice>
      <fieldForLabel>info</fieldForLabel>
      <fieldForValue>data</fieldForValue>
      <default>*</default>
    </input>
    <input type="dropdown" token="Rule">
      <label>Rule</label>
      <search base="base_search">
        <query>
          | eval data=rule
          | stats count by data
          | eval info=data ." (".count.")"
          | sort -count
        </query>
      </search>
      <choice value="*">Any</choice>
      <choice value="Allow*">AnyAllow</choice>
      <choice value="Drop*">AnyDrop</choice>
      <fieldForLabel>info</fieldForLabel>
      <fieldForValue>data</fieldForValue>
      <default>Drop*</default>
      <initialValue>Drop*</initialValue>
    </input>
  </fieldset>
  <row>
    <panel>
      <map>
        <search base="base_search">
          <query>
            | eval info=src_ip."-".City."-".Country."-".protocol."/".dest_port
            | geostats globallimit=0 count by info
          </query>
        </search>
        <option name="height">600</option>
        <option name="refresh.display">progressbar</option>
      </map>
    </panel>
  </row>
</form>
2019-08-29_15-50-50.jpg
Re: Using Splunk to analyse MikroTik logs 2.7 (Graphing everything)
Posted: Sat Aug 31, 2019 10:45 am
by Jotne
Interesting.
I may implement this in ver 2.8
Re: Using Splunk to analyse MikroTik logs 2.7 (Graphing everything)
Posted: Sat Aug 31, 2019 11:01 am
by jacauc
Interesting.
I may implement this in ver 2.8
Please do!
Do you have a beta of 2.8 yet, or is it imminent for release?
Re: Using Splunk to analyse MikroTik logs 2.7 (Graphing everything)
Posted: Sat Aug 31, 2019 10:29 pm
by Jotne
I am always working with some changes, and release new version when I have spare time to do it
Here is the working list for 2.8
# 2.8 (xx.xx.2019)
# Added interface changes
# Updated script to 2.7, added uncounted traffic and fastrack test, fixed when missing temperature
# Updated script to 2.8, fixed where system healt does not show anything (x86)
# Updated script to 2.9, get interface counters and you can also set modules true/false
# Updated script to 3.0, get CDP neigbhours
# Added new view "MikroTik Neighbor"
# Added uncounted packages to "MikroTik Traffic"
# Added board_name to "MikroTik Device List"
# Added Mikrotik interface Traffic"
# Fixed l2tp user extraction
# Fixed VPN when user info is missing
# Added access rule dropdown to "Mikrotik Live attack"
Re: Using Splunk to analyse MikroTik logs 2.7 (Graphing everything)
Posted: Fri Oct 18, 2019 3:29 pm
by keattikun
Hi Jotne
I'm try to install Mikrotik2.7 app on splunk. It not working for me, and I able to search log on splunk that send from MK but in app show "No results found" as capture

Please help me to investigate
Re: Using Splunk to analyse MikroTik logs 2.7 (Graphing everything)
Posted: Fri Oct 18, 2019 10:17 pm
by Jotne
You are 100% sure you have 2b correctly?
Click on Search
In search line add only a * (star) and search last 24 hour. Do you see any data?
Re: Using Splunk to analyse MikroTik logs 2.7 (Graphing everything)
Posted: Wed Nov 13, 2019 5:36 pm
by jvanhambelgium
Hi Jo,
Great set of dashboards! All working just fine.
In order to customize them further, when can I take out some complete dash-boards ? (pressing "Dashboards" in Splunk gives you the overview)
Don't need any Wireless or Upnp stuff and I would like to get it off the list.
Under the actions-button there is no such as a "Delete" choice.
EDIT : Ok, figured it out after untarring the app that I needed to edit some XML.
Re: Using Splunk to analyse MikroTik logs 2.7 (Graphing everything)
Posted: Fri Nov 15, 2019 7:03 pm
by jvanhambelgium
Jotne,Great, I did it according to your script, and the beautiful chart shows normal. I tried to add scripts to my multiple ccr and routerboards, so my interface has a lot of duplicate names, such as bonding1 and bridge1, how can I distinguish between them, or change the name for each interface.
4.png
Hi can you give some hints on how to do that in Splunk (I'm running 8.0.0 FREE) ? Whatever graph I make, it seems to have a rolling time-line on the X-axis every 10-15 seconds and each 5 minutes the TX and RX values are plotted but not like this. I need to the X-axis to be fixed, 5-minutes increments to match the input coming from the script.
Re: Using Splunk to analyse MikroTik logs 2.7 (Graphing everything)
Posted: Fri Nov 15, 2019 7:38 pm
by Jotne
You need to have unique naming or else data will be joined.
What you can do is to use some values and join them together.
Eks using host-name port-number interface name etc and create a new join name.
| eval newifname=host."-".ifname
Without seeing the real problem its not easy to give a solution.
Re: Using Splunk to analyse MikroTik logs 2.7 (Graphing everything)
Posted: Mon Dec 02, 2019 10:01 pm
by blinderix
Jotne, Greetings for the good job!
I'm new to Splunk and keep reading.
I'm curious how to make the drop down list with host IP's to show the identity of the router instead the IP address.
Is it possible with some kind of lookup or token?
Regards,
Re: Using Splunk to analyse MikroTik logs 2.2 (Graphing everything)
Posted: Thu Dec 05, 2019 7:08 pm
by blinderix
No idea why it stops working.
I have run Splunk for years without it stopping by it self, always using Ubuntu Server.
Maybe there are some other stuff/software on you Ubuntu that kills it.
Finally there is a problem with timestamp, found on splunkd.log
08-01-2018 15:52:07.610 +0300 WARN DateParserVerbose - Failed to parse timestamp in first MAX_TIMESTAMP_LOOKAHEAD (32) characters of event. Defaulting to timestamp of previous event (Wed Aug 1 02:35:00 2018). Context: source=udp:514|host=192.168.1.1|syslog|
And it stops logging.
This is an example of what mikrotik sends to me, on another syslog server
192.168.1.1 Jul 12 00:17:05 firewall,info DROP INPUT input in:pppoe-WAN out:(unknown 0), proto TCP (SYN), 79.129.108.120:41236->79.129.36.201:7547, len 44
Any work around ?
No matter the question is old, I had the same problem. The logs from some routers stopped and had to restart the splunk each time.
I had the same timestamp error in the log file.
Yesterday I changed in props.conf : DATETIME_CONFIG = CURRENT and till now, almost 24h, everything runs smoothly.
Re: Using Splunk to analyse MikroTik logs 2.8 (Graphing everything)
Posted: Sat Dec 07, 2019 10:56 am
by Jotne
2.8 Finally released.
# 2.8 (07.12.2019)
# Added interface changes
# Updated script to 2.7, added uncounted traffic and fastrack test, fixed when missing temperature
# Updated script to 2.8, fixed where system healt does not show anything (x86)
# Updated script to 2.9, get interface counters and you can also set modules true/false
# Updated script to 3.0, get CDP neigbhours
# Added new view "MikroTik Neighbor"
# Added uncounted packages to "MikroTik Traffic"
# Added board_name to "MikroTik Device List"
# Added Mikrotik interface Traffic"
# Fixed l2tp user extraction
# Fixed VPN when user info is missing
# Added access rule dropdown to "Live attack"
# Added some color and more field to "DHCP Request"
# Fixed Span and removed time scal "System Changes"
# Fixed missing mac in "Admin Conection"
# Added more lines and color in "DHCP request"
# Added output color in "Firewall Rules"
# Added rule menu to "Live attack"
# Added "DATETIME_CONFIG = CURRENT" to props.conf
Re: Tool: Using Splunk to analyse MikroTik logs 2.8 (Graphing everything)
Posted: Sat Dec 21, 2019 4:51 pm
by Jotne
Tested with latest Splunk 8.0.1 and it works fine.
Re: Tool: Using Splunk to analyse MikroTik logs 2.8 (Graphing everything)
Posted: Sun Dec 22, 2019 10:19 am
by jo2jo
wow, thanks so much for all the time and effort you have put into this! it really is an excellent splunk app, thank you!
I do have your splunk app working on both of our splunk servers, when i add the "MikroTik" prefix to remote logs for a few test mikrotiks.
(our splunk servers are not the free version, but are licensed)
However we have been using splunk for a few years, and have many (over 200+) mikrotiks already sending lots of data into splunk via syslog, so im trying to avoid having to winbox into each of them and add a duplicate remote rule (with your "MikroTik" prefix).
Our mikrotiks are all configured to send logs into splunk like this:
(config from the splunk side)
udp 8002 data_input goes into splunk index "mikrotikFirewall"
udp 8004 data_input goes into splunk index "mikrotikOther"
Each of our many mikrotiks does have a prefix set (ie /system logging add action=remoteSplunk prefix=+LOCATION-NAME-FW- topics=firewall ) - (note the "+" before location-name) we ofcourse uses the prefixes to help our own manual searching within splunk
my question: Would you please point me in the right direction of what i would need to modify so that your app/views searches splunk entries with our prefix, as opposed to your "MikroTik"
Things i have tried / looked into:
\Splunk\etc\apps\MikroTik\default\props.conf - Changing the 1st line, [source::udp:514] to [source::udp:8002] - (made no difference, so i changed it back)
\Splunk\etc\apps\MikroTik\default\transforms.conf - Changing the [force_mikrotik]... REGEX = \s\+[a-zA-Z0-9\-\:]+\s - ( this regex, as all of our log prefixes do start with "+" , this also made no difference)
In splunk web gui: data Inputs->UDP -> udp:8002 , setting the source type to "mikrotik" (from our initial source_type setting of "syslog") - also did not get desired result.
(keep in mind that i did try these things together, and separately, and was restarting splunk server after any changes).
(i would have no problem setting up a 3rd, new free license splunk just for using your app, however our mikrotik splunk intake alone is much more than 500mb/day currently)
thanks again!
Re: Tool: Using Splunk to analyse MikroTik logs 2.8 (Graphing everything)
Posted: Wed Dec 25, 2019 5:19 pm
by Jotne
Since I do use the tag to add sourcetype to the log entry, I think its there you should start.
Change all dashboard from using: sourcetype=mikrotik to use your index like this: index=mikrotikOther or index=mikrotikFirewall
Re: Tool: Using Splunk to analyse MikroTik logs 2.8 (Graphing everything)
Posted: Sat Mar 07, 2020 8:10 am
by kenkilaw
Good job !! I'll test it, thanks for sharing Jotne !!
Re: Tool: Using Splunk to analyse MikroTik logs 2.8 (Graphing everything)
Posted: Thu Mar 12, 2020 6:53 pm
by silverblade
Evening, everybody. One question, use splunk 8 and latest version of the app. I would like to have the results with the name of mikrotik instead of ip or dns. Can you explain please? Thank you
Re: Tool: Using Splunk to analyse MikroTik logs 2.8 (Graphing everything)
Posted: Thu Mar 12, 2020 7:07 pm
by Jotne
Not sure what you mean. Can you give some example?
Re: Tool: Using Splunk to analyse MikroTik logs 2.8 (Graphing everything)
Posted: Fri Mar 13, 2020 11:38 am
by silverblade
Not sure what you mean. Can you give some example?
So, I always set the identity in my mikrotik but in splunk I see the ip or dns address. I'd like to see the identity on the menu or else I don't know who it is directly. If it's possible... Thank you.

Re: Tool: Using Splunk to analyse MikroTik logs 2.8 (Graphing everything)
Posted: Sat Mar 14, 2020 12:25 am
by Jotne
This is how Syslog works.
It sends log data with standard message from the MikroTik Router like this:
system,info,account MikroTik: user xxx logged out from 10.10.10.32 via winbox
system,info MikroTik: dhcp lease changed
system,info MikroTik: dhcp lease changed
system,info MikroTik: static dns entry changed by xxx
system,info MikroTik: static dns entry changed by xxx
system,info MikroTik: device changed by xxx
system,info MikroTik: device changed by xxx
It does not contain any identifier only IP.
I see three ways this can be solved.
1. You add DNS record for your IP in your local DNS server.
2. Change the "MikroTik" tag to some like "MikroTik Device=Router58". I have not tested it, so not sure what would break
3. Use the data from "MikroTik device list" in a subsearch to get the device name.
Re: Tool: Using Splunk to analyse MikroTik logs 2.8 (Graphing everything)
Posted: Tue Mar 17, 2020 10:29 am
by Jotne
So, I always set the identity in my mikrotik but in splunk I see the ip or dns address. I'd like to see the identity on the menu or else I don't know who it is directly. If it's possible... Thank you.
I have a solution for this in v2.9.
It reads the "MikroTik Device List" and store it inn to a KV store file every night. Then this data i later used in other view.
Re: Tool: Using Splunk to analyse MikroTik logs 2.8 (Graphing everything)
Posted: Thu Apr 02, 2020 1:49 pm
by valeex87
Hi, how can i make a script on mikrotik for check user that connects/disconnect in ovpn?
On splunk in "MikroTik VPN Connection" everything is clear and not populated, ovpn works correctly but on splunk i cant find whats my ip and the user who connected.
Thanks
Re: Tool: Using Splunk to analyse MikroTik logs 2.8 (Graphing everything)
Posted: Thu Apr 02, 2020 6:48 pm
by Jotne
Hi
I have not used ovpn, so have not looked at it. If it logs other stuff, you you then send me a copy of the logs when a user logs inn and out using ovpn.
Do a search like this
or copy the logs from Mikrotik directly
Re: Tool: Using Splunk to analyse MikroTik logs 2.8 (Graphing everything)
Posted: Wed Apr 08, 2020 1:57 pm
by Jotne
Script updated to version 3.3
Added script info and NTP status.
Backward compatible so you can just overwrite previous version.
Re: Tool: Using Splunk to analyse MikroTik logs 2.8 (Graphing everything)
Posted: Mon Apr 13, 2020 11:23 am
by Jotne
Script updated to 3.4
Gives more correct transfer statistics pr interface.
Re: Tool: Using Splunk to analyse MikroTik logs 2.9 (Graphing everything)
Posted: Tue Apr 14, 2020 1:34 pm
by Jotne
Splunk for MikroTik is updated to 2.9
# 2.9 (14.04.2020)
# Added KVstore DB to handel device info (identity)
# Fixed "MikroTik DNS Live usage" showing wrong count
# Fixed "MikroTik DHCP request" duplicate entity and cleaned up table
# Renamed "Mikrotik Admin connection" to "MikroTik Admin user login"
# Removed "_time" for X-Axes in dashboards
# Added NTP warning to "MikroTik System Changes"
# Added auto lookup of host to identity
# Added option to select CPU/Disk/Memory in "MikroTik Resources"
# Rearanged the menu layout
# Moved various test to the "device list" page and set the page as default
Mayor change is the new Menu layout and the KVstore. The DB makes the devices show up with their identity name and not just the IP.
This version also needs the latest version of the script (ver 3.4+) installed.
To upgrade, just download the file in the first post (section 1g), unrar and install. You can expand the tar ball and copy the files manually.
Script should be updated on the routers as well.
Re: Tool: Using Splunk to analyse MikroTik logs 2.9 (Graphing everything)
Posted: Wed Apr 15, 2020 8:55 pm
by Jotne
Script updated to 3.5
More compatible with Router OS v7.0 that has a problem with some function that does not work like:
/ip accounting uncounted {
	:log info message=("script=uncounted,bytes=".[get bytes].",packets=".[get packets])
And
:local model ([/system routerboard get model])
:local serial ([/system routerboard get serial-number])
This may be due to v.7 does run on a X86 VM. 6.47beta on VM does not fail, so its a but in v7.
Re: Tool: Using Splunk to analyse MikroTik logs 2.9 (Graphing everything)
Posted: Sun May 10, 2020 2:42 pm
by jesuraja
Interface Traffic Graph not sync.It's nothing. How can i troubleshoot to resolve
Re: Tool: Using Splunk to analyse MikroTik logs 2.9 (Graphing everything)
Posted: Mon May 11, 2020 8:45 am
by Jotne
Do you see any data in other graphs?
Re: Tool: Using Splunk to analyse MikroTik logs 2.9 (Graphing everything)
Posted: Mon May 11, 2020 3:34 pm
by Jotne
An serious error found in the script in 2f. If NTP module is missing, the whole script fails. Fixed in new version 3.6.
Re: Tool: Using Splunk to analyse MikroTik logs 2.9 (Graphing everything)
Posted: Wed May 13, 2020 3:16 pm
by verpeilo
Hello!
I've setup as described in your tutorial.
But unfortunately there is no data available in Splunk.
After detailed investigations I have found, that there is no prefix "MikroTik" in log messages, even I defined in logging rules:
loggingrules.png
Rebooting the Routerboard did not help as well.
Splunk is completely empty...
Do you have any ideas?
/edit: Sorry, my fault. I was a little bit blind...
/solved
Re: Tool: Using Splunk to analyse MikroTik logs 2.9 (Graphing everything)
Posted: Wed May 13, 2020 3:38 pm
by oaas
There seems to be a kind a catch 22" situation with the "new" KVstore DB.
The KVstore fails to initially poplate as field extraction by "device lookup updater" is failing to auto extract the fields "identity, serial, model, board_name, version" while the lookup "automatic_device_lookup" is enabled. This results in missing information for "identity, serial, model, board_name, version" in the main "Device List" view (and other places).
After I disabled the lookup "automatic_device_lookup" the "device lookup updater" executed successfully populating the KVstore DB. In the end I enabled the "automatic_device_lookup", and view functionality seems to be working as expected.
Re: Tool: Using Splunk to analyse MikroTik logs 2.9 (Graphing everything)
Posted: Wed May 13, 2020 3:48 pm
by Jotne
You are 100% correct.
I did fix this by using
coalesce
| eval identity=coalesce(identity,host)
Version 3.0 will be out soon with this fix and som other stuff as well.
PPPoE logging
IPv6 IP support in firewall
Re: Tool: Using Splunk to analyse MikroTik logs 2.9 (Graphing everything)
Posted: Wed May 13, 2020 3:48 pm
by verpeilo
There seems to be a kind a catch 22" situation with the "new" KVstore DB.
The KVstore fails to initially poplate as field extraction by "device lookup updater" is failing to auto extract the fields "identity, serial, model, board_name, version" while the lookup "automatic_device_lookup" is enabled. This results in missing information for "identity, serial, model, board_name, version" in the main "Device List" view (and other places).
After I disabled the lookup "automatic_device_lookup" the "device lookup updater" executed successfully populating the KVstore DB. In the end I enabled the "automatic_device_lookup", and view functionality seems to be working as expected.
Same here.
Where do you disable it?
Re: Tool: Using Splunk to analyse MikroTik logs 2.9 (Graphing everything)
Posted: Wed May 13, 2020 3:58 pm
by Jotne
Can you try to run i manually.
Splunk-app:Mikrotik->Reports->Click on name "device lookup updater"
Do you get any information? (Try it twice)
If not, what do you get
Splunk-app:Mikrotik->Reports-> "device lookup updater" Open in Search
Re: Tool: Using Splunk to analyse MikroTik logs 2.9 (Graphing everything)
Posted: Wed May 13, 2020 4:11 pm
by verpeilo
I only get the host column filled - everything else is empty
Re: Tool: Using Splunk to analyse MikroTik logs 2.9 (Graphing everything)
Posted: Wed May 13, 2020 4:16 pm
by Jotne
What about this search?
sourcetype=mikrotik
            module=script
            script=sysinfo
| dedup host
| rex "version=\"(?<version>[^\"]*)\" board-name=\"(?<board_name>[^\"]*)\" model=\"(?<model>[^\"]*)\" serial=(?<serial>\S*) identity=\"(?<identity>[^\"]*)\""
| table  host identity serial model board_name version
Re: Tool: Using Splunk to analyse MikroTik logs 2.9 (Graphing everything)
Posted: Wed May 13, 2020 4:52 pm
by verpeilo
This works great!
Re: Tool: Using Splunk to analyse MikroTik logs 2.9 (Graphing everything)
Posted: Wed May 13, 2020 6:18 pm
by oaas
May I also suggest you include the following in future release:
MAX_TIMESTAMP_LOOKAHEAD = 23
I see others are also refering to issues with this earlier as well, and I'm having the exact same issue with one of my devices. Unless I add this the device (cAP ac) disappears from syslog parsing after a few hours.
Re: Tool: Using Splunk to analyse MikroTik logs 2.9 (Graphing everything)
Posted: Wed May 13, 2020 6:53 pm
by verpeilo
Is it "normal" that Splunk is quite slow?
I have it running since 4-5 hours and the Traffic Accounting Dashboard takes 2 minutes until some results are shown...
Re: Tool: Using Splunk to analyse MikroTik logs 2.9 (Graphing everything)
Posted: Wed May 13, 2020 7:43 pm
by jvanhambelgium
Is it "normal" that Splunk is quite slow?
I have it running since 4-5 hours and the Traffic Accounting Dashboard takes 2 minutes until some results are shown...
No that seems not normal...
The "Traffic" dashboard show here in about 2 seconds when selecting "Time Range = last 4 hours". I run Splunk Enterprise 8.0.1 (FREE Edition, so limited at 500MB/day indexing) on a VM on my Synology NAS, gave it 4vCPU & 2GB RAM
What are you running Splunk on ?
If you go to "Settings" on the top and then select "Monitoring Console" what stats do you see ?
Re: Tool: Using Splunk to analyse MikroTik logs 2.9 (Graphing everything)
Posted: Wed May 13, 2020 9:01 pm
by Jotne
MAX_TIMESTAMP_LOOKAHEAD = 23
Added in the upcoming 3.0
Re: Tool: Using Splunk to analyse MikroTik logs 2.9 (Graphing everything)
Posted: Thu May 14, 2020 9:30 am
by verpeilo
Is it "normal" that Splunk is quite slow?
I have it running since 4-5 hours and the Traffic Accounting Dashboard takes 2 minutes until some results are shown...
No that seems not normal...
The "Traffic" dashboard show here in about 2 seconds when selecting "Time Range = last 4 hours". I run Splunk Enterprise 8.0.1 (FREE Edition, so limited at 500MB/day indexing) on a VM on my Synology NAS, gave it 4vCPU & 2GB RAM
What are you running Splunk on ?
If you go to "Settings" on the top and then select "Monitoring Console" what stats do you see ?
I have Splunk Enterprise 8.0.3 FREE Edition as well.
I run it on a Windows Server 2019 Standard.
4 Intel CPUs, 16GB RAM.
I can install it was well on a Linux System to compare the performance, but I don't think that the architecture has an impact like this.
stats_splunk.png
Re: Tool: Using Splunk to analyse MikroTik logs 2.9 (Graphing everything)
Posted: Thu May 14, 2020 10:19 am
by verpeilo
Update regarding the performance:
I installed Splunk on the same Windows Server, but in a Hyper-V Ubuntu 18.04.4 environment with only 2 CPUs and 2 GB of RAM.
==> Now it is very fast.
Seems that Splunk in Windows is slow... Hmm.
However, I am happy with this Linux VM.
Other question:
Is there an option, to give comments to the IP-Adresses in Traffic Throughput Monitor?
Sometimes the IPs are solved to Hostnames, but I would be happy to define comments as well.
Re: Tool: Using Splunk to analyse MikroTik logs 2.9 (Graphing everything)
Posted: Thu May 14, 2020 10:42 am
by Jotne
Other question:
Is there an option, to give comments to the IP-Adresses in Traffic Throughput Monitor?
Sometimes the IPs are solved to Hostnames, but I would be happy to define comments as well.
I do recommend using Linux for Splunk. Its created for Linux, later exported to work in Windows.
My install are usually done on Ubuntu server.
It would be possible to read the comment from an address and store and use it in Splunk, but not sure how this will work with large access lists.
My router blocks all that tries any non open port for 24 hours to access any port on my router. This creates an access list that can be between 2000 to 15000 addresses. So sending this every 5 minutes would be a big chunk.
Re: Tool: Using Splunk to analyse MikroTik logs 2.9 (Graphing everything)
Posted: Thu May 14, 2020 11:55 am
by verpeilo
Other question:
Is there an option, to give comments to the IP-Adresses in Traffic Throughput Monitor?
Sometimes the IPs are solved to Hostnames, but I would be happy to define comments as well.
I do recommend using Linux for Splunk. Its created for Linux, later exported to work in Windows.
My install are usually done on Ubuntu server.
It would be possible to read the comment from an address and store and use it in Splunk, but not sure how this will work with large access lists.
My router blocks all that tries any non open port for 24 hours to access any port on my router. This creates an access list that can be between 2000 to 15000 addresses. So sending this every 5 minutes would be a big chunk.
Maybe you can configure it customizable if the comments should be read or not...
It would be very helpful.
/edit: Maybe you can build a function which determines the comment in DHCP leases
Re: Tool: Using Splunk to analyse MikroTik logs 2.9 (Graphing everything)
Posted: Thu May 14, 2020 3:52 pm
by Jotne
If you do use Splunk as a
non root (recomended) user, you need an external Syslog server.
This setup needs Splunk for Mikrotik v3.0 to read field correctly. (out soon)
This is how to set it up using Ubuntu server. Should work on most version.
rsyslog comes default with Ubuntu so no need to install any extra software.
PS do not modify these file to use other location. If you do so you will need to modify udp.conf rsyslog and input.conf splunk for every upgrade.
Copy these two files to
/etc/rsyslog.d/
udp.conf (sets up rsylog to accept Sylog on udp/514)
# rsyslog.d/udp.conf
#
# This receives UDP syslog on port 514 and stores it in a reliable format
# in /data/syslog/udp/:
#
#  - A subdirectory is created for each logging host.
#    The directory name is the source IP address of the received log message.
#    The log filename is made up of date and hour of file creation.
#    A new log file is created for each logging host every hour.
#
#  - Each log message is prefixed with a locally generated timestamp.
#
#  - Then the raw, undecoded text of the incoming syslog message is written.
#    If the message is missing <PRI> then a default <PRI> is prepended.
#    This ensures that both old tyle (RFC-3164) and new style (RFC-5424)
#    syslog messages can be recognised and parsed from the log files without
#    risk of loosing information. The raw messages also include the original
#    host name and time stamp from the sender.
#
#  - Each written log message is guaranteed to end in a single newline
#    character.
#

# Stupidly this is set to "on" in the default rsyslog.conf file
# Do our best to negate the effect.
$RepeatedMsgReduction off

module(load="imudp")


# format
template(name="RawFormat" type="list") {
  property(name="timegenerated" dateformat="rfc3339")
  constant(value=" ")
  constant(value="<")
  property(name="pri")
  constant(value=">")
  property(name="rawmsg-after-pri" droplastlf="on")
  constant(value="\n")
}

# file name
template(name="udp_split_filename" type="list") {
  constant(value="/data/syslog/udp/")
  property(name="fromhost-ip")
  constant(value="/")
  property(name="$year")
  property(name="$month")
  property(name="$day")
  constant(value="-")
  property(name="$hour")
  #property(name="$minute")
  constant(value=".log")
}

# rule set
ruleset(name="udp_split") {
  action(type="omfile"
    template="RawFormat"
    createDirs="on"
    dirCreateMode="0755"
    fileCreateMode="0644"
    dynaFile="udp_split_filename"
  )
}

# setting
input(type="imudp" port="514" ruleset="udp_split")
(sets up rsylog to accept Sylog on tcp/1514)
# rsyslog.d/tcp.conf
#
# This receives TCP syslog on port 1514 and stores it in a reliable format
# in /data/syslog/tcp/:
#
#  - A subdirectory is created for each logging host.
#    The directory name is the source IP address of the received log message.
#    The log filename is made up of date and hour of file creation.
#    A new log file is created for each logging host every hour.
#
#  - Each log message is prefixed with a locally generated timestamp.
#
#  - Then the raw, undecoded text of the incoming syslog message is written.
#    If the message is missing <PRI> then a default <PRI> is prepended.
#    This ensures that both old tyle (RFC-3164) and new style (RFC-5424)
#    syslog messages can be recognised and parsed from the log files without
#    risk of loosing information. The raw messages also include the original
#    host name and time stamp from the sender.
#
#  - Each written log message is guaranteed to end in a single newline
#    character.
#

# Stupidly this is set to "on" in the default rsyslog.conf file
# Do our best to negate the effect.
$RepeatedMsgReduction off

module(load="imtcp")


# format
template(name="RawFormat" type="list") {
  property(name="timegenerated" dateformat="rfc3339")
  constant(value=" ")
  constant(value="<")
  property(name="pri")
  constant(value=">")
  property(name="rawmsg-after-pri" droplastlf="on")
  constant(value="\n")
}

# file name
template(name="tcp_split_filename" type="list") {
  constant(value="/data/syslog/tcp/")
  property(name="fromhost-ip")
  constant(value="/")
  property(name="$year")
  property(name="$month")
  property(name="$day")
  constant(value="-")
  property(name="$hour")
  #property(name="$minute")
  constant(value=".log")
}

# rule set
ruleset(name="tcp_split") {
  action(type="omfile"
    template="RawFormat"
    createDirs="on"
    dirCreateMode="0755"
    fileCreateMode="0644"
    dynaFile="tcp_split_filename"
  )
}

# settings
input(type="imtcp" port="1514" ruleset="tcp_split")
Create the following folders
mkdir /data
mkdir /data/syslog
mkdir /data/syslog/tcp
mkdir /data/syslog/udp
Change folder rights to syslog and restart rsyslog
chown -R syslog:syslog /data/syslog
service rsyslog restart
run
ss or
netstat as root user to see that rsylog is running
ss -tunlp | grep syslog
udp   UNCONN 0      0                                0.0.0.0:514        0.0.0.0:*     users:(("rsyslogd",pid=5532,fd=8))
udp   UNCONN 0      0                                   [::]:514           [::]:*     users:(("rsyslogd",pid=5532,fd=9))
tcp   LISTEN 0      25                               0.0.0.0:1514       0.0.0.0:*     users:(("rsyslogd",pid=5532,fd=6))
tcp   LISTEN 0      25                                  [::]:1514          [::]:*     users:(("rsyslogd",pid=5532,fd=7))
netstat -tunlp | grep rsyslog
tcp        0      0 0.0.0.0:1514            0.0.0.0:*               LISTEN      1459/rsyslogd
tcp6       0      0 :::1514                 :::*                    LISTEN      1459/rsyslogd
udp        0      0 0.0.0.0:514             0.0.0.0:*                           1459/rsyslogd
udp6       0      0 :::514                  :::*                                1459/rsyslogd
To make Splunk reads the data, this
input.conf file is needed %SplunkHome%/etc/apps/MikroTik/default
It is
not included in current version 2.9, but will be included in 3.0. So you need to create it and restart Splunk.
[monitor:///data/syslog/udp/.../*.log]
sourcetype = mikrotik
host_segment=4

[monitor:///data/syslog/tcp/.../*.log]
sourcetype = mikrotik
host_segment=4
Test your server:
echo '<14>sourcehost message text' | nc -v -u -w 0 127.0.0.1 514
This should create a folder
/data/syslog/udp/127.0.0.1 with a
*.log file
Re: Tool: Using Splunk to analyse MikroTik logs 2.9 (Graphing everything)
Posted: Thu May 14, 2020 6:59 pm
by verpeilo
For what is it?
Re: Tool: Using Splunk to analyse MikroTik logs 2.9 (Graphing everything)
Posted: Thu May 14, 2020 7:39 pm
by Jotne
Did not understand the question.
My post above clearly stats that if you run Splunk as a non root user you need an external server to receive sysloge.
At least if you uses port below 1024, Splunk will not work. So Mikrotik send udp/515->rsyslog server <- Splunk reads the file.
Re: Tool: Using Splunk to analyse MikroTik logs 2.9 (Graphing everything)
Posted: Fri May 15, 2020 9:08 am
by Jotne
Other question:
Is there an option, to give comments to the IP-Adresses in Traffic Throughput Monitor?
Sometimes the IPs are solved to Hostnames, but I would be happy to define comments as well.
What commend do you like?
Name of host are resolved when Splunk uses DNS to find its name.
There are several places a comment could exist.
* DHCP comments
* DNS comments
* IP address lists comments
All this can set comment for an IP
To get all information with comment for all ip addresses in the address list and send it using syslog:
{
	:foreach interface in=[/ip firewall address-list find] do={
		:local output [ip firewall address-list get $interface]
		:set ( "$output"->"script" ) "addresses"
		:log info message= "$output"
	}
}
Re: Tool: Using Splunk to analyse MikroTik logs 2.9 (Graphing everything)
Posted: Fri May 22, 2020 12:33 pm
by markwien
If you do use Splunk as a
non root user, you need an external Syslog server.
This setup needs Splunk for Mikrotik v3.0 to read field correctly. (out soon)
This is how to set it up using Ubuntu server. Should work on most version.
rsyslog comes default with Ubuntu so no need to install any extra software.
Copy these two files to
/etc/rsyslog.d/
udp.conf (sets up rsylog to accept Sylog on udp/514)
# rsyslog.d/11_hemit_tcp.conf
#
# This receives UDP syslog on port 514 and stores it in a reliable format
# in /data/syslog/udp/:
#
#  - A subdirectory is created for each logging host.
#    The directory name is the source IP address of the received log message.
#    The log filename is made up of date and hour of file creation.
#    A new log file is created for each logging host every hour.
#
#  - Each log message is prefixed with a locally generated timestamp.
#
#  - Then the raw, undecoded text of the incoming syslog message is written.
#    If the message is missing <PRI> then a default <PRI> is prepended.
#    This ensures that both old tyle (RFC-3164) and new style (RFC-5424)
#    syslog messages can be recognised and parsed from the log files without
#    risk of loosing information. The raw messages also include the original
#    host name and time stamp from the sender.
#
#  - Each written log message is guaranteed to end in a single newline
#    character.
#

# Stupidly this is set to "on" in the default rsyslog.conf file
# Do our best to negate the effect.
$RepeatedMsgReduction off

module(load="imudp")


# format
template(name="RawFormat" type="list") {
  property(name="timegenerated" dateformat="rfc3339")
  constant(value=" ")
  constant(value="<")
  property(name="pri")
  constant(value=">")
  property(name="rawmsg-after-pri" droplastlf="on")
  constant(value="\n")
}

# file name
template(name="udp_split_filename" type="list") {
  constant(value="/data/syslog/udp/")
  property(name="fromhost-ip")
  constant(value="/")
  property(name="$year")
  property(name="$month")
  property(name="$day")
  constant(value="-")
  property(name="$hour")
  #property(name="$minute")
  constant(value=".log")
}

# rule set
ruleset(name="udp_split") {
  action(type="omfile"
    template="RawFormat"
    createDirs="on"
    dirCreateMode="0755"
    fileCreateMode="0644"
    dynaFile="udp_split_filename"
  )
}

# setting
input(type="imudp" port="514" ruleset="udp_split")
(sets up rsylog to accept Sylog on tcp/1514)
# rsyslog.d/11_hemit_tcp.conf
#
# This receives TCP syslog on port 1514 and stores it in a reliable format
# in /data/syslog/tcp/:
#
#  - A subdirectory is created for each logging host.
#    The directory name is the source IP address of the received log message.
#    The log filename is made up of date and hour of file creation.
#    A new log file is created for each logging host every hour.
#
#  - Each log message is prefixed with a locally generated timestamp.
#
#  - Then the raw, undecoded text of the incoming syslog message is written.
#    If the message is missing <PRI> then a default <PRI> is prepended.
#    This ensures that both old tyle (RFC-3164) and new style (RFC-5424)
#    syslog messages can be recognised and parsed from the log files without
#    risk of loosing information. The raw messages also include the original
#    host name and time stamp from the sender.
#
#  - Each written log message is guaranteed to end in a single newline
#    character.
#

# Stupidly this is set to "on" in the default rsyslog.conf file
# Do our best to negate the effect.
$RepeatedMsgReduction off

module(load="imtcp")


# format
template(name="RawFormat" type="list") {
  property(name="timegenerated" dateformat="rfc3339")
  constant(value=" ")
  constant(value="<")
  property(name="pri")
  constant(value=">")
  property(name="rawmsg-after-pri" droplastlf="on")
  constant(value="\n")
}

# file name
template(name="tcp_split_filename" type="list") {
  constant(value="/data/syslog/tcp/")
  property(name="fromhost-ip")
  constant(value="/")
  property(name="$year")
  property(name="$month")
  property(name="$day")
  constant(value="-")
  property(name="$hour")
  #property(name="$minute")
  constant(value=".log")
}

# rule set
ruleset(name="tcp_split") {
  action(type="omfile"
    template="RawFormat"
    createDirs="on"
    dirCreateMode="0755"
    fileCreateMode="0644"
    dynaFile="tcp_split_filename"
  )
}

# settings
input(type="imtcp" port="1514" ruleset="tcp_split")
Create the following folders
mkdir /data
mkdir /data/syslog
mkdir /data/syslog/tcp
mkdir /data/syslog/udp
Change folder rights to syslog and restart rsyslog
chown -R syslog:syslog /data/syslog
service rsyslog restart
run netstat to see that rsylog is running
netstat -tuopan | grep 514
(Not all processes could be identified, non-owned process info
 will not be shown, you would have to be root to see it all.)
tcp        0      0 0.0.0.0:1514            0.0.0.0:*               LISTEN      -                    off (0.00/0/0)
tcp6       0      0 :::1514                 :::*                    LISTEN      -                    off (0.00/0/0)
udp        0      0 0.0.0.0:514             0.0.0.0:*                           -                    off (0.00/0/0)
udp6       0      0 :::514                  :::*                                -                    off (0.00/0/0)
To maks Splunk reads the data, this
input.conf file is needed %SplunkHome%/etc/apps/MikroTik/default (included in v3.0)
[monitor:///data/syslog/udp/.../*.log]
sourcetype = mikrotik
host_segment=4

[monitor:///data/syslog/tcp/.../*.log]
sourcetype = mikrotik
host_segment=4
Test your server:
echo '<14>sourcehost message text' | nc -v -u -w 0 127.0.0.1 514
This should create a folder
/data/syslog/udp/127.0.0.1 with a
*.log file
hi i made installation exactly as your tutorial, but syslog files dont get read by splunk.
i am wondering how user splunk can read /data/ dir if the syslog dir runs under user syslog ....
do i miss something?
Re: Tool: Using Splunk to analyse MikroTik logs 2.9 (Graphing everything)
Posted: Fri May 22, 2020 1:58 pm
by Jotne
Splunk reads data since rights on the files are set by syslog so Splunk can read them and inputs.conf tells it to read them.
-rw-r--r-- 1 syslog syslog 2520311 May 22 12:56 20200522-12.log
The "r" in all three places makes all able to read the files.
To test, log in as the Splunk user:
sudo su - splunk
Do you see any folder/files under /data/syslog/udp ?
try to cat them
IF you do not see any files, there may be several problems
* Local firewall
* Syslog not set up correctly
* Nothing sending to udp/514
Splunk looks at the inputs.conf and see that it should read the files. (so if there are no inputs.conf in MikroTik/Default, you need to create it.
It will be included in upcoming v3.0
If all is setup correctly try in Splunk to search for
index=_internal source="*splunkd.log" NOT INFO
and see what errors/warnings you have.
PS no need to quote the whole post. Use
"Post Reply" button below post to reply, or quote only needed part.
Re: Tool: Using Splunk to analyse MikroTik logs 2.9 (Graphing everything)
Posted: Sat May 23, 2020 2:36 pm
by Jotne
Script updated to 3.8
Fixed so that some information only get collected every hour, even if scripts run every 5 min.
This is to not flod system with duplicate information.
Re: Tool: Using Splunk to analyse MikroTik logs 2.9 (Graphing everything)
Posted: Sun May 24, 2020 1:19 pm
by Jotne
Script updated to 3.9
Gives better command history for Router OS v7 or newer.
Fixed better handling with NTP/SNTP information
PS script can be updated without update Splunk software.
Re: Tool: Using Splunk to analyse MikroTik logs 2.9 (Graphing everything)
Posted: Sun May 24, 2020 11:52 pm
by Jotne
Did an change in what to debug settings in first post
Change from:
/system logging add action=logserver prefix=MikroTik topics=!debug
to:
/system logging add action=logserver prefix=MikroTik topics=!debug,!packet
This reduces overall DNS logging by 80%
So I do suggest that you add this, specially if you have a lots of DNS requests.
Re: Tool: Using Splunk to analyse MikroTik logs 2.9 (Graphing everything)
Posted: Mon May 25, 2020 5:02 pm
by fmarais007
Hi,
Thank you for all the hard work! This is really a nice tool.
Can you please assist.
I'm getting the following error. I'm running it on a Windows Server 2019 VM: Error in 'outputlookup' command: External command based lookup 'device_lookup' is not available because KV Store initialization has failed. Contact your system administrator.
Splunk-KV Store Failed-20200525.jpg
All the searches I do give me Linux commands to run, and I'm not sure if MongoD is even running?
Any help will be appreciated thank you.
Re: Tool: Using Splunk to analyse MikroTik logs 2.9 (Graphing everything)
Posted: Mon May 25, 2020 6:36 pm
by Jotne
I have see KV store error due to certificate error on splunk. Other than that, I do not know what can be wrong. I do suggest that you install Splunk from scratch on an Ubuntu 18.04 or 20.04 server. Works every time I have tried.
I do use less than an hour to install Ubuntu/Splunk and Mikrotik plugin and get all up and running.
Re: Tool: Using Splunk to analyse MikroTik logs 2.9 (Graphing everything)
Posted: Mon May 25, 2020 8:14 pm
by fmarais007
Hi,
OK I will do that. Sucks that the only answer is to try another OS, but oh well.
Another thing, is it possible to monitor several MikroTik's via this system, or is it only designed for a single device?
Thanks
Re: Tool: Using Splunk to analyse MikroTik logs 2.9 (Graphing everything)
Posted: Mon May 25, 2020 8:35 pm
by Jotne
It can monitor as many as you like. Only limit is the amount of data logged to Splunk. For free you get 500MB, that should be ok for a small to medium system, depending on what you select to log. DNS eats lots of log space.
What OS did you try? I do in first post recommend Ubuntu.
Ubuntu running on VmWare workstation on Windows server works fin as well, but I do recommend a dedicated server.
Re: Tool: Using Splunk to analyse MikroTik logs 2.9 (Graphing everything)
Posted: Tue May 26, 2020 10:54 am
by fmarais007
Hi,
No worries, I got it running on Ubuntu 20.04
So I once again tried to see the devices reporting but no data.
I then realized it only runs every morning at 01:00 so I tried to run it manually.
Even though I have two devices sending logs to Splunk successfully (I can see my firewall traffic, but can't filter by host), It's not showing any results:
Splunk-DeviceNoResults-20200526.jpg
No KV errors this time
How do I force the refresh of devices reporting to my server? I tried:
Splunk-ForceRun-20200526.jpg
If that is the correct method, why is it not appearing?
Thanks for all the help.
Re: Tool: Using Splunk to analyse MikroTik logs 2.9 (Graphing everything)
Posted: Tue May 26, 2020 1:41 pm
by Jotne
I am working with v3.0 and there the kv search is updated. Try this:
This should just give the devices:
sourcetype=mikrotik
module=script
script=sysinfo
| dedup host
Then if that gives lines, run this updated version.
sourcetype=mikrotik
module=script
script=sysinfo
| dedup host
| rex "version=\"(?<version>[^\"]*)\" board-name=\"(?<board_name>[^\"]*)\" model=\"(?<model>[^\"]*)\" serial=(?<serial>\S*) identity=\"(?<identity>[^\"]*)\""
| table  host identity serial model board_name version
| fillnull value="-"
| outputlookup device_lookup
Re: Tool: Using Splunk to analyse MikroTik logs 2.9 (Graphing everything)
Posted: Tue May 26, 2020 8:21 pm
by Rhoos
Hi Jotne,
Thank you for this magnificent work!
I have a small problem with the file "MikroTik2.9.spl.rar" for a few days I have tried without success to decompress the information, it always gives me an error using Winrar!
"The archive is either in unknown format or damaged"
Could you please check!
Thanks for your help and for the whole project.
Ricardo
Re: Tool: Using Splunk to analyse MikroTik logs 2.9 (Graphing everything)
Posted: Tue May 26, 2020 8:46 pm
by Jotne
Downloaded the file from this forum and expanded it using 7-zip (Winrar should do as well), so file seems fine,
Re: Tool: Using Splunk to analyse MikroTik logs 2.9 (Graphing everything)
Posted: Tue May 26, 2020 10:55 pm
by Rhoos
Thanks success, before making the query, use Winrar on two different computers, downloading a new file on each one without success, I followed your advice of "7-zip" and extracted it without any problem!
Ricardo
Re: Tool: Using Splunk to analyse MikroTik logs 3.0 (Graphing everything)
Posted: Wed May 27, 2020 10:27 pm
by Jotne
Splunk for MikroTik updated to v3.0
Mayor changes is the PPPoE view and support for IPv6 in the MikroTik Firewall Rules module
To upgrade, delete the folder /splunk/etc/app/Mikrotik
Then install the unpacked spl (use winrar/winzip) file, install app from
"Manage app" -> "Install app from file"
To get the most out of this version, upgrade the script (not needed) on the router to latest version. (3.9)
# 3.0 (27.05.2020)
# Fixed missing identity before device are logged to index
# Added PPPoE view
# Added IPv6 support for firewall
# Added support for using external rsyslog server
# Updated "Device List" to update KV-Store automatically when run
# Added dhcp_name to "MikroTik DHCP to Static"
# Change script and dashboard for "MikroTik Neighbor"
# Added more infor for the "Mikrotik Wifi connection"
# Updated script to 3.5, Better RouterOS v7 handling
# Updated script to 3.6, NTP info
# Updated script to 3.8, Change some colelction to get info every hour, not every 5 min (CDP++)
# Updated script to 3.9, to get better command history fro v7 RouterOS, fixed better NTP/SNTP handling
# Added minspan=5m to some graphs
# Fixed "MikroTik DNS Live usage" to work without dns packets log
Re: Tool: Using Splunk to analyse MikroTik logs 3.0 (Graphing everything)
Posted: Fri May 29, 2020 9:14 am
by fmarais007
Hello,
I was wondering if you can help with a previous post regarding CAPsMAN setup for your application.
Two of the charts uses the name of the interface for the data, but the problem comes in where if there are spaces in the interface it stops displaying the name before the space.
eg. if my interface name is "Client-A cAP-1" it only displays data for "Client-A", which means it misses data for all the other AP's.
This is the graph i'm referring to:
Splunk-CapGraphError-20200528.jpg
The chart uses the following search:
sourcetype=mikrotik counter>0 |chart values(counter) by name
Which gives these results when there are multiple AP's
Splunk-CapGraphErrorResult-20200529.jpg
And thereby displaying no results in the actual graph.
Would it be possible to either help me to define the search better, or perhaps integrate the OP's idea into your application?
Many thanks
Re: Tool: Using Splunk to analyse MikroTik logs 3.0 (Graphing everything)
Posted: Fri May 29, 2020 9:25 am
by Jotne
This is some wrong:
sourcetype=mikrotik counter>0 |chart values(counter) by name
Buts not easy to fix when I do not see the real log data.
Sent you a private message.
Re: Tool: Using Splunk to analyse MikroTik logs 3.0 (Graphing everything)
Posted: Wed Jun 03, 2020 10:37 am
by jvanhambelgium
Splunk for MikroTik updated to v3.0
Mayor changes is the PPPoE view and support for IPv6 in the MikroTik Firewall Rules module
To upgrade, delete the folder /splunk/etc/app/Mikrotik
Then install the unpacked spl (use winrar/winzip) file, install app from
"Manage app" -> "Install app from file"
To get the most out of this version, upgrade the script (not needed) on the router to latest version. (3.9)
Hi,
Can 2 versions co-exist somehow ? I'm currently running the 2.7 version in my Spunk which is modified a bit.
Would be great if I load the app/dashboard and it sits next to the existing one as "Mikrotik 3.0" or something.
Thanks!
EDIT : Hmm, doesn't seem to be, in the SPL-file "Mikrotik" seems hardcoded somehow internally because even if I rename the SPL-file to let's say "Mikrotik3_0.spl" before loading the app it still says I already have it running...
EDIT2 : It was along time since I played with it, but I've untarred the SPL-files and adapted the app.conf so the "id" now is "MikroTik3" in stead of "MikroTik" and then tarred it again. Now it imports next to my existing 2.7-dashboard and all seems fine.
Re: Tool: Using Splunk to analyse MikroTik logs 3.0 (Graphing everything)
Posted: Wed Jun 03, 2020 4:22 pm
by Jotne
You can copy all files you have modified to another folder.
Remove all MikroTik files, install 3.0, then restore your files.
Its also possible to use 7-zip/winrar to extract all the files from 3.0 manuall, then add one by one.
If your edit is interesting for other, you could send me them, and I could add it in v3.0
Re: Tool: Using Splunk to analyse MikroTik logs 3.0 (Graphing everything)
Posted: Wed Jun 03, 2020 4:27 pm
by jvanhambelgium
If your edit is interesting for other, you could send me them, and I could add it in v3.0
I only removed some items not applicable for me at all, so no real enhancements.
I'm now using your supplied 3.0 Splunk Dashboard and it looks good enough for me ! I'm going to leave it as-is.
Thanks!
Re: Tool: Using Splunk to analyse MikroTik logs 3.0 (Graphing everything)
Posted: Wed Jun 03, 2020 6:02 pm
by jvanhambelgium
I'm seeing some weird values on in the DHCP-section -> the "DHCP Pool Information" seems to give a faulty % value (eg. 450%)
Looking at the performed query for this :
litsearch (sourcetype=mikrotik module=script script=pool) | eval percent=used*100/total, host_name=coalesce(identity,host) | fields keepcolorder=t "_time" "host" "host_name" "percent" "pool" "total" "used"
There is something wrong with this "total" value. In my case, the pool is a defined /24 in size and almost everything is reserved.
Looking at the Mikrotik script output it only seems to be transmitting following to the Splunk -> script=pool pool=Pool 1 used=45 total=10
# Collect DHCP Pool information
# ----------------------------------
if ($DHCP and $run) do={
/ip pool {
:local poolname
:local pooladdresses
:local poolused
:local minaddress
:local maxaddress
:local findindex
# Iterate through IP Pools
:foreach pool in=[find] do={
:set poolname [get $pool name]
:set pooladdresses 0
:set poolused 0
# Iterate through current pool's IP ranges
:foreach range in=[:toarray [get $pool range]] do={
# Get min and max addresses
:set findindex [:find [:tostr $range] "-"]
:if ([:len $findindex] > 0) do={
:set minaddress [:pick [:tostr $range] 0 $findindex]
:set maxaddress [:pick [:tostr $range] ($findindex + 1) [:len [:tostr $range]]]
} else={
:set minaddress [:tostr $range]
:set maxaddress [:tostr $range]
}
# Calculate number of ip in one range
:set pooladdresses ($maxaddress - $minaddress)
# /foreach range
}
# Test if pools is used in DHCP or VPN and show leases used
:local dname [/ip dhcp-server find where address-pool=$poolname]
:if ([:len $dname] = 0) do={
# No DHCP server found, assume VPN
:set poolused [:len [used find pool=[:tostr $poolname]]]
} else={
# DHCP server found, count leases
:local dname [/ip dhcp-server get [find where address-pool=$poolname] name]
:set poolused [:len [/ip dhcp-server lease find where server=$dname]]}
# Send data
:log info message=("script=pool pool=$poolname used=$poolused total=$pooladdresses")
# /foreach pool
}
# /ip pool
}
}
Re: Tool: Using Splunk to analyse MikroTik logs 3.0 (Graphing everything)
Posted: Wed Jun 03, 2020 8:50 pm
by Jotne
There may be some wrong with that part. Its on part of the script that is not made by me
For me it looks correct
/ip pool print
 # NAME                                                                    RANGES
 0 DHCP-Pool-vlan1-Home                                                    10.10.10.55-10.10.11.254
Then the script shows this:
script,info MikroTik: script=pool pool=DHCP-Pool-vlan1-Home used=158 total=455
Can you post the output of
/ip pool print
Re: Tool: Using Splunk to analyse MikroTik logs 3.0 (Graphing everything)
Posted: Wed Jun 03, 2020 9:39 pm
by jvanhambelgium
OK, I think we hit a special case here
Usually all my systems at home receive a reserved DHCP-entry ("lease"), so my "pool" is actually very small and your script is correct to this extend...
I forgot how small I made it.
The script summarizes ; script=pool pool=Pool 1 used=45
total=10
The pool indeed is actually only 10 IP's big...and the "used" are 45 leases I have statically configured for various devices based on their MAC.
[myuser@gateway] > /ip pool print
# NAME RANGES
0 Pool 1 172.29.45.190-172.29.45.200
[myuser@gateway] >
Then I think the Splunk logic needs to be addressed somewhat? The "used" in my case are not really a part of the start-stop range of the pool.
Splunk seems a bit confused perhaps with "45" used on a total of "10" ?
EDIT : I always believed I had to craft my pool "outside" the range I configure "static" for device. (which is > 90% of them). But apparently I can simply make my pool a real /24 (eg 192.168.1.2 -> 192.168.1.253 and the *.254 would be Mikrotik) and even in that space IP's that I configured "static" for certains MAC's would not be handed out. So perhaps the way I configured the DHCP is not really according to the way it should be) => Let me try to fix that by changing my pool first and test again...
EDIT2 : Yep it fixed it. I already experimented in Splunk by changing the "divider" [total] with a fixed value of 254 and then percentage indeed became more realistic (eg. 16%). So yeah, I will leave my pool configured as it probably should ,the whole /24 minus the gateway-IP.
Sorry to waste your time over this!
Re: Tool: Using Splunk to analyse MikroTik logs 3.0 (Graphing everything)
Posted: Wed Jun 03, 2020 10:01 pm
by Jotne
Interesting. I see this is a way you can handle DHCP, and it will confuse the system.
Its not easy to take inn to account every possibility.
In my work (20000 + computers 2500+ servers), we have only DHCP, and all server IP are within the DHCP scope. But we to convert DHCP leases to static for all that needs fixed IP. We found that this way will give less work for the team working with IP.
Will have a look at it, but not sure if its possible to solve. How to see if an reserved IP is within the DHCP scope or not?
[:len [/ip dhcp-server lease find where server=$dname]]
This part gets all lease the DHCP server and does not care where in the range they are.
Re: Tool: Using Splunk to analyse MikroTik logs 3.0 (Graphing everything)
Posted: Wed Jun 03, 2020 10:11 pm
by jvanhambelgium
In case you missed my edits ;
I always believed I had to craft my pool "outside" the range I configure "static" for device. (which is > 90% of them). But apparently I can simply make my pool a real /24 (eg 192.168.1.2 -> 192.168.1.253 and the *.254 would be Mikrotik) and even in that space IP's that I configured "static" for certains MAC's would not be handed out. So perhaps the way I configured the DHCP is not really according to the way it should be) => Let me try to fix that by changing my pool first and test again...
....Yep it fixed it. I already experimented in Splunk by changing the "divider" [total] with a fixed value of 254 and then percentage indeed became more realistic (eg. 16%). So yeah, I will leave my pool configured as it probably should ,the whole /24 minus the gateway-IP.
Sorry to waste your time over this!
Re: Tool: Using Splunk to analyse MikroTik logs 3.0 (Graphing everything)
Posted: Wed Jun 03, 2020 10:15 pm
by Jotne
Sorry to waste your time over this!
No problem. You have not done anything wrong, just in another way.
I will add a comment about in the DHCP view, that if you add static release outside the pool,but within the subnet, i will give wrong number.
Re: Tool: Using Splunk to analyse MikroTik logs 3.0 (Graphing everything)
Posted: Thu Jun 04, 2020 8:24 am
by Jotne
Script updated to 4.0
Removed double stuff
Added write-sector-total
PS script can be updated without update Splunk software.
Here is an example view on write sector increase last 10 hour that will be included in Splunk for MikroTik 3.1
* 10.10.10.1 hEX 6.45.9 (will have a look at this after upgrade to 6.47, but will wait for at least 6.47.1
* 10.10.10.140 VmWare x86 6.47
* 10.10.10.153 VmWare x86 7.0Beta5
sector.jpg
Re: Tool: Using Splunk to analyse MikroTik logs 3.0 (Graphing everything)
Posted: Mon Jun 08, 2020 9:01 pm
by anwarkollam
I am facing issue. Spkunk stop logging after a while (around 1 - 2 hours). I tried with ubuntu and windows. Re installed so many times. Issue not solved yet. monitor will start, if i restart splunk service. So i schedule a cron job on ubuntu to restart splunk service every 30 min. Is there any other option to stable service? I have installed Ubuntu 16.04 on Vaphere 5.5.
Re: Tool: Using Splunk to analyse MikroTik logs 3.0 (Graphing everything)
Posted: Sun Jun 14, 2020 1:08 pm
by mger
tried 3.0 version with hAP ac2 mikrotik, routeros 6.47 , splunk enterperise v.8.0.4.1 on windows 10 v.2004
i don't get it why MikroTik DNS request shows only my my main computer's dns requests which are generated by services itself: nvidia,windows updates., teamviewer.,sharepoint,onedrive and nothing more what i search through web with my computer or mobile phone which are on the same network,
DNS Servers on my windows machine /
8.8.8.8
192.168.0.1 router dns
1.1.1.1
am i correct, computer must use only router's local DNS server or what?
EDIT: when i set only router's dns server it seems it now logs all websites i visit.
also mikrotik uptime always show "1" and only one dot..and volt/temperatures module no data is showing.
Re: Tool: Using Splunk to analyse MikroTik logs 3.0 (Graphing everything)
Posted: Thu Jun 18, 2020 12:19 pm
by Jotne
To see DNS loogs, your router needs to be the one and only DNS server.
Up time 1 is one day so it show 1. It also takes time (days) to get graphs for up time, so have a look after some days
Re: Tool: Using Splunk to analyse MikroTik logs 3.0 (Graphing everything)
Posted: Thu Jun 18, 2020 6:43 pm
by jvanhambelgium
Did you ever considered extending your (already) very nice dashboard(s) with some NETFLOW information to gain more insights in the traffic + protocol distribution.
(bit like the "accounting" section on your dashboard, but with more info)
I'm currently playing around with the PMACCT-packages and writing out some CSV-style files. (other formats possible too like json)
I'm absolutely no Splunk expert, but I'm going to try to add such CSV (as test) to my splunk and visualize something from it.
Re: Tool: Using Splunk to analyse MikroTik logs 3.0 (Graphing everything)
Posted: Fri Jun 19, 2020 12:20 am
by Jotne
I'm currently playing around with the PMACCT-packages and writing out some CSV-style files. (other formats possible too like json)
This is interesting. CSV is perfect, and better than json since its smaller.
Splunk app do show traffic accounting using the accounting on the Router it self and sends it using syslog.
Problem with neflow is that it can not be sent with the Syslog packages, so we need to add a new port to listen to, not just one.
MT has decided to remove accounting on the router. Removed in v7 Beta 8
Re: Tool: Using Splunk to analyse MikroTik logs 3.0 (Graphing everything)
Posted: Fri Jun 19, 2020 9:33 pm
by jvanhambelgium
Do you have experience with the "Splunk Stream" (app) ??
https://splunkbase.splunk.com/app/1809/
This could natively ingest & decode Netflow
""Capture Flow-type records, including NetFlow v5, v9, jFlow, and sFlow, and IPFIX, and send Flow Records directly into your Indexers, with optional filtering and aggregation.""
https://maddosaurus.github.io/2018/05/2 ... d-netflows
Sorry to pollute your Splunk topic with this.
Re: Tool: Using Splunk to analyse MikroTik logs 3.0 (Graphing everything)
Posted: Sun Jun 21, 2020 3:45 pm
by colin
Oh my god, why didn't I discover it until now. It's exactly what i want. Thank you so much.
Re: Tool: Using Splunk to analyse MikroTik logs 3.0 (Graphing everything)
Posted: Sun Jun 21, 2020 4:43 pm
by Jotne
Have not had time to look at much yet, but it look possible som complicated to set up. It have to much possibility, not sure of saved format is ok.
I would like a small program that listen for netflow and save them one line at a time. Then Splunk can index it.
System we have to day with just sending accounting data using syslog with rest of the data works quick and easy and no need for extra port etc.
But I will investigate it and see if its the road to go.
Re: Tool: Using Splunk to analyse MikroTik logs 3.0 (Graphing everything)
Posted: Sun Jun 21, 2020 6:13 pm
by jvanhambelgium
Have not had time to look at much yet, but it look possible som complicated to set up. It have to much possibility, not sure of saved format is ok.
I would like a small program that listen for netflow and save them one line at a time. Then Splunk can index it.
System we have to day with just sending accounting data using syslog with rest of the data works quick and easy and no need for extra port etc.
But I will investigate it and see if its the road to go.
Should be pretty straightforward but it depends a bit on what we want to achieve. Let's say for Netflow v9, Splunk created following ready-to-use fields.
I had installed the "app" from a (zip) archive that I downloaded and then needed to edit 2 config-files and make sure the "netflow" was enabled in the GUI config-part on your Splunk. The dashboard that come with the app for some reason do not handle "netflow" well and produce no usable results or give "no data"
If you really want a separate binary I think the PMACCT "packages", including the "nfacctd" (Netflow Accounting deamon" is a very solid one. With that you can produce CSV's and format what fields you want in there. But then you need to get these files also to your Splunk.
bytes_in: 3979
dest_ip: 172.217.168.206
dest_mac: 6c:3b:6b:20:22:b6
dest_mask: 0
dest_port: 443
endtime: 2020-06-21T14:54:04.840000Z
event_name: netFlowData
exporter_ip: 172.29.45.254
exporter_time: 2020-Jun-21 14:55:06
exporter_uptime: 811908030
flow_end_rel: 811846870
flow_start_rel: 811802820
input_snmpidx: 15
netflow_version: 9
nexthop_addr: 172.217.168.206
observation_domain_id: 0
output_snmpidx: 14
packets_in: 8
post_src_mac: 00:00:00:00:00:00
protoid: 17
seqnumber: 21718
src_ip: 172.29.45.4
src_mac: d0:50:99:84:01:36
src_mask: 0
src_port: 42751
tcp_flags: 0
timestamp: 2020-06-21T14:53:20.790000Z
tos: 0
I think the challenge is more
1) Getting & grouping results all together in a certain time-window so you can accurately calculate howmuch traffic was done per 1minute or 5minutes or so.
2) Depending on the amount of interfaces you collect Netflow from (eg. "all" Mikrotik interfaces vs only your PPPoE "Internet" interface) it might become confusing what flow is related to what direction. I've seen flows with a "dest_ip" of my WAN-IP (eg. DNS replies coming backup from Cloudflare or something) so they are part of a NAT transaction.
Like below, the dest_ip is my WAN and the field "nexthop_addr" (value 172.29.45.7) is effectively a PC on my LAN.
So I can image things get hairy if not counted correctly etc.
bytes_in: 88
dest_ip: 91.119.127.160
dest_mac: 00:00:00:00:00:00
dest_mask: 0
dest_port: 46924
endtime: 2020-06-21T15:04:23.570000Z
event_name: netFlowData
exporter_ip: 172.29.45.254
exporter_time: 2020-Jun-21 15:05:25
exporter_uptime: 812527030
flow_end_rel: 812465600
flow_start_rel: 812465600
input_snmpidx: 14
netflow_version: 9
nexthop_addr: 172.29.45.7
observation_domain_id: 0
output_snmpidx: 15
packets_in: 1
post_src_mac: 6c:3b:6b:20:22:b6
protoid: 6
seqnumber: 21863
src_ip: 13.59.106.231
src_mac: 20:e0:9c:6b:71:43
src_mask: 0
src_port: 30999
tcp_flags: 146
timestamp: 2020-06-21T15:04:23.570000Z
tos: 0
Re: Tool: Using Splunk to analyse MikroTik logs 3.0 (Graphing everything)
Posted: Sun Jun 21, 2020 7:30 pm
by Jotne
I got it up and running. Some more complicated when Splunk do not run as an admin (what I do recommend to do).
Not sure why there are so many low number on source port like 443. That is normal destination port. Will examine it, make a SPL search that graph it and post it here.
Re: Tool: Using Splunk to analyse MikroTik logs 3.0 (Graphing everything)
Posted: Sun Jun 21, 2020 8:46 pm
by jvanhambelgium
In the meantime I searched some already existing dashboards and got some hits on Github.
I adapted the XML since my netflow is not sitting in the main-index and some of the names of the fields where different. etc.etc
However , there are some issues.
In 1 of these dashboard the field "bytes_out" is used which seems not existing in the Mikrotik v9 template. Only "bytes_in" exist.
I guess we need to adapt the logic to clearly identify what is "out" and what is "in" (a bit like Jotne did on his current syslog-based accounting dashboard)
It seems traffic directed at your WAN-IP (so dest_ip = WAN) seems to have in the field nexthop_addr: container the inside address. I guess this traffic is part of the NAT-session so these bytes need to be counted also.
Also the dashboard with white backdrop has no selectors and seem "statically" set (eg. past 60min) without dropdown menus.
So yeah ... still some work I think but ...
For the fancy visualization in the first screen on the bottom, you might need to install an app ->
https://splunkbase.splunk.com/app/3767/
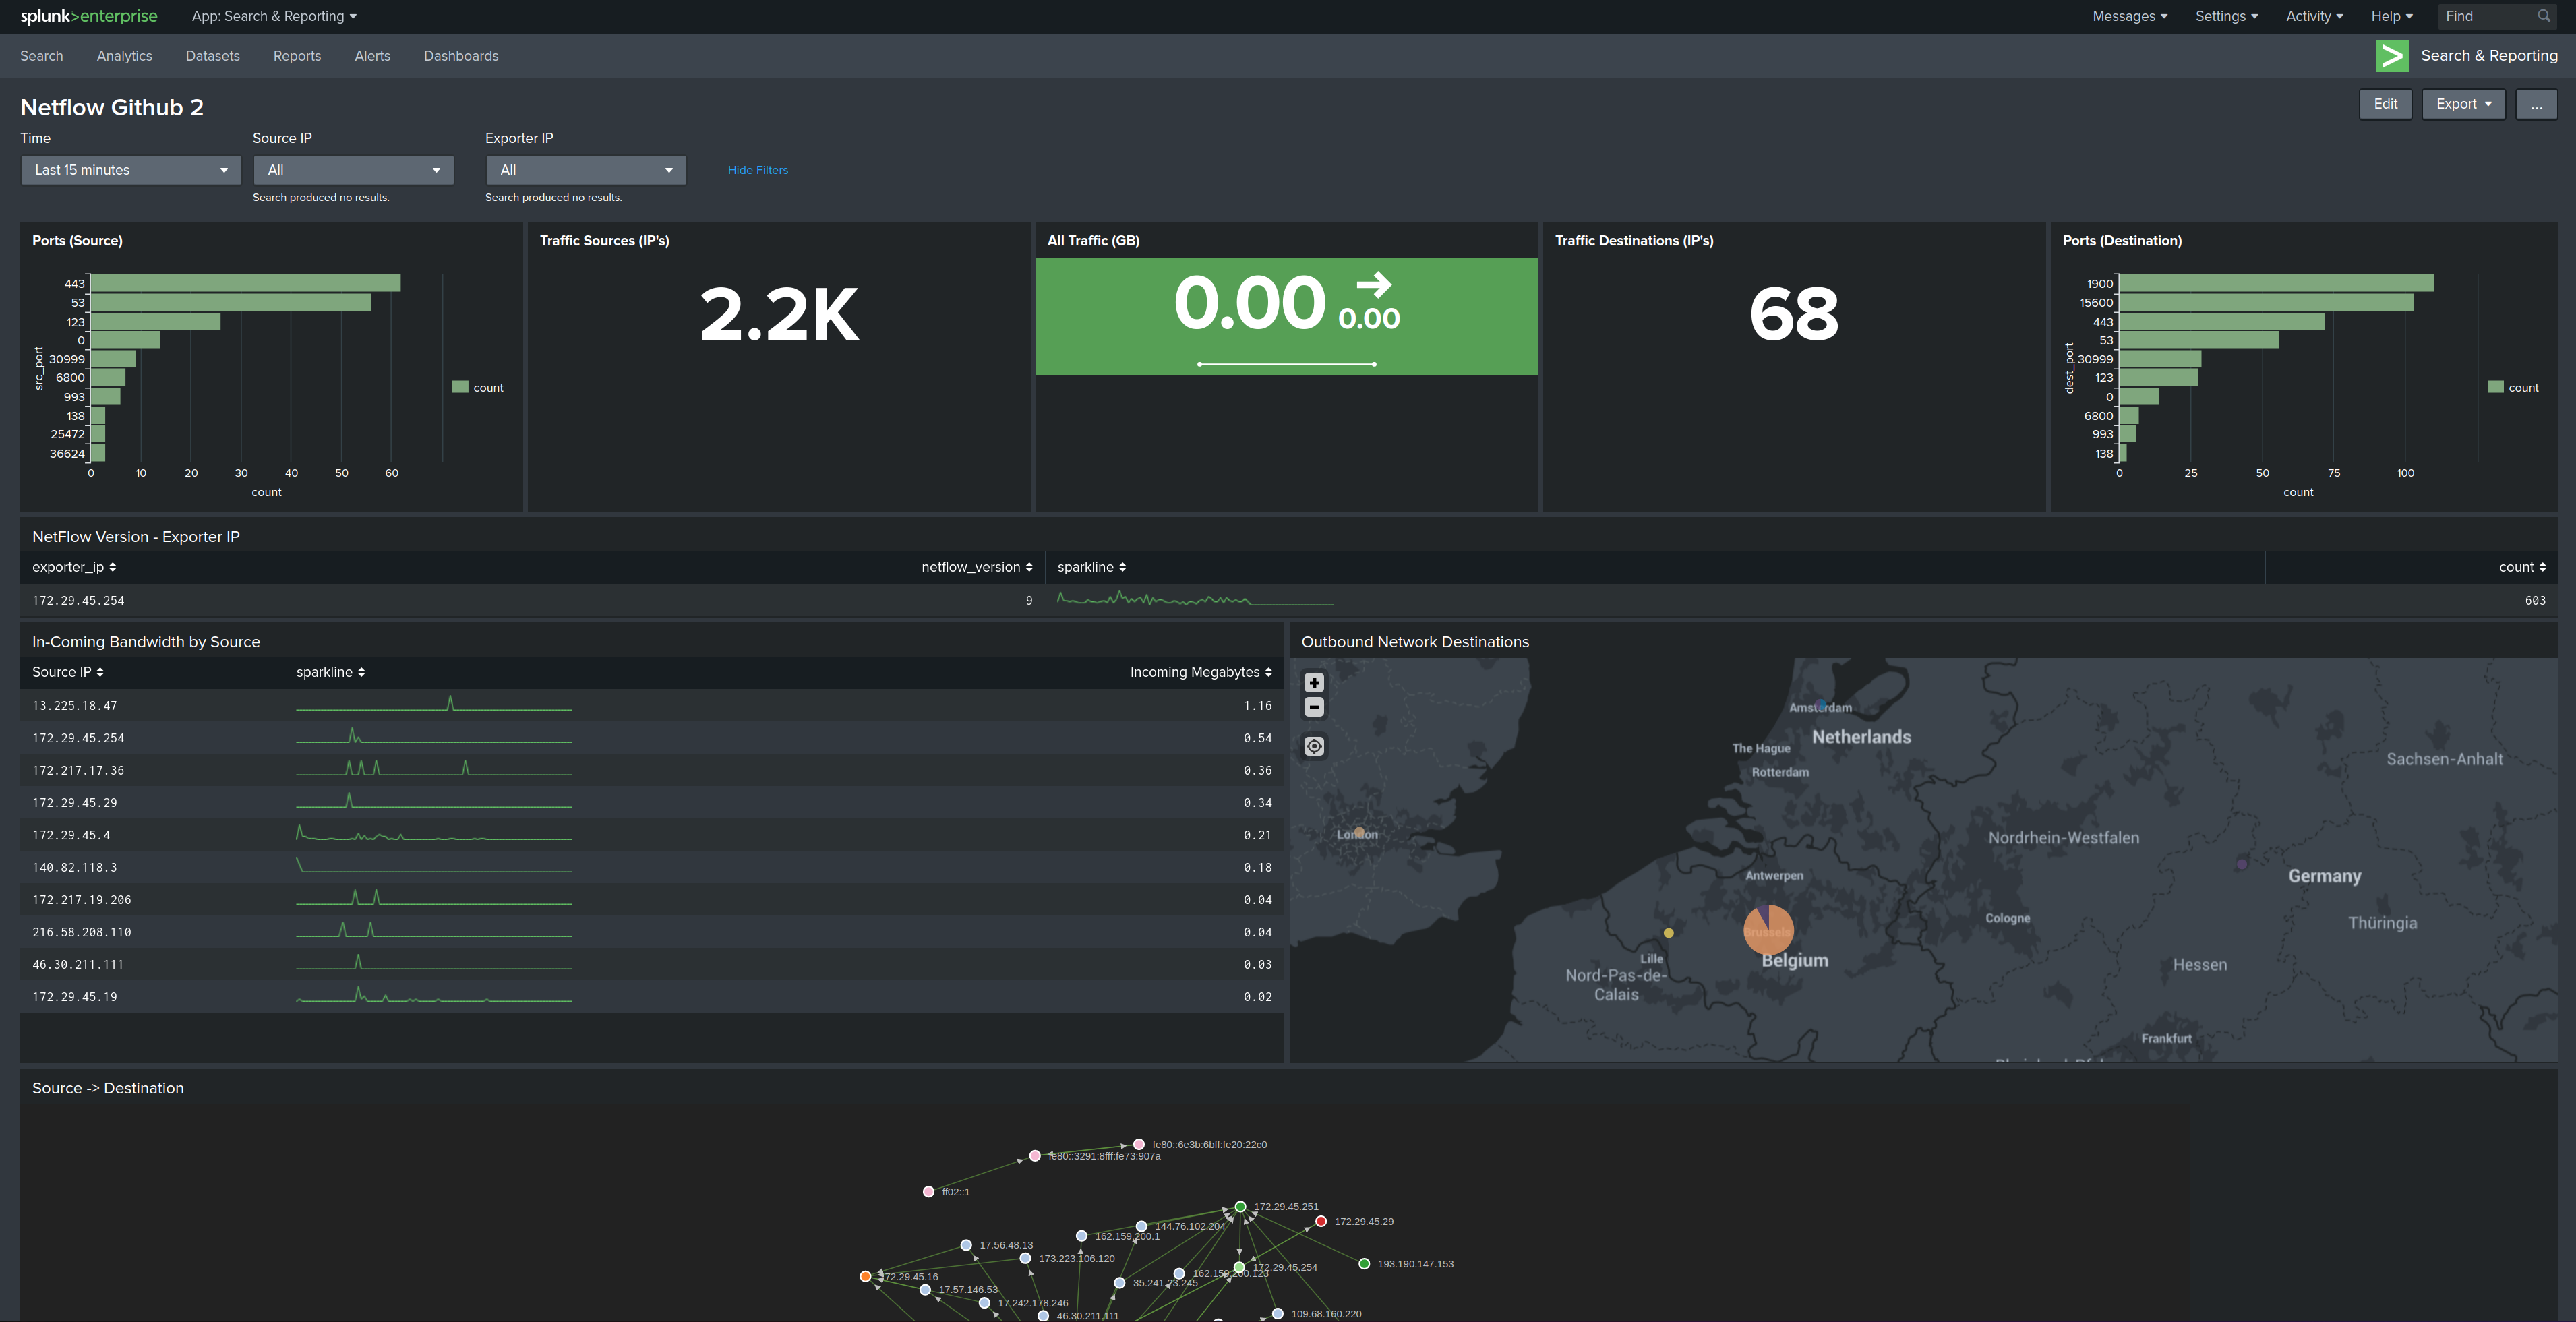
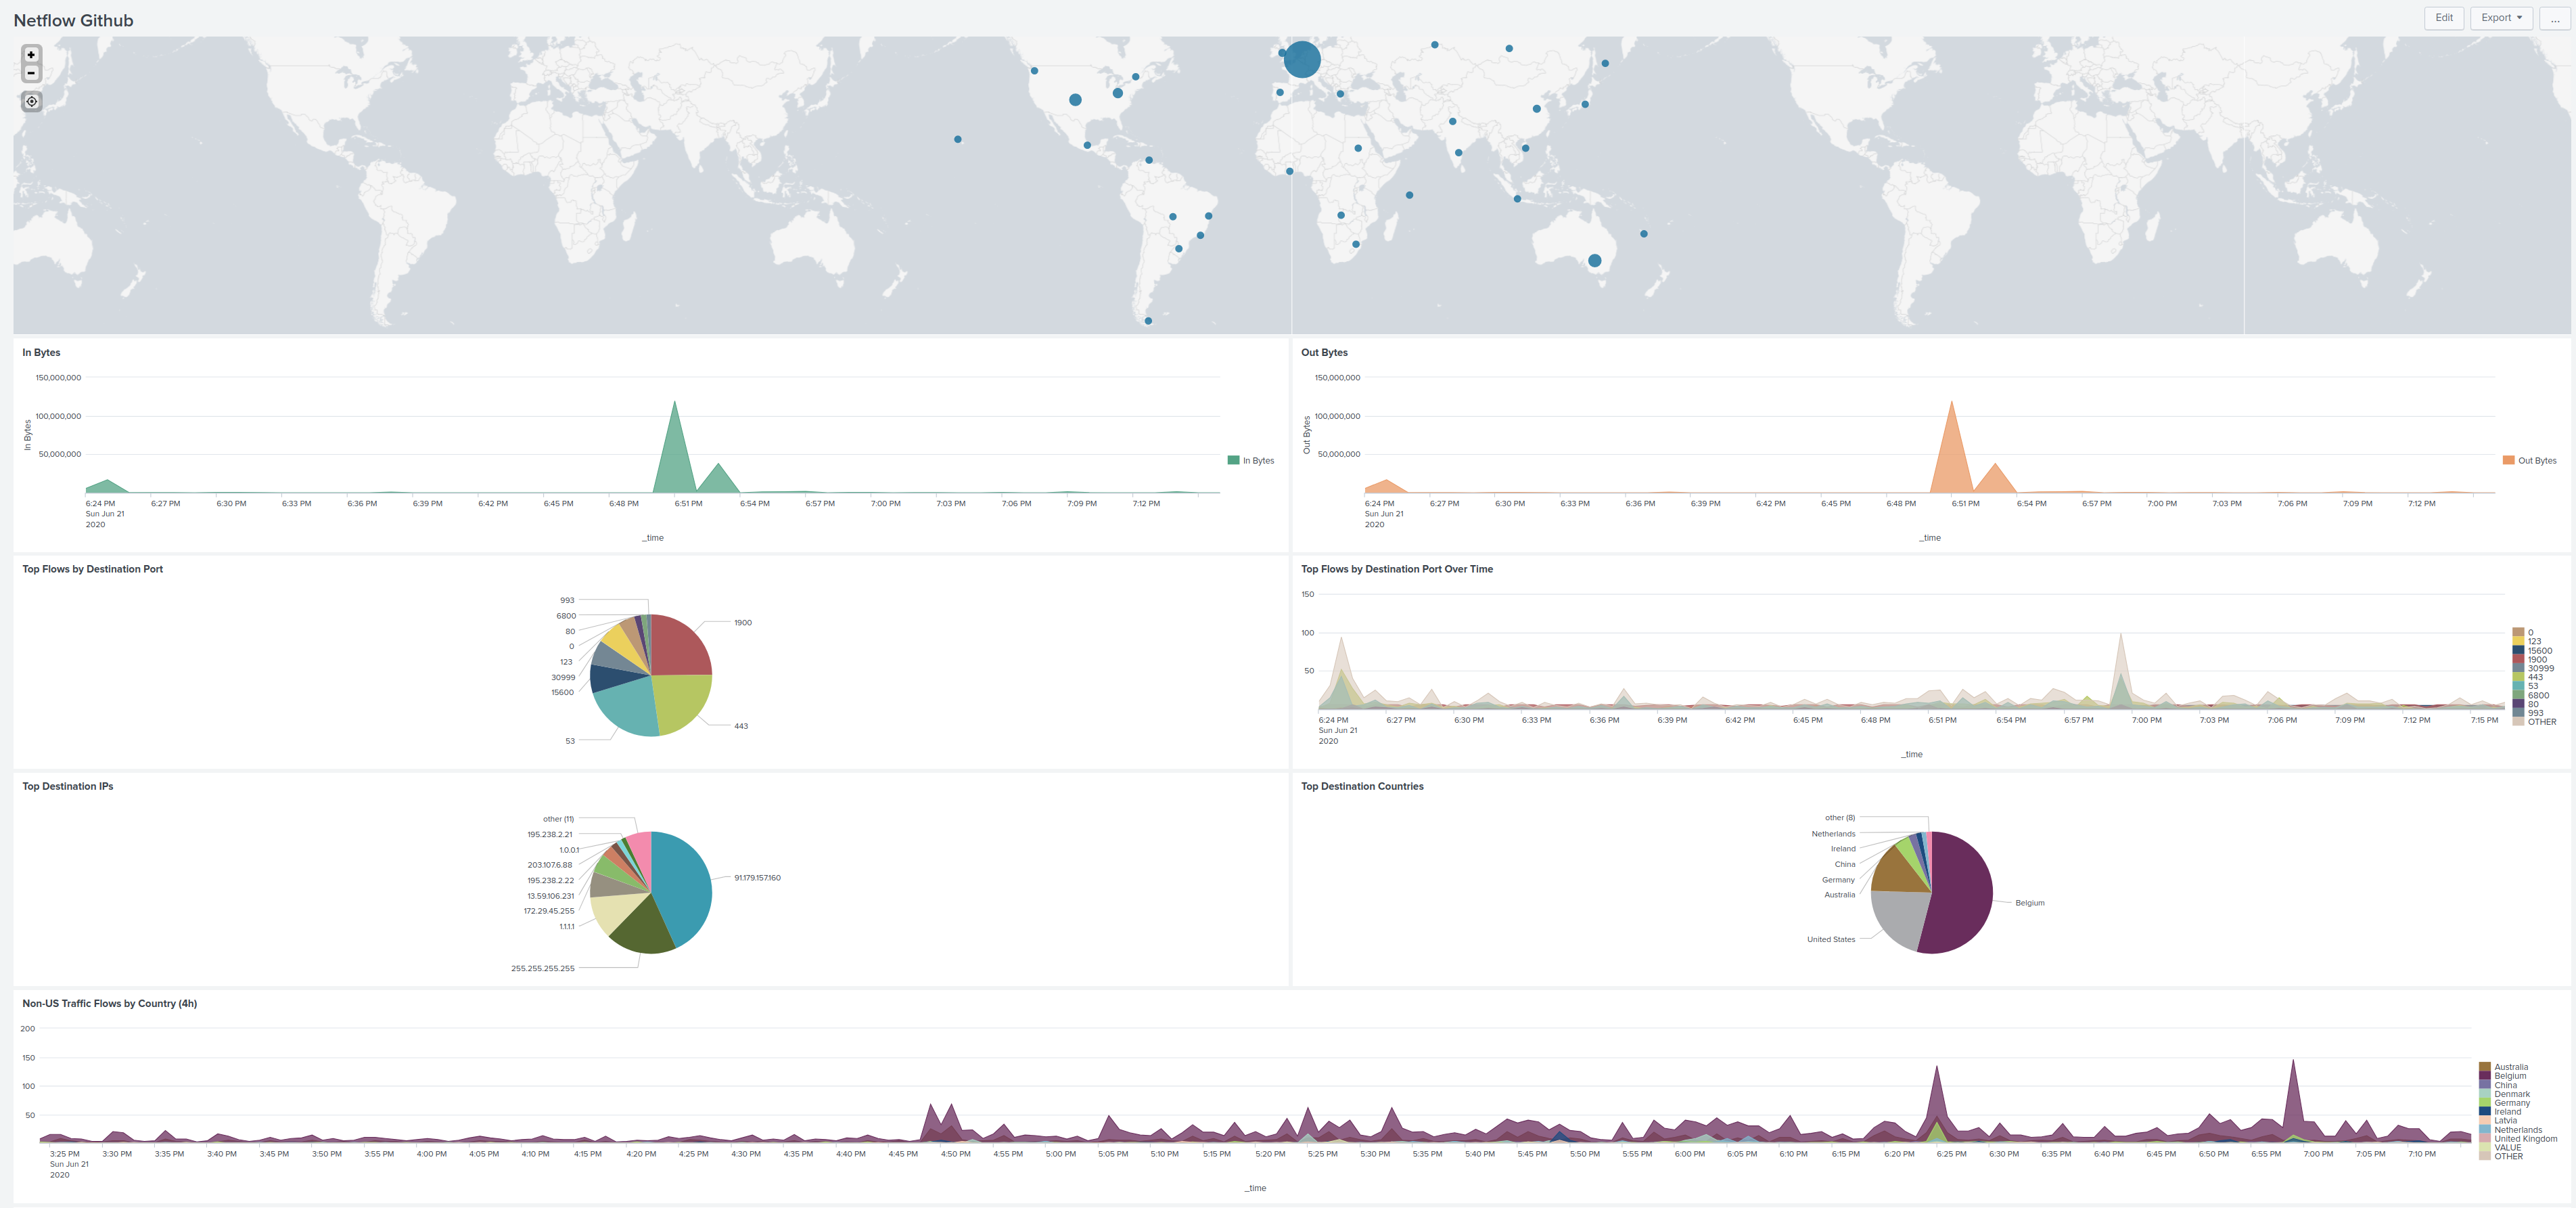
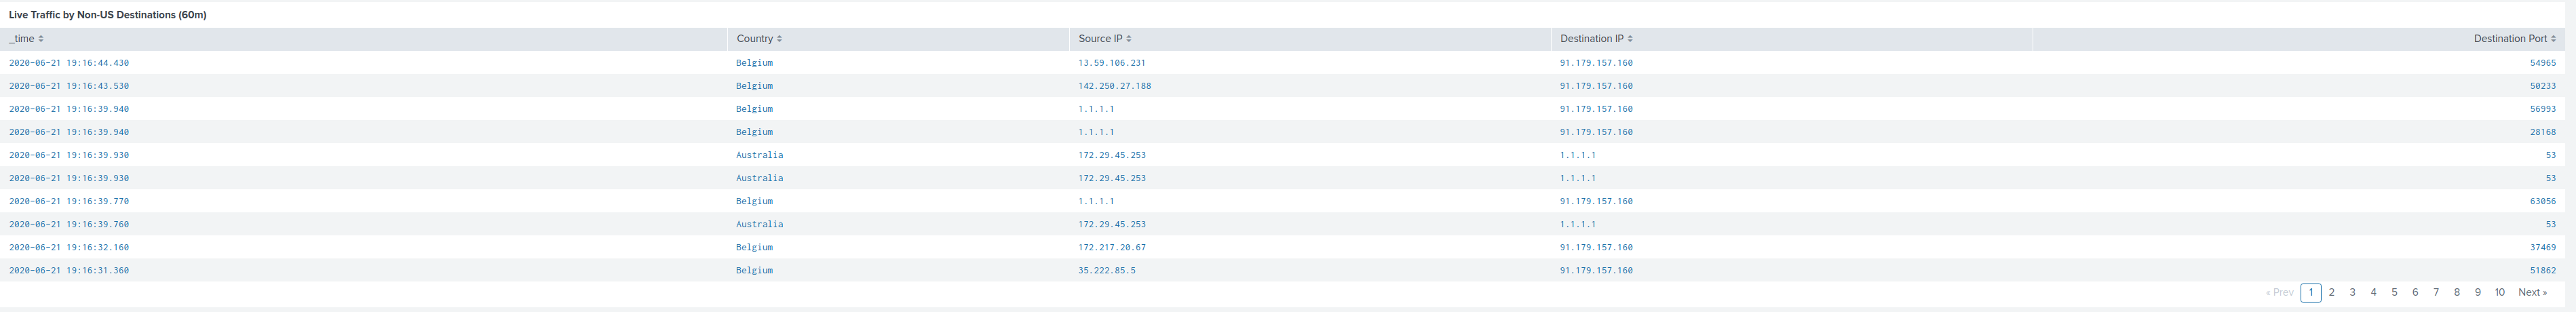
Re: Tool: Using Splunk to analyse MikroTik logs 3.0 (Graphing everything)
Posted: Sun Jun 21, 2020 9:08 pm
by jvanhambelgium
For anyone that wants to give a crack at it, see below the links to the XML templates that make up these dashboards in Splunk.
http://vanham-franck.be/pics/splunk/spl ... plate1.xml
http://vanham-franck.be/pics/splunk/spl ... plate2.xml
PS : Perhaps now is good time to file another bug with Mikrotik on the Netflow IPFIX which is not really OK.
With Splunk, I simply seem unable to ingest it (Stream App does support it)
However, back when I was testing last week with "pmacct" / "nfacctd" it turned out the Mikrotik has some timing-fields not present/incorrect so all my flow have a START but they all have 1970-Epoch as END
Example below of CSV-capture, the TIMESTAMP_END is always 1970-01-01 ... yeah ... not really usefull...
SRC_IP,DST_IP,SRC_PORT,DST_PORT,PROTOCOL,TIMESTAMP_START,TIMESTAMP_END,PACKETS,BYTES
172.29.45.250,176.9.168.180,38310,232,tcp,2020-06-19 12:12:58.000000,1970-01-01 01:00:00.000000,3,208
176.9.168.180,91.179.157.160,232,38310,tcp,2020-06-19 12:12:58.000000,1970-01-01 01:00:00.000000,2,208
172.29.45.249,216.58.214.3,36286,443,tcp,2020-06-19 12:12:58.000000,1970-01-01 01:00:00.000000,2,178
216.58.214.3,91.179.157.160,443,36286,tcp,2020-06-19 12:12:58.000000,1970-01-01 01:00:00.000000,3,231
13.59.106.231,91.179.157.160,30999,46463,tcp,2020-06-19 12:13:01.000000,1970-01-01 01:00:00.000000,1,60
172.29.45.199,195.238.28.228,56639,443,tcp,2020-06-19 12:13:01.000000,1970-01-01 01:00:00.000000,7,2918
Re: Tool: Using Splunk to analyse MikroTik logs 3.0 (Graphing everything)
Posted: Sun Jun 21, 2020 9:41 pm
by Jotne
Maybe this should be an add on module for the MikroTik app since it would involve lots of extra stuff.
Using wan IP as a trigger is not good enough, since this will change for many user and then you need to have some sort of auto update.
But after looking at
input_snmpidx and
output_snmpidx (input/output SNMP interface index) we may have a solution on how this works.
input_snmpidx=2 output_snmpidx=1 Traffic going from inside to outside host
input_snmpidx=1 output_snmpidx=2 Traffic returning from outside host
input_snmpidx=2 output_snmpidx=2 Traffic going from inside oust to inside server using hairpin nat
This may be wrong, but I think I am no correct track.
I did tested the dashboard from git and they work fine. But I think they also mix whats source and destination port. I can see that 443 is top on both source port and dest post, they are part of returning packets when your request that it will go back to the same port.
in bytes og out bytes shows the same data, just renamed name
Re: Tool: Using Splunk to analyse MikroTik logs 3.0 (Graphing everything)
Posted: Sun Jun 21, 2020 11:36 pm
by jvanhambelgium
in bytes og out bytes shows the same data, just renamed name
On the dashboard/XML I posted ?
Because I did that, since there is no "bytes_out" I simply put for temporary the same "bytes_in" also
So indeed solid grouping must be done to clearly identify what is IN en what is OUT.
Also some filtering you did in your syslog-based dashboard, to exclude RFC1918 IP-space from when making some top-10 of public destinations etc.
Re: Tool: Using Splunk to analyse MikroTik logs 3.0 (Graphing everything)
Posted: Mon Jun 22, 2020 12:08 am
by Jotne
I will look at it. Should be doable to separate input/output like I did no the accounting dashboard. Maybe by looking at public/private net.
Re: Tool: Using Splunk to analyse MikroTik logs 3.0 (Graphing everything)
Posted: Mon Jun 22, 2020 12:13 am
by jvanhambelgium
Maybe this should be an add on module for the MikroTik app since it would involve lots of extra stuff.
Using wan IP as a trigger is not good enough, since this will change for many user and then you need to have some sort of auto update.
But after looking at
input_snmpidx and
output_snmpidx (input/output SNMP interface index) we may have a solution on how this works.
input_snmpidx=2 output_snmpidx=1 Traffic going from inside to outside host
input_snmpidx=1 output_snmpidx=2 Traffic returning from outside host
input_snmpidx=2 output_snmpidx=2 Traffic going from inside oust to inside server using hairpin nat
This may be wrong, but I think I am no correct track.
I did tested the dashboard from git and they work fine. But I think they also mix whats source and destination port. I can see that 443 is top on both source port and dest post, they are part of returning packets when your request that it will go back to the same port.
in bytes og out bytes shows the same data, just renamed name
Good analysis. I think that is correct. I'm now testing with hairpin-NAT session and indeed input_snmpidx = output_snmpidx (in my case value of 15) which is my "WAN" with public IP
Now everybody will have different values so I'm not sure how you would abstract this.
I've also found some output_snmpidx=0 values and they seem ALL "Broadcast" traffic, either destination_ip = 255.255.255.255 of my subnet_broascast X.Y.Z.255 at least for the OUTPUT_snmpidx=0 becasue for the INPUT_snmpidx=0 (I also have it) no broadcasts there.
All a bit odd for the moment.
I've also opened a ticket to start the IPFIX discussion again. I want to find out if the RouterOS IPFIX implementation is buggy in the timestamp-area.
For the moment I had no luck that Splunk/Stream-app would ingest this, might need to look at it again but the config docs say no difference exist between configurating it for v5/v9 or ipfix, for both the "netflow" stream should simply be enabled.
Re: Tool: Using Splunk to analyse MikroTik logs 3.0 (Graphing everything)
Posted: Mon Jun 22, 2020 9:05 am
by Jotne
Some more investigation. Snmpidx are the interfaces on the router.
You can get it using SNMP like this:
snmpwalk -v2C -c public 10.10.10.1  ifname
IF-MIB::ifName.1 = STRING: ether1
IF-MIB::ifName.2 = STRING: Bridge1
IF-MIB::ifName.3 = STRING: ether3
IF-MIB::ifName.4 = STRING: ether4
IF-MIB::ifName.5 = STRING: ether5
IF-MIB::ifName.6 = STRING: pptp-in1
IF-MIB::ifName.8 = STRING: ether2
IF-MIB::ifName.12 = STRING: VLAN20
You can also get it using:
/interface print
Flags: D - dynamic, X - disabled, R - running, S - slave
# NAME TYPE ACTUAL-MTU L2MTU MAX-L2MTU MAC-ADDRESS
0 R ;;; WAN
ether1 ether 1500 1596 2026 6C:3B:6B:88:34:3E
1 RS ;;; Cisco C3560CX
ether2 ether 1500 1596 2026 6C:3B:6B:88:34:3F
2 S ;;; Test VLAN 20
ether3 ether 1500 1596 2026 6C:3B:6B:88:34:40
3 RS ;;; Windows server
ether4 ether 1500 1596 2026 6C:3B:6B:88:34:41
4 RS ;;; Linux server
ether5 ether 1500 1596 2026 6C:3B:6B:88:34:42
5 R ;;; Main Bridge
Bridge1 bridge 1500 1596 6C:3B:6B:88:34:3F
6 R ;;; Sokkel
VLAN20 vlan 1500 1592 6C:3B:6B:88:34:3F
7 pptp-in1 pptp-in
[xxxx] > /interface print oid
Flags: D - dynamic, X - disabled, R - running, S - slave
0 R ;;; WAN
name=.1.3.6.1.2.1.2.2.1.2.1 actual-mtu=.1.3.6.1.2.1.2.2.1.4.1 mac-address=.1.3.6.1.2.1.2.2.1.6.1 admin-status=.1.3.6.1.2.1.2.2.1.7.1 oper-status=.1.3.6.1.2.1.2.2.1.8.1 bytes-in=.1.3.6.1.2.1.31.1.1.1.6.1
packets-in=.1.3.6.1.2.1.31.1.1.1.7.1 discards-in=.1.3.6.1.2.1.2.2.1.13.1 errors-in=.1.3.6.1.2.1.2.2.1.14.1 bytes-out=.1.3.6.1.2.1.31.1.1.1.10.1 packets-out=.1.3.6.1.2.1.31.1.1.1.11.1
discards-out=.1.3.6.1.2.1.2.2.1.19.1 errors-out=.1.3.6.1.2.1.2.2.1.20.1
1 RS ;;; Cisco C3560CX
name=.1.3.6.1.2.1.2.2.1.2.8 actual-mtu=.1.3.6.1.2.1.2.2.1.4.8 mac-address=.1.3.6.1.2.1.2.2.1.6.8 admin-status=.1.3.6.1.2.1.2.2.1.7.8 oper-status=.1.3.6.1.2.1.2.2.1.8.8 bytes-in=.1.3.6.1.2.1.31.1.1.1.6.8
packets-in=.1.3.6.1.2.1.31.1.1.1.7.8 discards-in=.1.3.6.1.2.1.2.2.1.13.8 errors-in=.1.3.6.1.2.1.2.2.1.14.8 bytes-out=.1.3.6.1.2.1.31.1.1.1.10.8 packets-out=.1.3.6.1.2.1.31.1.1.1.11.8
discards-out=.1.3.6.1.2.1.2.2.1.19.8 errors-out=.1.3.6.1.2.1.2.2.1.20.8
2 S ;;; Test VLAN 20
name=.1.3.6.1.2.1.2.2.1.2.3 actual-mtu=.1.3.6.1.2.1.2.2.1.4.3 mac-address=.1.3.6.1.2.1.2.2.1.6.3 admin-status=.1.3.6.1.2.1.2.2.1.7.3 oper-status=.1.3.6.1.2.1.2.2.1.8.3 bytes-in=.1.3.6.1.2.1.31.1.1.1.6.3
packets-in=.1.3.6.1.2.1.31.1.1.1.7.3 discards-in=.1.3.6.1.2.1.2.2.1.13.3 errors-in=.1.3.6.1.2.1.2.2.1.14.3 bytes-out=.1.3.6.1.2.1.31.1.1.1.10.3 packets-out=.1.3.6.1.2.1.31.1.1.1.11.3
discards-out=.1.3.6.1.2.1.2.2.1.19.3 errors-out=.1.3.6.1.2.1.2.2.1.20.3
3 RS ;;; Balder Windows server
name=.1.3.6.1.2.1.2.2.1.2.4 actual-mtu=.1.3.6.1.2.1.2.2.1.4.4 mac-address=.1.3.6.1.2.1.2.2.1.6.4 admin-status=.1.3.6.1.2.1.2.2.1.7.4 oper-status=.1.3.6.1.2.1.2.2.1.8.4 bytes-in=.1.3.6.1.2.1.31.1.1.1.6.4
packets-in=.1.3.6.1.2.1.31.1.1.1.7.4 discards-in=.1.3.6.1.2.1.2.2.1.13.4 errors-in=.1.3.6.1.2.1.2.2.1.14.4 bytes-out=.1.3.6.1.2.1.31.1.1.1.10.4 packets-out=.1.3.6.1.2.1.31.1.1.1.11.4
discards-out=.1.3.6.1.2.1.2.2.1.19.4 errors-out=.1.3.6.1.2.1.2.2.1.20.4
4 RS ;;; Varg Linux server
name=.1.3.6.1.2.1.2.2.1.2.5 actual-mtu=.1.3.6.1.2.1.2.2.1.4.5 mac-address=.1.3.6.1.2.1.2.2.1.6.5 admin-status=.1.3.6.1.2.1.2.2.1.7.5 oper-status=.1.3.6.1.2.1.2.2.1.8.5 bytes-in=.1.3.6.1.2.1.31.1.1.1.6.5
packets-in=.1.3.6.1.2.1.31.1.1.1.7.5 discards-in=.1.3.6.1.2.1.2.2.1.13.5 errors-in=.1.3.6.1.2.1.2.2.1.14.5 bytes-out=.1.3.6.1.2.1.31.1.1.1.10.5 packets-out=.1.3.6.1.2.1.31.1.1.1.11.5
discards-out=.1.3.6.1.2.1.2.2.1.19.5 errors-out=.1.3.6.1.2.1.2.2.1.20.5
5 R ;;; Main Bridge
name=.1.3.6.1.2.1.2.2.1.2.2 actual-mtu=.1.3.6.1.2.1.2.2.1.4.2 mac-address=.1.3.6.1.2.1.2.2.1.6.2 admin-status=.1.3.6.1.2.1.2.2.1.7.2 oper-status=.1.3.6.1.2.1.2.2.1.8.2 bytes-in=.1.3.6.1.2.1.31.1.1.1.6.2
packets-in=.1.3.6.1.2.1.31.1.1.1.7.2 discards-in=.1.3.6.1.2.1.2.2.1.13.2 errors-in=.1.3.6.1.2.1.2.2.1.14.2 bytes-out=.1.3.6.1.2.1.31.1.1.1.10.2 packets-out=.1.3.6.1.2.1.31.1.1.1.11.2
discards-out=.1.3.6.1.2.1.2.2.1.19.2 errors-out=.1.3.6.1.2.1.2.2.1.20.2
6 R ;;; Sokkel
name=.1.3.6.1.2.1.2.2.1.2.12 actual-mtu=.1.3.6.1.2.1.2.2.1.4.12 mac-address=.1.3.6.1.2.1.2.2.1.6.12 admin-status=.1.3.6.1.2.1.2.2.1.7.12 oper-status=.1.3.6.1.2.1.2.2.1.8.12
bytes-in=.1.3.6.1.2.1.31.1.1.1.6.12 packets-in=.1.3.6.1.2.1.31.1.1.1.7.12 discards-in=.1.3.6.1.2.1.2.2.1.13.12 errors-in=.1.3.6.1.2.1.2.2.1.14.12 bytes-out=.1.3.6.1.2.1.31.1.1.1.10.12
packets-out=.1.3.6.1.2.1.31.1.1.1.11.12 discards-out=.1.3.6.1.2.1.2.2.1.19.12 errors-out=.1.3.6.1.2.1.2.2.1.20.12
7 name=.1.3.6.1.2.1.2.2.1.2.6 actual-mtu=.1.3.6.1.2.1.2.2.1.4.6 mac-address=.1.3.6.1.2.1.2.2.1.6.6 admin-status=.1.3.6.1.2.1.2.2.1.7.6 oper-status=.1.3.6.1.2.1.2.2.1.8.6 bytes-in=.1.3.6.1.2.1.31.1.1.1.6.6
packets-in=.1.3.6.1.2.1.31.1.1.1.7.6 discards-in=.1.3.6.1.2.1.2.2.1.13.6 errors-in=.1.3.6.1.2.1.2.2.1.14.6 bytes-out=.1.3.6.1.2.1.31.1.1.1.10.6 packets-out=.1.3.6.1.2.1.31.1.1.1.11.6
discards-out=.1.3.6.1.2.1.2.2.1.19.6 errors-out=.1.3.6.1.2.1.2.2.1.20.6
Any you here see that line 6 in Interface and OID shows
VLAN20 and
.12 after all OID so
ifindex=12
IfIndex=0 seems to be the router it self. Since I do not like SNMP since it goes the other way, it does not work behind NAT/Firewall, I will use syslog and a script to store the ifindex and name in an KV store database for use with the MikroTik app if it possible,
Re: Tool: Using Splunk to analyse MikroTik logs 3.0 (Graphing everything)
Posted: Mon Jun 22, 2020 11:20 am
by jvanhambelgium
I've taken Wireshark captures of both IPFIX & v9 streams, starting with the exchange of the templates etc describing all the fields.
I have the impression that the Splunk Stream does not utilize ALL available "fields". I'm going to see if the "dictionary" contains these fields.
Probably you can "add" them. I've seen that. Its a matter of mapping the code (eg. 225,226,... to the correct type (eg. string, IP, integer, ...)
Field (20/23): postNATSourceIPv4Address
Type: postNATSourceIPv4Address (225)
Length: 4
Field (21/23): postNATDestinationIPv4Address
Type: postNATDestinationIPv4Address (226)
Length: 4
Field (22/23): postNAPTSourceTransportPort
Type: postNAPTSourceTransportPort (227)
Length: 2
Field (23/23): postNAPTDestinationTransportPort
Type: postNAPTDestinationTransportPort (228)
Length: 2
I've done the same using the PMACCT-package by simply creating an "primitives" files for the correct mappings and this worked fine.
Cisco NetFlow/IPFIX
Version: 9
Count: 7
SysUptime: 873590.040000000 seconds
Timestamp: Jun 22, 2020 10:03:08.000000000 CEST
CurrentSecs: 1592812988
FlowSequence: 22
SourceId: 0
FlowSet 1 [id=256] (7 flows)
FlowSet Id: (Data) (256)
FlowSet Length: 532
[Template Frame: 1]
Flow 1
[Duration: 0.000000000 seconds (switched)]
StartTime: 873528.130000000 seconds
EndTime: 873528.130000000 seconds
Packets: 1
Octets: 86
InputInt: 15
OutputInt: 14
SrcAddr: 172.29.45.4
DstAddr: 195.238.2.21
Protocol: UDP (17)
IP ToS: 0x00
SrcPort: 51020 (51020)
DstPort: 53 (53)
NextHop: 195.238.2.21
DstMask: 0
SrcMask: 0
TCP Flags: 0x00
Destination Mac Address: Routerbo_20:22:b6 (6c:3b:6b:20:22:b6)
Source Mac Address: ASRockIn_84:01:36 (d0:50:99:84:01:36)
Post Source Mac Address: 00:00:00_00:00:00 (00:00:00:00:00:00)
Post NAT Source IPv4 Address: 81.119.157.161 (=my public IP address on my PPPoE)
Post NAT Destination IPv4 Address: 195.238.2.21
Post NAPT Source Transport Port: 51020
Post NAPT Destination Transport Port: 53
Re: Tool: Using Splunk to analyse MikroTik logs 3.0 (Graphing everything)
Posted: Tue Jun 23, 2020 9:55 am
by jvanhambelgium
I've posted on Splunk community this question on the NAT-fields and why there are not per-direct usable as fields in Splunk ... hopefully ...
In the mean time, it seems the approach below is a good reference to what is coming IN en what is going OUT
First of all, I've limited "Netflow" currently only on my PPPoE "interface" in stead of "all"
It seems following pattern is consistent :
OUTSIDE -> INSIDE (but destined for Mikrotik itself, eg. DNS-lookups, IPSEC tunnel termination)
dest_ip = nexthop_addr
OUTSIDE -> INSIDE (returning traffic destined for LAN-stations)
(dest_ip =! nexthop_addr)
INSIDE -> OUTSIDE
(dest_ip = nexthop_addr) + src_ip is in the same range*** as "exporter_ip"
*** This only works if you "inside LAN" containing hosts is in the same range as your bridge. Eg a single 192.168.x.y network at home. If this Mikrotik is sitting somewhere in between other networks I think this will not work. The "exporter_ip" (field that you can manually set in RouterOS and if not set it will use the IP of the exiting interface on its way to the target) is then completely not related to the endhosts consuming data.
Re: Tool: Using Splunk to analyse MikroTik logs 3.0 (Graphing everything)
Posted: Tue Jun 23, 2020 12:12 pm
by Jotne
Look at this table
line	_time			src_ip		s_port	dest_ip		d_port	next_ip		byte		pacet	prot	in_if	out_if
1	2020-06-23 10:50:11.280	193.212.a.a	42744	92.220.b.b	514	10.10.10.50	3903	 	35	17	1	2	0
2	2020-06-23 10:50:00.570	193.212.a.a	22	92.220.b.b	55774	10.10.10.32	1312380	 	2191	6	1	2	24
3	2020-06-23 10:50:00.540	10.10.10.32	55774	193.212.a.a	22	92.220.200.1	1074672	 	9631	6	2	1	24
193.212.a.a an linux server
92.220.b.b my public IP
92.220.200.1 ISP gateway
10.10.10.32 inside PC
10.10.10.50 Syslog server
1 outside ether1 interface
2 inside bridge interface
Line 3:
I do an ssh to the linux server on port 22, coming from bridge going out on interface ether1 1074672 sent
Line 2:
Linux server reply with data coming from port 22 (part of previous session) going in on ehter1 and out on bridge 1312380 recieved
Line 1:
Linux server sends an udp syslog packed to my syslog server to port 514.
My problem is that in line 1 and 2 the src/dest port are swapped. How do I know that line 2 is part of an previous session?
How to see what is different on line 1 and 2 and now the correct port order.
Re: Tool: Using Splunk to analyse MikroTik logs 3.0 (Graphing everything)
Posted: Tue Jun 23, 2020 5:36 pm
by Jotne
After talking more than one hour with a super spesialist in Netflow, I do start to get the grip on how things works.
There are no way you can se in a Netflow packets, if its traffic returning from an started inside session or if it some from outside starting to sending inn data. You can look at ports and say that all ports below 1024 are destination ports, rest are source port. This will help some but will fail for all application using high ports like Minecraft that uses port 25565 as default listening port.
What you can see with Netflow is how much traffic going inn or out and from what IP to what IP. Ports however are not solvable.
Re: Tool: Using Splunk to analyse MikroTik logs 3.0 (Graphing everything)
Posted: Tue Jun 23, 2020 6:49 pm
by jvanhambelgium
After talking more than one hour with a super spesialist in Netflow, I do start to get the grip on how things works.
There are no way you can se in a Netflow packets, if its traffic returning from an started inside session or if it some from outside starting to sending inn data. You can look at ports and say that all ports below 1024 are destination ports, rest are source port. This will help some but will fail for all application using high ports like Minecraft that uses port 25565 as default listening port.
What you can see with Netflow is how much traffic going inn or out and from what IP to what IP. Ports however are not solvable.
Hmm, to get some accounting in place I don't think the what-packets-are-part-of-what-session is really helpfull/important. You only need to make sure that those flow-records within that time-frame (eg. per 60-second , 300-second) are grouped & counted together to get some IN / OUT "totals".
For the ports, I would already be happy if I get a graph in Splunk visualizing all destination-ports grouped by "external" or "internal".
So you can select "Internal Traffic" or "External Traffic" and have visibility on dest-ports to learn if any abnormal services might be there that you do not expect.
I don't understand your statement "
ports however are not solvable" . You CAN filter all records related to OUTBOUND and you can filter on DST_PORT so you can get all externa/Internet targetted systems and dest-ports visible not ?? For INBOUND this is a bit harder, because the "dest_port" value might not be the same as the "src_port" initiated by the inside host. There is NA(P)T in between hence the 4 NAT/NAPT extra fields would be usefull.
I really hope there is a way to get the
4 fields visible in Splunk that ARE in a v9 flow-record :
I can't find them! Really weird.
Post NAT Source IPv4 Address: 81.120.157.162 (=my public IP address on my PPPoE, don't worry not my real one)
Post NAT Destination IPv4 Address: 195.238.2.21 (public ISP DNS servers)
Post NAPT Source Transport Port: 51020
Post NAPT Destination Transport Port: 53
Re: Tool: Using Splunk to analyse MikroTik logs 3.0 (Graphing everything)
Posted: Tue Jun 23, 2020 6:53 pm
by jvanhambelgium
What you can see with Netflow is how much traffic going inn or out and from what IP to what IP. Ports however are not solvable.
I would not say that, in a previous project we had a global deployed Riverbed solution with a very large Netflow collector appliance (taking in millions of flows per day from over the whole globe)
You could perfectly drill down and visualize communications from any IP to any IP and display what applications/ports where at play between them.
But again, it was no free plugin
but more of a 6-digit appliance.
Re: Tool: Using Splunk to analyse MikroTik logs 3.0 (Graphing everything)
Posted: Tue Jun 23, 2020 7:52 pm
by jvanhambelgium
It's clear that the 2 Github examples of dashboard have some errors in them.
Example the one with a pie-graph "Top Destination IP's" I see large chunck that has MY own public IP address which does not make sense and this is because of NAT and just returning traffic.
Sure the "dest_ip" field in the packets IS my Mikrotik public IP, but logic should be there to know that Splunk should not look at it in this context.
Splunk can "learn" what the public/NAT IP is by comparing "dest_ip' with "nexthop_addr" . If you find any records where these 2 are the same, then store the "dst_ip" value because that is a public IP used for NA(P)T.
Then later you can make sure you exclude this because it does not contribute to the aspect of "top
destination IP's" (for calculating VOLUMES you obviously need this in some way, as a large chunck of return traffic hits this public IP, but then the "nexthop_addr" will reveal the real internal host to which this traffic belongs). IF the "nexthop_addr" = "dst_ip" AND src_ip =! RFC1918 space then this traffic is destined for Mikrotik itself (DNS lookups, IPSEC tunnels traffic etc) but for VOLUMES should be counted too actually.
I'm not 100% with my above claim but it looks like it, I only don't know how to pull this off in Splunk ;-(
I'm going to check if I can find some Splunk expertise within my company to ask some questions on this. I know we do, only not sure they are willing to help out
EDIT : My statement is NOT correct at all ... back to the drawing board...
EDIT2 : Wouldn't it be simpler to extended your script and obtain the IP-addresses associated with interfaces (eg. PPPoE or others) and get them into Splunk ? In addition, the pre-req could be that users must add the keyword "WAN" on the interface-description to you know directly what is the external/outside interface. That is not really THAT much of a problem I guess since your script requires some modifications/config anyway. This is easy for everyone.
Another pre-req could be Netflow should only be activated on the WAN-interface. Let's keep it simple to start with.
Once there you can obtain the current "WAN" interface-IP my making the query in Splunk at least you don't need to SNMP interface-ID stuff anymore?. Any record with dst_ip = WAN-IP is clearly "inbound" (could be DNAT portmapping traffic but also regular returning packets from an inside started session, doesn't matter for accounting purposes just count the bytes in a given time).
Then also you can count everything =! (NOT) equal to the WAN-IP and this will give you "upload" traffic. If you want to "split" traffic generated by Mikrotik add the "src_ip=WAN_IP" to the query.
So suppose WAN=92.178.157.120
Eg. source="stream:netflow" dest_ip!="92.178.157.120" src_ip="92.178.157.120" => For my dataset this returns packets related to EGRESS activity Mikrotik itself, so DNS/IPSEC/DDNS/NTP updates and I also got hits on an IP SMTP of my provider when Mikrotik sends out MAIL.
This can be added to the package of other EGRESS traffic (caused by internal hosts) that can be found with.
source="stream:netflow" dest_ip!="92.178.157.120" src_ip!="92.178.157.120" and cross-checking with the retrieved "src_ip" list only list "internal" hosts indeed.
So these combined would be total OUTPUT on the link I guess.
For INBOUND/DOWNLOAD, the logic is a bit different.
source="stream:netflow" dest_ip="92.178.157.120" nexthop_addr="92.178.157.120" gives me only records with src_ports like DNS/NTP/IPSEC to for sure traffic inbound to the Mikrotik. Pretty sure DNAT would go also under this. (need to test this)
And then finally the "bulk" of download traffic coming back from Internet for clients on the local LAN would be
source="stream:netflow" dest_ip="92.178.157.120" nexthop_addr!="92.178.157.120" => When I make this query my nexthop_addr list only contains all my LAN-stations receiving this returning traffic.
That would take care of an "accounting" alternative I guess for Inbound/Outbound at a high level.
Re: Tool: Using Splunk to analyse MikroTik logs 3.0 (Graphing everything)
Posted: Wed Jun 24, 2020 8:45 am
by Jotne
I will make a view that shows total traffic in/out, what IP it does come from and what IP it goes to. That is not the problem.
What I would like to know is what port is used, there i were the problem lays.
Look at line 1 and line 2 in the above post.
Both comes from same IP 193.212.a.a, both goes to same outside IP on my router 92.220.b.b. One will go to 10.10.10.50 and other to 10.10.10.32. So they will be counted as inn traffic.
Problem is that line 2 is part of an ongoing session starting from inside, showing port swapped around. Line 1 has started from the outside and are going trough a nat hole and has the port correct direction. There are no way I can setup a program to get this correct connected to the Port since they look the same. You can guess that line 2 are part of some, since it has source_port 22 and line 1 is a starting of some, since port are 514. But what if source port is 25565? It can be a new session going inn to dest_port 3389 (Rdp) or it can be return traffic for someone plays minecraft and connected to a server on the outside using port 25565.
Give me some days, and I will create some test views.
Re: Tool: Using Splunk to analyse MikroTik logs 3.1 (Graphing everything)
Posted: Thu Jun 25, 2020 2:13 pm
by Jotne
Splunk for MikroTik updated to v3.1
Mayor changes is the CAPsMAN view
If you like to use the CAPsMAN, update script to 4.1 and add capsmann script fond in section 2f first post:
To upgrade, delete the folder /splunk/etc/app/Mikrotik
Then install the unpacked spl (use winrar/winzip) file, install app from
"Manage app" -> "Install app from file"
To get the most out of this version, upgrade the script (not needed) on the router to latest version. (3.9)
# 3.1 (25.06.2020)
# Added CAPsMAN view and extraction
# Added limit=0 to "MikroTik DHCP pool information"
# Added dhcp server to "MikroTik DHCP request"
# Added pool selection to "MikroTik DHCP pool information"
# Added information about static release in "MikroTik DHCP pool information"
# Updated script to 4.0 removed double information and added write-sector information
# Added Sector Writes to "Mikrotik Resources"
# Updeated KV search in "Mikrotik Device List" to not overwrite all data
# Fixed missing host in "Mikrotik Uptime"
# Fixed KV update and change names
# Added src_ip counter in "Mikrotik DNS Live usage"
# Added name_id for mac in "MikroTik Wifi connection" and "MikroTik Wifi strength"
# Added sort by host/module and hostname in "MikroTik Log Size"
# Added free text search to "MikroTik Firewall Rules"
Re: Tool: Using Splunk to analyse MikroTik logs 3.1 (Graphing everything)
Posted: Thu Jun 25, 2020 4:01 pm
by Jotne
Script updated to 4.1 to get CAPsMANN inforamtion.
Read section 2f) if you like to use CAPsMANN function.
Re: Tool: Using Splunk to analyse MikroTik logs 3.1 (Graphing everything)
Posted: Fri Jul 10, 2020 7:44 am
by robsgax
Script updated to 4.1 to get CAPsMANN inforamtion.
Read section 2f) if you like to use CAPsMANN function.
Where is version 4.1??, i only see ver 4.0 on the OP.
Re: Tool: Using Splunk to analyse MikroTik logs 3.1 (Graphing everything)
Posted: Fri Jul 10, 2020 8:23 am
by Jotne
Where is version 4.1??, i only see ver 4.0 on the OP.
Fixed
Re: Tool: Using Splunk to analyse MikroTik logs 3.1 (Graphing everything)
Posted: Tue Jul 14, 2020 8:23 pm
by robsgax
I just noticied this:
Splunk for MikroTik updated to v3.1
Mayor changes is the CAPsMAN view
If you like to use the CAPsMAN, update script to 4.1 and add capsmann script fond in section 2f first post:
and this code on the script:
# Test if CAPsMANN is installed, if yes, run it
# ----------------------------------
:do {
	:if ([:len [/caps-man registration-table find]] > 0 and $CAPsMANN) do={
		/system script run capsman
	}
} on-error={}
where is the capsman script?
Re: Tool: Using Splunk to analyse MikroTik logs 3.1 (Graphing everything)
Posted: Tue Jul 14, 2020 11:38 pm
by Jotne
A good question
Added to first post.
Re: Tool: Using Splunk to analyse MikroTik logs 3.1 (Graphing everything)
Posted: Wed Jul 15, 2020 1:45 am
by robsgax
thanks for the hard work
is there a way to make the script output not be reflected on the memory or disk log?, only send it to the remote splunk server?
were having some isp issues and i need to use the log a lot, but its filled with the splunk script output, i did put a usb memory and sent the log to disk too, because with only the memory log, i lost the values that i need every 5 or 10 minutes, but with the disk log its still too big, i did separate the logs by lines, but still to big., here's an image of my current situation, 30 files of 8192 lines just for the last 2 days.
SNAG 2020-07-14 0000.png
is there a way to hide it?
Re: Tool: Using Splunk to analyse MikroTik logs 3.1 (Graphing everything)
Posted: Wed Jul 15, 2020 1:04 pm
by zandhaas
Hello Jotne,
Have you ever considered using a dockerized Splunk Environment?
I lately tested this but did not get any mikrotik information in Splunk.
My "normal" Splunk envirnoment is working.
Re: Tool: Using Splunk to analyse MikroTik logs 3.1 (Graphing everything)
Posted: Wed Jul 15, 2020 1:31 pm
by ferdytao
Hello Jotne,
Have you ever considered using a dockerized Splunk Environment?
I lately tested this but did not get any mikrotik information in Splunk.
My "normal" Splunk envirnoment is working.
I'm actually have my splunk environment on docker working perfectly.
Inviato dal mio SM-G950F utilizzando Tapatalk
Re: Tool: Using Splunk to analyse MikroTik logs 3.1 (Graphing everything)
Posted: Wed Jul 15, 2020 1:56 pm
by zandhaas
I'm actually have my splunk environment on docker working perfectly.
Inviato dal mio SM-G950F utilizzando Tapatalk
do you use the official Splunk image?
and do you have a separate rsyslog environment or is that not neccesary?
and how do you start the Splunk container?
thanks in advance.
Re: Tool: Using Splunk to analyse MikroTik logs 3.1 (Graphing everything)
Posted: Wed Jul 15, 2020 3:11 pm
by ferdytao
Yes I'm using the official splunk image with internal syslog stored on local volume (I'm using Docker on my Synology NAS).
Here is my config:
docker run -d --net host -v /volume3/docker/Splunk/etc:/opt/splunk/etc -v /volume3/docker/Splunk/var:/opt/splunk/var -v /etc/localtime:/etc/localtime:ro -e "SPLUNK_START_ARGS=--accept-license" -e "SPLUNK_PASSWORD=Password" --name splunk splunk/splunk:latest
You have to use host network (--net host) or macvlan, otherwise you will not see the single client's ip but the natted address. If you don't want use --net host you need to correctly map the ports.
Re: Tool: Using Splunk to analyse MikroTik logs 3.1 (Graphing everything)
Posted: Wed Jul 15, 2020 4:34 pm
by zandhaas
Thank you I going to try this somewhere in the next day's.
Re: Tool: Using Splunk to analyse MikroTik logs 3.1 (Graphing everything)
Posted: Thu Jul 16, 2020 11:35 am
by Jotne
is there a way to make the script output not be reflected on the memory or disk log?, only send it to the remote splunk server?
I do not see those files on my disk. Can you download one of them to your PC and list whats in the file?
Re: Tool: Using Splunk to analyse MikroTik logs 3.1 (Graphing everything)
Posted: Thu Jul 16, 2020 11:41 am
by Jotne
Thank you I going to try this somewhere in the next day's.
Should work as long as data gets inn to Splunk and are tagged correctly "MikroTik"
Re: Tool: Using Splunk to analyse MikroTik logs 3.1 (Graphing everything)
Posted: Thu Jul 16, 2020 6:38 pm
by robsgax
is there a way to make the script output not be reflected on the memory or disk log?, only send it to the remote splunk server?
I do not see those files on my disk. Can you download one of them to your PC and list whats in the file?
the files are showing on my disk because i have a rule that send the logs there, we need to analyze some things on the logs for my isp, but the script is making the logs grow a lot in size,
/system logging action
add disk-file-count=31 disk-file-name=disk1/logs/log disk-lines-per-file=8192 \
    name=disk1 target=disk
/system logging
set 3 action=memory
add action=disk1 topics=critical
add action=disk1 topics=error
add action=disk1 topics=info
add action=disk1 topics=warning
add action=disk1 topics=wireless,debug
add action=disk1 topics=e-mail,debug
add action=disk1 topics=caps,debug
and here's a log with the lines that are generated from the splunk script
log.0.txt
as you see, in 10 minutes more than 3000 lines are filled
Re: Tool: Using Splunk to analyse MikroTik logs 3.1 (Graphing everything)
Posted: Thu Jul 16, 2020 11:50 pm
by Jotne
the files are showing on my disk because i have a rule that send the logs there
You have selected to write the logs to your disk so it will write it there. I do not understand the problem. Just remove the log to the disk?
Re: Tool: Using Splunk to analyse MikroTik logs 3.1 (Graphing everything)
Posted: Fri Jul 17, 2020 12:25 am
by jvanhambelgium
Jotne,
Did you spend some time in looking on the Netflow story with Splunk ? Possible integration into your current application/set of dashboards ?
Re: Tool: Using Splunk to analyse MikroTik logs 3.1 (Graphing everything)
Posted: Fri Jul 17, 2020 1:07 am
by robsgax
the files are showing on my disk because i have a rule that send the logs there
You have selected to write the logs to your disk so it will write it there. I do not understand the problem. Just remove the log to the disk?
the thing is the logs are filled with info from the splunk script, what i was asking is that there is a way to be able to ommit that info on the memory and disk log, only send it to the remote syslog. if i dont sent it to disk, i am sure that it will not be sent to disk, only to memory, but i choose to send it to disk because my isp and i need to analyze the logs and they are filled with the script output, and the memory log gets filled every 10 or 15 minutes, that is what im trying to hide, how i can make that?
Re: Tool: Using Splunk to analyse MikroTik logs 3.1 (Graphing everything)
Posted: Fri Jul 17, 2020 8:45 am
by Jotne
The point with the script is to send all information using syslog. If you selet that log should be sent to disk, it will also go there. As far as I know, you can not split the logg saying that some should go to disk, some to memory and some to disk.
I still do not understand why you need logs to disk. Its 10 times better to get all to Splunk, and then analyse what you are looking for there. Disk is a limited resource on the routers so it will fill up quickly.
Re: Tool: Using Splunk to analyse MikroTik logs 3.1 (Graphing everything)
Posted: Fri Jul 17, 2020 8:58 am
by zandhaas
Yes I'm using the official splunk image with internal syslog stored on local volume (I'm using Docker on my Synology NAS).
With "internal syslog" you mean the Synology syslog. In the Splunk container I do not see a syslog.
Re: Tool: Using Splunk to analyse MikroTik logs 3.1 (Graphing everything)
Posted: Fri Jul 17, 2020 9:05 am
by jvanhambelgium
Yes I'm using the official splunk image with internal syslog stored on local volume (I'm using Docker on my Synology NAS).
With "internal syslog" you mean the Synology syslog. In the Splunk container I do not see a syslog.
You don't need to "look" for any Syslog in Splunk. Syslog is just 1 of many ingress channels for data into Splunk. Offcourse you need to make it possible for syslog messages to arrive in Splunk so expose some ports etc.
That script "tags" all messages coming from the Mikrotik with the label "MikroTik" and basically in Splunk you can simply enter the keywork MikroTik in the search-bar and you'll everything related to it...
Re: Tool: Using Splunk to analyse MikroTik logs 3.1 (Graphing everything)
Posted: Fri Jul 17, 2020 11:32 am
by zandhaas
Yes I'm using the official splunk image with internal syslog stored on local volume (I'm using Docker on my Synology NAS).
Here is my config:
docker run -d --net host -v /volume3/docker/Splunk/etc:/opt/splunk/etc -v /volume3/docker/Splunk/var:/opt/splunk/var -v /etc/localtime:/etc/localtime:ro -e "SPLUNK_START_ARGS=--accept-license" -e "SPLUNK_PASSWORD=Password" --name splunk splunk/splunk:latest
You have to use host network (--net host) or macvlan, otherwise you will not see the single client's ip but the natted address. If you don't want use --net host you need to correctly map the ports.
It looks like I'm getting data into Splunk.
I will check this weekend if everthing is complete.
Re: Tool: Using Splunk to analyse MikroTik logs 3.1 (Graphing everything)
Posted: Fri Jul 17, 2020 11:41 am
by Jotne
Du a search like this to see if any data comes inn to splunk.
Re: Tool: Using Splunk to analyse MikroTik logs 3.1 (Graphing everything)
Posted: Fri Jul 17, 2020 12:31 pm
by zandhaas
I see a lot of information so it seems OK but I have the check this weekend if everything is complete.
Re: Tool: Using Splunk to analyse MikroTik logs 3.1 (Graphing everything)
Posted: Sat Jul 18, 2020 12:52 am
by robsgax
The point with the script is to send all information using syslog. If you selet that log should be sent to disk, it will also go there. As far as I know, you can not split the logg saying that some should go to disk, some to memory and some to disk.
I still do not understand why you need logs to disk. Its 10 times better to get all to Splunk, and then analyse what you are looking for there. Disk is a limited resource on the routers so it will fill up quickly.
i need logs to disk because, again, were having trouble with my connection, my isp need to see the logs, and memory log is too small, that's why we send them to disk, so they can analize over the course of 4 or 5 days and do what they need to do to fix our issues, if i deny, they wont fix anything, until i send them the logs.
again, the script send everything to memory, disk, remote, and all log options that i have, what im asking is if we can route the script output only to the remote log route. bypassing memory, disk or another medium, if you go to system, loggin, actions, those are the destination of the logs, and with the rules, you can tell what goes where, and in the script you can tell where to log, for example,
:log info message="script=ntp status=$([/system ntp client get status])"
thats one line of the script, can i change that, so instead of send the log to info message, and it goes acording to the rules, to memory, disk, remote, etc etc? im not very versatile with scripts and mikrotiks,
that what im asking, if it can be done.
Re: Tool: Using Splunk to analyse MikroTik logs 3.1 (Graphing everything)
Posted: Sat Jul 18, 2020 11:51 am
by Jotne
Since my script log events as
info and you have this:
add action=disk1 topics=critical
add action=disk1 topics=error
add action=disk1 topics=info
You do tell that all info log should go to the disk as well.
Why can you not give your ISP access to your Splunk? They will then get the same log as you store to disk. At the same time you do not wear out the small router flash.
Re: Tool: Using Splunk to analyse MikroTik logs 3.1 (Graphing everything)
Posted: Wed Jul 22, 2020 9:32 am
by jvanhambelgium
Would it be possible to allow more then 20-characters on a firewall-rule index in Splunk ?? Increase it to 25 or so ?
For some rules in Splunk where my label exceed 20-chars, I get :
too_long_Prefix_max_20_characters
Especially some custom NAT/Portknock rules that contain a somewhat larger label..
Re: Tool: Using Splunk to analyse MikroTik logs 3.1 (Graphing everything)
Posted: Wed Jul 22, 2020 8:43 pm
by Jotne
Problem is that if you do use longer name, RouterOS starts to chop off characters. So to solve this MikroTik needs to modify the RouterOS.
This is why I in first post added sample on how to name the filter rules to have some contoll.
Re: Tool: Using Splunk to analyse MikroTik logs 3.1 (Graphing everything)
Posted: Sun Aug 02, 2020 12:26 pm
by oaas
Any plans for adapting the script to the upcoming RouterOS 7.x version?
Re: Tool: Using Splunk to analyse MikroTik logs 3.1 (Graphing everything)
Posted: Sun Aug 02, 2020 3:10 pm
by Jotne
It did work with 7.0 beta, have not had time to look at 7.1
Most negative thing with the new >= 7.0 beta 8 is that they have removed accounting.
We now have to use Netflow to log detailed data.
This gives around 10 times larger logs, and need extra port not just syslog port.
Much more complicated setup.
Rest should work.
Re: Tool: Using Splunk to analyse MikroTik logs 3.1 (Graphing everything)
Posted: Sun Sep 20, 2020 2:16 pm
by ingus16
Did this solution work with splunk linux docker version as well ? In my case, splunk receives mikrotik syslog data but in this plugin shows no devices
Re: Tool: Using Splunk to analyse MikroTik logs 3.1 (Graphing everything)
Posted: Sun Sep 20, 2020 3:53 pm
by Jotne
Did this solution work with splunk linux docker version as well ? In my case, splunk receives mikrotik syslog data but in this plugin shows no devices
All message need to be tagged "MikroTik", so message should look like this using this search:
index=* (section 2b)
dns MikroTik: done query: #3083521 dns name does not exist
You can also try this search:
index=* | eval status=if(match(_raw, "MikroTik"), "ok", "error") | stats count by host status
It should give a list of all host sending logs to Splunk, with "ok" behind the host that sends logs with "MikroTik" in it.
PS One letter written wrong gives problems.
Re: Tool: Using Splunk to analyse MikroTik logs 3.1 (Graphing everything)
Posted: Thu Dec 17, 2020 6:09 am
by horcsct
Dear Sir,
Thanks for Tool. I get below error (log/splunkd.log) and after that logging stopped.
WARN DateParserVerbose - Failed to parse timestamp in first MAX_TIMESTAMP_LOOKAHEAD (32) characters of event. Defaulting to timestamp of previous event (Thu Dec 17 04:11:00 2020). Context: source=udp:514|host=xxx.xxx.xxx.x|syslog|
Thanks for your help.
EDIT
I add two below lines under [syslog] in etc/apps/MikroTik/default/props.conf and problem solved till now :-)
MAX_TIMESTAMP_LOOKAHEAD = 23
DATETIME_CONFIG = CURRENT
Re: Tool: Using Splunk to analyse MikroTik logs 3.1 (Graphing everything)
Posted: Fri Dec 18, 2020 3:20 pm
by horcsct
I have AD DNS which forward DNS requests to MikroTik. Now the Splunk logs two DNS requests, one for AD DNS server and one for client. How I can exclude AD DNS requests?
Thanks
Re: Tool: Using Splunk to analyse MikroTik logs 3.1 (Graphing everything)
Posted: Fri Dec 18, 2020 6:17 pm
by Jotne
You could try this:
/system logging
add action=logserver prefix=MikroTik topics=dhcp
add action=logserver prefix=MikroTik topics=!debug,!dns
To exclude DNS logs from MT.
Re: Tool: Using Splunk to analyse MikroTik logs 3.1 (Graphing everything)
Posted: Fri Dec 18, 2020 7:31 pm
by jvanhambelgium
Dear Sir,
Thanks for Tool. I get below error (log/splunkd.log) and after that logging stopped.
WARN DateParserVerbose - Failed to parse timestamp in first MAX_TIMESTAMP_LOOKAHEAD (32) characters of event. Defaulting to timestamp of previous event (Thu Dec 17 04:11:00 2020). Context: source=udp:514|host=xxx.xxx.xxx.x|syslog|
Thanks for your help.
EDIT
I add two below lines under [syslog] in etc/apps/MikroTik/default/props.conf and problem solved till now :-)
MAX_TIMESTAMP_LOOKAHEAD = 23
DATETIME_CONFIG = CURRENT
Perhaps some more tuning parameters to consider.
https://www.sicherevielfalt.de/blog/the ... nce-boost/
Re: Tool: Using Splunk to analyse MikroTik logs 3.1 (Graphing everything)
Posted: Sat Dec 19, 2020 1:44 pm
by j2sw
Awesome post! I have pushed this out to my blog as I think it is a very helpful tool!
Re: Tool: Using Splunk to analyse MikroTik logs 3.1 (Graphing everything)
Posted: Sun Dec 20, 2020 9:09 pm
by horcsct
You could try this:
/system logging
add action=logserver prefix=MikroTik topics=dhcp
add action=logserver prefix=MikroTik topics=!debug,!dns
To exclude DNS logs from MT.
The AD DNS did not forward clients name (all clients are the domain name) so I want keep MikroTik DNS logs and exclude domain DNS logs.
Thanks.
Re: Tool: Using Splunk to analyse MikroTik logs 3.1 (Graphing everything)
Posted: Sat Feb 06, 2021 11:51 pm
by Niffchen
I am using your great tooll for some weeks but I have some problems ... sometimes.
I have one "RB4011iGS+", 4 "hAP ac" and 1 "wAP ac". All systems are performing very well and there are no issues.
But sometimes the hAP acs seem to stop sending data to my Splunk host. Than I am missing some DHCP data of the host which has paused (that is all I recognized at the moment) and at the dashboard "MikroTik Device List" I can see that there are no more "Uptime" messages for the device.
Today it happened after configuring different wifi devices and testing all wifi netowrks with all device connected to this hAP ac. Before this testing everything seems to be ok, now there are no more "Uptime" values. It looks curious ...
Do you have any ideas whats going on?
Thank you very much,
Jens
Re: Tool: Using Splunk to analyse MikroTik logs 3.1 (Graphing everything)
Posted: Mon Feb 15, 2021 11:53 am
by roe1974
Hi :-)
Thanks for the great description/instructions.
Does this also work with Splunk's cloud solution ?
If yes ...how ?
thx
greetings Richard
Re: Tool: Using Splunk to analyse MikroTik logs 3.2 (Graphing everything)
Posted: Sun Feb 21, 2021 10:26 am
by Jotne
Splunk for MikroTik updated to v3.2
This version contains most tweaks and fixes.
To upgrade, delete the folder /splunk/etc/app/Mikrotik
Then install the unpacked spl (use winrar/winzip) file, install app from
"Manage app" -> "Install app from file"
To get the most out of this version, upgrade the script (not needed) on the router to latest version. (3.9+)
# 3.2 (21.02.2021)
# Fixed DHCP extractbiondue to change in 6.48 log format.
# Fixed error in numer of mac pr host in "MikroTik Wifi strength"
# Added more info in "MikroTik Accouning Traffic"
# Added list in "MikroTik Admin user login"
# Added Source Port in "MikroTik Firewall Rules"
# Added more info in "MikroTik Log Size"
# Added logout and added client_id info. Fixed sorting "MikroTik PPPoE Connection"
# Fixed Time in "MikroTik System Changes"
# Added multi selection in graphs, moved legends in "MikroTik uPnP"
# Fixed typo in "MikroTik VPN Connection"
Re: Tool: Using Splunk to analyse MikroTik logs 3.2 (Graphing everything)
Posted: Wed Feb 24, 2021 10:21 am
by MattMiTi
THANKS!!!
Re: Tool: Using Splunk to analyse MikroTik logs 3.2 (Graphing everything)
Posted: Wed Feb 24, 2021 7:28 pm
by jvanhambelgium
Thanks!
Re: Tool: Using Splunk to analyse MikroTik logs 3.2 (Graphing everything)
Posted: Fri Mar 26, 2021 5:22 pm
by eddieb
Hi Jotne,
a couple of days ago I discoverd that running splunk in docker on my Synology NAS was way easier than I ever thought ...
Everything runs smooth but I have 1 question about NTP/SNTP, all my "ntp slave" devices run SNTP instead of NTP, NTP only runs on my borderrouter ...
All devices run fine with SNTP but why does splunk signal that SNTP is not correct ?
Re: Tool: Using Splunk to analyse MikroTik logs 3.2 (Graphing everything)
Posted: Fri Mar 26, 2021 11:36 pm
by Jotne
All devices run fine with SNTP but why does splunk signal that SNTP is not correct ?
An error in the script was found.
Updated script to version
4.2
You can just change the NTP part of the script to make it work:
# Get NTP status
# ----------------------------------
:do {
	:log info message="script=ntp status=$([/system ntp client get status])"
} on-error={
	:if ([:len [/system ntp client get last-update-from]]>0) do={
		:log info message="script=ntp status=synchronized"
	} else={
		:log info message="script=ntp status=not-synchronized"
	}
}
Re: Tool: Using Splunk to analyse MikroTik logs 3.2 (Graphing everything)
Posted: Mon Mar 29, 2021 11:20 am
by eddieb
tnx, I updated the script ;-)
btw, I ran into the 500MB free licence limit the 2nd day it was running ...
As I am running dude with SNMP monitoring,
the rule
/system logging add action=logserver prefix=MikroTik topics=!debug,!packet
to log everything produces a LOT of snmp log traffic.
I had to change it to
/system logging add action=logserver prefix=MikroTik topics=!debug,!packet,!snmp
Re: Tool: Using Splunk to analyse MikroTik logs 3.2 (Graphing everything)
Posted: Mon Mar 29, 2021 11:56 am
by Jotne
Thanks for info, I will remove snmp for the main post, since we do not need this type of log, since its already logged by the SNMP
Re: Tool: Using Splunk to analyse MikroTik logs 3.2 (Graphing everything)
Posted: Mon Mar 29, 2021 12:12 pm
by eddieb
I noticed your change on the main topic.
you need to modify the line for the webinterface ;-)
Re: Tool: Using Splunk to analyse MikroTik logs 3.2 (Graphing everything)
Posted: Mon Mar 29, 2021 12:43 pm
by Jotne
Not sure what you mean, I change the 2b section.
Re: Tool: Using Splunk to analyse MikroTik logs 3.2 (Graphing everything)
Posted: Mon Mar 29, 2021 12:48 pm
by eddieb
2b) Then select what modules to log.
I do suggest that you send all DHCP logs including debug and all other logs that are not debug.
It is very important to name the prefix like this "MikroTik" and not "mikrotik" or some other.
Splunk uses the MikroTik prefix to find out what type of syslog data that is coming to it.
Uppercase T and uppercase M, rest are lowercase
Web gui:
System->Logging->Rules->Add new->Topics:dhcp->Prefix:MikroTik->action:your syslog server->Ok
System->Logging->Rules->Add new->Topics:!debug->Prefix:MikroTik->action:your syslog server->Ok
last line should match CLI ...
System->Logging->Rules->Add new->Topics:!debug,!packet,!snmp->Prefix:MikroTik->action:your syslog server->Ok
Re: Tool: Using Splunk to analyse MikroTik logs 3.2 (Graphing everything)
Posted: Mon Mar 29, 2021 1:19 pm
by Jotne
Thanks ageing.
Fixed. I need a cup of coffee :)
Re: Tool: Using Splunk to analyse MikroTik logs 3.2 (Graphing everything)
Posted: Fri Apr 16, 2021 12:01 am
by zandhaas
After a long time not using your tool I decided to install it again as a docker container on my Synology NAS.
I have a RB4011 Router and a seperate HAPac2 access point. I configured both devices to send all information to Splunk.
This worked for several hours but then the HAPac2 is not sending any information to splunk anymore. When I search in splunk for that host no information is found.
The script runs every 5 minutes but no info in Splunk. The logging is configured as it should (It did work for a couple of hours).
Has someone seen this also?? What can be the source for this issue??
Re: Tool: Using Splunk to analyse MikroTik logs 3.2 (Graphing everything)
Posted: Fri Apr 16, 2021 8:01 am
by Jotne
If you pass more than 500MB/day on free license, it will stop showing new data, not stop receiving data. If once device can send data and its shown in Splunk, splunk is ok. It may be some blocking your data, or device it self does not send data. Look at the config and see if all are correct.
Re: Tool: Using Splunk to analyse MikroTik logs 3.2 (Graphing everything)
Posted: Fri Apr 16, 2021 12:05 pm
by jvanhambelgium
For the licensing,go to "Settings" -> "Licensing" and there you will see howmuch MBytes you've consumed today.
If it worked for a couple of hours then I suspect the HAPac2 ?
If you go to the "Apps" then "Search" and then you have this button "Data Summary" where you can see the activity for the different datasources.
What does it say ?
Re: Tool: Using Splunk to analyse MikroTik logs 3.2 (Graphing everything)
Posted: Fri Apr 16, 2021 12:24 pm
by zandhaas
It's not the license limit. Yesterday I used < 5% of the 500MB. And yes the RB4011 continued to work after the HAPac2 stopped.
In the "data summary" I can see that the HAPac2 did send messages from around 15:00 in the afternoon (the time I added it to Splunk) until 17:37. After that nothing anymore.
This morning I added a new syslog data input to Splunk with a different port for the HAPac2. After I changed the port on the HAPac2 it immediately started sending log data again. I made this change at 08:00. And until now 11:10 the HAPac2 is still sending data. That's already 30 minutes longer then yesterday :).
Fingers crossed.
Re: Tool: Using Splunk to analyse MikroTik logs 3.2 (Graphing everything)
Posted: Fri Apr 16, 2021 12:29 pm
by zandhaas
Like the devil is playing with it.
5 minutes after I wrote the previous post the HAPac2 stopped again with sending log data to Splunk.
Yesterday it lasted 2,5 hours today 3 hours. So I have made little progress :(
Re: Tool: Using Splunk to analyse MikroTik logs 3.2 (Graphing everything)
Posted: Fri Apr 16, 2021 12:46 pm
by jvanhambelgium
Like the devil is playing with it.
5 minutes after I wrote the previous post the HAPac2 stopped again with sending log data to Splunk.
Yesterday it lasted 2,5 hours today 3 hours. So I have made little progress :(
Then clearly a bug on the RouterOS of that box ?
Can you check the logging, if you don't see any output then the script is not running.
Perhaps "re-create" it ??
Try another RouterOS release ? Hard to believe basic script execution/scheduling would be f*cked up, but with RouterOS you can expect everything ;-)
Re: Tool: Using Splunk to analyse MikroTik logs 3.2 (Graphing everything)
Posted: Fri Apr 16, 2021 1:13 pm
by zandhaas
Both devices are running at 6.48.1
The script is running I see messages coming in the log when I manual start the script.
I tried again to change the UDP port backup to the port I used yesterday. And immediatly I got a message in Splunk from the HAPac2 saying I changed the log action.
4/16/21 12:01:06.000 PM	system,info MikroTik: log action changed by admin
host = 192.168.0.8 source = udp:1514 sourcetype = mikrotik
Re: Tool: Using Splunk to analyse MikroTik logs 3.2 (Graphing everything)
Posted: Sat Apr 17, 2021 8:33 pm
by zandhaas
Yesterday I changed several things on the HAPac2:
1. Updated the device to version 6.48.2 (also upgraded the router firmware)
2. Removed the Splunk script and created it again.
3. removed the splunk remote logging action
4. edited the default remote logging action to send the syslog messages to the splunk server.
After all these changes the HAPac2 is sending log messages to the splunk server for more as 24 hours now.
So again fingers crossed.
Re: Tool: Using Splunk to analyse MikroTik logs 3.2 (Graphing everything)
Posted: Mon May 03, 2021 1:32 pm
by DarkNate
To not fill up internal logs with firewall logs etc, turn off info log to memory (max 999 lines) /system logging set 0 disabled=yes PS Hotspot is not needed if you do not use it.
Is there a way to not log the "firewall logs" into the memory without disabling system logging? I need system logging for info/debug/errors like interfaces going down etc.
Re: Tool: Using Splunk to analyse MikroTik logs 3.2 (Graphing everything)
Posted: Mon May 03, 2021 2:22 pm
by Jotne
You can try to enable info logging and add that firewall should not be included, like this:
.
logging.jpg
Re: Tool: Using Splunk to analyse MikroTik logs 3.2 (Graphing everything)
Posted: Mon May 03, 2021 2:34 pm
by DarkNate
You can try to enable info logging and add that firewall should not be included, like this:
.
logging.jpg
Thanks, that works well and makes more sense than disabling it completely, I'd suggest putting that in the original guidepost itself.
So basically I got Splunk up and working on a DigitalOcean droplet instance.
- What can I do to ensure MikroTik to Splunk Server communication is encrypted and not sent in plaintext?
- Is there a secure (HTTPS) way for me to expose the Live Attack Dashboard on my site?
Re: Tool: Using Splunk to analyse MikroTik logs 3.2 (Graphing everything)
Posted: Mon May 03, 2021 2:50 pm
by Jotne
I'd suggest putting that in the original guidepost itself.
A good Ide, I will add that.
What can I do to ensure MikroTik to Splunk Server communication is encrypted and not sent in plaintext?
Since MikroTik does not support TLS syslog (please add), the only workaround I do see is to send log to a local Rsyslog (with TLS support) that sends it to an external Syslog server using TLS
https://medium.com/poka-techblog/securi ... 862326c154
Is there a secure (HTTPS) way for me to expose the Live Attack Dashboard on my site?
You can set up Splunk to use HTTPS or add a proxy server (HAProxy) in front. Create a read only user that only sees that dashboard.
You can also make Splunk send data (eks. each 5 min) to annoter web site. (Have not tried this)
Also look at
Rest API or
Embed scheduled reports
Re: Tool: Using Splunk to analyse MikroTik logs 3.2 (Graphing everything)
Posted: Mon May 03, 2021 3:54 pm
by DarkNate
I'd suggest putting that in the original guidepost itself.
A good Ide, I will add that.
What can I do to ensure MikroTik to Splunk Server communication is encrypted and not sent in plaintext?
Since MikroTik does not support TLS syslog (please add), the only workaround I do see is to send log to a local Rsyslog (with TLS support) that sends it to an external Syslog server using TLS
https://medium.com/poka-techblog/securi ... 862326c154
Is there a secure (HTTPS) way for me to expose the Live Attack Dashboard on my site?
You can set up Splunk to use HTTPS or add a proxy server (HAProxy) in front. Create a read only user that only sees that dashboard.
You can also make Splunk send data (eks. each 5 min) to annoter web site. (Have not tried this)
Also look at
Rest API or
Embed scheduled reports
The external Syslog setup looks complicated to me, with too much overhead.
Noticed a flaw with your app, if the MikroTik is resolved using DDNS (IP>Cloud), Splunk Dashboard still reports the old IP address as "Host".
Re: Tool: Using Splunk to analyse MikroTik logs 3.2 (Graphing everything)
Posted: Mon May 03, 2021 6:12 pm
by Jotne
It reports the syslog sending IP. Host is the host field in Splunk for the incoming logs.
PS no need to quote the whole post above you. Use Post Reply button under the post.
Re: Tool: Using Splunk to analyse MikroTik logs 3.2 (Graphing everything)
Posted: Tue May 04, 2021 10:23 am
by DarkNate
I dropped this idea, due to plaintext syslog from MikroTik. I can't be bothered with gymnastic workarounds for this one. In 5 minutes of plaintext logs over the internet, I saw direct attacks dropped by the firewall that was destined for my internal subnets. So yeah...
Re: Tool: Using Splunk to analyse MikroTik logs 3.2 (Graphing everything)
Posted: Tue May 04, 2021 1:21 pm
by Jotne
I have naver seen any problems with my pain text syslog, but TLS would be a good enhancement.
You can set access list on who can send syslog to your server and also monitor when you get new hosts trying to send syslog message.
One reason that I do not see many wrong attempts, is that I have a rule that blocks an IP for 24 hour if it tries one port that are not open in my router. So if some tries example SQL port 1433, he will be blocked for all port that are open as well. including syslog/web +++
Access list have around 7000 entries all time.
Re: Tool: Using Splunk to analyse MikroTik logs 3.2 (Graphing everything)
Posted: Tue May 04, 2021 10:50 pm
by DarkNate
I have naver seen any problems with my pain text syslog, but TLS would be a good enhancement.
You can set access list on who can send syslog to your server and also monitor when you get new hosts trying to send syslog message.
One reason that I do not see many wrong attempts, is that I have a rule that blocks an IP for 24 hour if it tries one port that are not open in my router. So if some tries example SQL port 1433, he will be blocked for all port that are open as well. including syslog/web +++
Access list have around 7000 entries all time.
You're getting the wrong idea. The issue is MITM snooping. Plaintext exposes my internal network for free.
Re: Tool: Using Splunk to analyse MikroTik logs 3.2 (Graphing everything)
Posted: Tue May 04, 2021 11:16 pm
by Jotne
Ahh it was that you mean. This is why I like to use DoH. I not like all inn the middle can look at all my DNS request.
Re: Tool: Using Splunk to analyse MikroTik logs 3.2 (Graphing everything)
Posted: Wed May 05, 2021 2:41 pm
by DarkNate
Ahh it was that you mean. This is why I like to use DoH. I not like all inn the middle can look at all my DNS request.
How would DoH encrypt Syslog's plaintext which works on IP:Port Basis after the initial DNS lookup regardless?
Re: Tool: Using Splunk to analyse MikroTik logs 3.2 (Graphing everything)
Posted: Wed May 05, 2021 2:47 pm
by Jotne
It was just a comparison. DNS unencrypted. Syslog unencrypted. Syslog-TLS encrypted. DoH - DNS encrypted.
Re: Tool: Using Splunk to analyse MikroTik logs 3.2 (Graphing everything)
Posted: Fri May 28, 2021 9:45 am
by Jotne
Script updated to 4.3
Script now gets firmware information from the Router Board.
Will be added to upcoming 3.3 app.
To upgrade: Select the script data from section 2f in the first post and edit srcipt Data_to_Splunk_using_Syslog ont the router, replace all data.
This is not a needed upgrade, just to get more information. Everything will work if you do not upgrade or miks older 4.2 and 4.3 script. (Just miss the firmware info)
Re: Tool: Using Splunk to analyse MikroTik logs 3.2 (Graphing everything)
Posted: Fri May 28, 2021 3:37 pm
by leosedf
Tried to create an account and i got a message due to US guidelines etc you have to contact us..
Re: Tool: Using Splunk to analyse MikroTik logs 3.2 (Graphing everything)
Posted: Fri May 28, 2021 3:53 pm
by jvanhambelgium
Tried to create an account and i got a message due to US guidelines etc you have to contact us..
You probably where too honoust when telling in what country you live ?
Sound a bit like an export-restriction of Splunk "technology" to certain countries ?
And yeah, these days plenty of countries are on the US "blacklist" when it comes to this kind of stuff.
Re: Tool: Using Splunk to analyse MikroTik logs 3.2 (Graphing everything)
Posted: Fri May 28, 2021 4:33 pm
by leosedf
I was honest.
Is UK on the black list??
Re: Tool: Using Splunk to analyse MikroTik logs 3.2 (Graphing everything)
Posted: Fri May 28, 2021 5:05 pm
by Jotne
Never seen that before, If for some reason, you can not download, I can make a like to it.
Re: Tool: Using Splunk to analyse MikroTik logs 3.2 (Graphing everything)
Posted: Fri May 28, 2021 5:06 pm
by jvanhambelgium
I was honest.
Is UK on the black list??
Nah would surprise me ;-)
Not using any funny VPN service ?
Or perhaps your ISP used an IP-block formerly used by North-Korea ;-)
Perhaps you should open a request with Splunk and ask them why they don't let you download the software ?
Re: Tool: Using Splunk to analyse MikroTik logs 3.2 (Graphing everything)
Posted: Fri May 28, 2021 6:08 pm
by leosedf
Oh!!!
Activated now, it's going to be a complicated but fun weekend.
Re: Tool: Using Splunk to analyse MikroTik logs 3.2 (Graphing everything)
Posted: Sat May 29, 2021 10:01 am
by eddieb
@jotne
I did enroll 4.3 to a router and that stopped display "uptime" in the devicelist in spl3.2 ...
Did a rollback to 4.2
Re: Tool: Using Splunk to analyse MikroTik logs 3.2 (Graphing everything)
Posted: Sat May 29, 2021 11:10 am
by Jotne
I did for some hour have a 4.3 script posted with a small error.
Try copy it again.
Do this search, you should see uptime for every 5 min.
module=script script=resource | table _time host uptime
Re: Tool: Using Splunk to analyse MikroTik logs 3.2 (Graphing everything)
Posted: Sat May 29, 2021 11:55 am
by eddieb
Screenshot 2021-05-29 at 10.53.57.png
that search gives me no results ... (I have 6 devices reporting)
Re: Tool: Using Splunk to analyse MikroTik logs 3.2 (Graphing everything)
Posted: Tue Jun 08, 2021 6:07 am
by pixture08
Hi there,
I'm using this and very thankful to this app. Currently, my splunk is installed on my local machine (personal PC), and I'm planning to deploy Splunk on Windows VM to access it anywhere. I was able to set it up access the web UI publicly. However, I'm not getting any data from my Mikrotik. I've open the port 8000 and 514 and still wasn't able to get any data. Is there any guide for my use case?
Thank you very much and Cheers from Philippines!
Re: Tool: Using Splunk to analyse MikroTik logs 3.2 (Graphing everything)
Posted: Tue Jun 08, 2021 10:21 am
by Jotne
Here is how I test if
syslog do sends data to Splunk server with IP 192.168.0.50
From a linux server (192.168.0.10) use the following command.
echo '<14>_sourcehost_ messagetext' | nc -v -u -w 0 192.168.0.50 514
Then on the
Splunk web console do a search like this:
or just
You should then from the test server see:
Jun 8 09:14:57 192.168.0.10_sourcehost_ messagetext
If you do see nothing,
syslog may not work, you have some local firewall on the server (iptables)
Re: Tool: Using Splunk to analyse MikroTik logs 3.2 (Graphing everything)
Posted: Tue Jun 08, 2021 12:39 pm
by pixture08
Hi,
I'm not sure how you will test it using Windows Machine. I've tried to set up Splunk on my local PC (with ip of 192.168.0.3), update the mikrotik logserver to that IP and can confirm that I'm getting data from mikrotik. However, if I change to the Windows VM (ip - 32.x.x.x), I didn't receive any syslog. I can confirm that both 8000 and 514 port is open. Firewall was already turned off as well.
Here is how I test if
syslog do sends data to Splunk server with IP 192.168.0.50
From a linux server (192.168.0.10) use the following command.
echo '<14>_sourcehost_ messagetext' | nc -v -u -w 0 192.168.0.50 514
Then on the
Splunk web console do a search like this:
or just
You should then from the test server see:
Jun 8 09:14:57 192.168.0.10_sourcehost_ messagetext
If you do see nothing,
syslog may not work, you have some local firewall on the server (iptables)
Re: Tool: Using Splunk to analyse MikroTik logs 3.2 (Graphing everything)
Posted: Tue Jun 08, 2021 1:15 pm
by Jotne
For Splunk, Linux is the best option, but it works in Windows as well. (Install VmWare Workstation on your Windows and add a Ubuntu 20.04 to use with Splunk.
As far as I know there are no easy way to send udp packets from Windows.
To use NetCat (nc) you need a linux device for testing, it can be a raspberry pi.
You need just for sending data to your Windows Splunk server.
PS no need to quote the whole message above you. Use the Post Reply button below the post.
Re: Tool: Using Splunk to analyse MikroTik logs 3.2 (Graphing everything)
Posted: Tue Jun 08, 2021 1:27 pm
by pixture08
Thank you! I'll try to install a Linux VM instance instead. Very noted on quoting reply as well. Cheers!
Re: Tool: Using Splunk to analyse MikroTik logs 3.2 (Graphing everything)
Posted: Tue Jun 08, 2021 3:35 pm
by pixture08
Hi Jotne,
I tried to test if my VM windows instance cannot received UDP packets from other public ip address using packet sender app. As per testing, I could receive UDP packets (please see attached testing here
https://ibb.co/7QjVH5X). Is there a way to check/troubleshoot the Splunk app? I've tried searching on this and cannot find any best answer :((
Re: Tool: Using Splunk to analyse MikroTik logs 3.2 (Graphing everything)
Posted: Tue Jun 08, 2021 3:49 pm
by Jotne
There has to be something that blocks the UDP packets, or Splunk does not listen on UDP.
Still not sure how you run Splunk. On Windows or on Linux?
If splunk runs on Windows and you have open port 514 in Windows Splunk setup, as an administrator run the following command from CMD
netstat -toan
You should see that your Windows listening on port 514 udp
UDP 0.0.0.0:514
PS Mikrotik app has nothing to do if you receive syslog or not.
To se in Splunk if you get any data, use
search and search for
Try just for test to see internal log on splunk as well
But I do suggest you should install Splunk on Linux as a non root user.
Re: Tool: Using Splunk to analyse MikroTik logs 3.2 (Graphing everything)
Posted: Tue Jun 08, 2021 8:10 pm
by pixture08
I've figured it out and happy to share it to the community!
To people who use Windows VM instance (mine is Windows server 2012 r2)
1. After installing Splunk, it will not automatically listen to UDP port 514
2. to confirm, you need to open a cmd to C:\Program Files\Splunk\bin, then type splunk add udp 514 -sourcetype syslog
3. If Splunk is listening to the said port, it should response with "Listening for port input on the following UDP ports: 514" --> (You're good to go)
4. if you received a response "Splunk is not listening for input on any UDP input." Then proceed reading this.
5. On the same CMD path, encode splunk add udp 514 -sourcetype syslog. It will return a response of "Listening to UDP input on port 514."
Re: Tool: Using Splunk to analyse MikroTik logs 3.2 (Graphing everything)
Posted: Tue Jun 08, 2021 9:42 pm
by Jotne
No need for command line.
If you run Splunk in Windows or as root in Linux (not recommended), you can do:
Settings->Data Inputs->UDP->New Local UDP
Port: 514 -> Next
Select Source Type: Operating system-> Syslog
Review->Submit
Then you should be good to go.
BUT As I do recommend using Linux and not as Root, Splunk it self then can not listen for port < 1024. So that is way in this thread there are a description of to use Rsyslog (listen in udp:514) that gets the data and Splunk reads it log files.
Re: Tool: Using Splunk to analyse MikroTik logs 3.2 (Graphing everything)
Posted: Wed Jun 16, 2021 4:16 pm
by David1234
great guide
I need some first time help
I have done "almost" everything you said
this is what I have done in the login
/system logging action
set 3 remote=192.168.1.0
/system logging
add action=remote prefix=MikroTik topics=account
add action=remote prefix=MikroTik topics=critical
for now I want to see all the login attempts made to my router
I can see in the "MikroTik Admin user login" all the login (good and bad)
so I guess this working , now? right
I have also added the script - but I can't see any data on router voltage\temp
the script in running without any problems - so why I don't see in the the Splunk?
I can't see any other data also in no page - everything is No results found. (even on router uptime, temp\voltage )
why is it?
the accounting is working
/ip accounting
set enabled=yes threshold=2560
do I need to enable something in the firewall so the server can read this data or something ?
**also why do I need to enable the accounting? , the data is send out from the router and not from the Splunk to the router - or I missunderstand soemthing?
Thanks ,
Re: Tool: Using Splunk to analyse MikroTik logs 3.2 (Graphing everything)
Posted: Wed Jun 16, 2021 5:48 pm
by Jotne
Remember with this:
add action=remote prefix=MikroTik topics=account
add action=remote prefix=MikroTik topics=critical
You only get all
account and
critical logs and nothing else from the internal logs.
That is what I do use:
/system logging add action=logserver prefix=MikroTik topics=dhcp
/system logging add action=logserver prefix=MikroTik topics=!debug,!packet,!snmp
/system logging add action=logserver prefix=MikroTik topics=hotspot
This gets all
dhcp logs including debug dhcp packets.
This gets all
hotspot logs including debug hotspot packets.
With the
!, get all other logs that are not
debug,
packet and
snmp.
Voltage and temperature are only on devices that do supports it.
Accounting is used to get all the packet flow from the router to Splunk.
Accounting is gone in v7, so there netflow has to be used. Not implemented in my solution, yet.
Re: Tool: Using Splunk to analyse MikroTik logs 3.2 (Graphing everything)
Posted: Wed Jun 16, 2021 6:02 pm
by David1234
OK
I just saw you answer
I thought that on the RBM33G there is temp\voltage , but now I see there isn't any
:put [/system health get cpu-temperature ]
I can see the device now , I looked somewhere else
so if I want to see only spesific things I can only make logs for them ?
is there any where a WiKi or some explain about what each page can show and how he read it ?
for example -
this is what I get in the Device list
18.14.45.136 Test_Router A2FFFFF71F31 RBM33G RBM33G 6.48.2 (stable) 1
is there any way to change the first IP to some local variable to be sent?
Re: Tool: Using Splunk to analyse MikroTik logs 3.2 (Graphing everything)
Posted: Wed Jun 16, 2021 7:51 pm
by Jotne
You can send anything to logs, in for example this form.
:log info message="This is a test"
Then in splunk you should be able to see this by search for:
Re: Tool: Using Splunk to analyse MikroTik logs 3.2 (Graphing everything)
Posted: Thu Jun 17, 2021 2:59 pm
by David1234
great
I will try to see now what can I do with this
thank you !
*** I will ask if I will have more questions
Re: Tool: Using Splunk to analyse MikroTik logs 3.2 (Graphing everything)
Posted: Sun Jun 20, 2021 1:16 pm
by David1234
more quetsions:
for my testing I only want to be able to see the MikroTik Admin user login block\OK
I have setup a loggin like this:
/system logging action
add name=Splunk remote=12.15.15.14 target=remote
/system logging
add disabled=yes topics=ovpn,debug
add action=DavidServer disabled=yes topics=warning
add action=Splunk prefix=MikroTik topics=account
add action=Splunk prefix=MikroTik topics=critical
when I put a wrong password I can see in the router logs "error login failure for user admin from 8.19.166.6 via winbox"
and on the splunk page I can see the line:
_time	host	user	system	user_ip	eventtype	host_name
2021-06-20 12:56:50	9.13.10.118	admin	winbox	 8.19.166.6	adm_user_login_failure	9.13.10.118
2 questions (help)
why I can't see the name I setup in the identity for this router in the host name \ host user system?
is there any way to make the login send more information ? for example the MAC of the ethernet and put it in the host name?
I'm asing because my devices use dynamic IP - so the router IP give me nothing.
Thanks ,
Re: Tool: Using Splunk to analyse MikroTik logs 3.2 (Graphing everything)
Posted: Sun Jun 20, 2021 11:38 pm
by Jotne
Everything is already logged in menu
Overview ->
MikroTik Admin user login.
There you see both logged inn and blocked user.
You have changed from the default log action setup and do loose a lot of information since you do only log some.
Change back to what is posted inn first post and you get all back.
This one logs all except:
!debug,!packet,!snmp
/system logging add action=logserver prefix=MikroTik topics=!debug,!packet,!snmp
Re: Tool: Using Splunk to analyse MikroTik logs 3.2 (Graphing everything)
Posted: Tue Jun 29, 2021 12:13 pm
by nikc
1st up, amazing effort, love this, so easy to setup and use, thank you.
I have a question though ....
A lot of my nodes are LTE based devices, so they tend to change IP address quite frequently and as a result of that if i want to look at traffic utlisiation for the device, i need to collate all the stats from the various IPs.
Is there any way to aggregate the data at hostname level opposed to IP ?
Thanks
Re: Tool: Using Splunk to analyse MikroTik logs 3.2 (Graphing everything)
Posted: Tue Jun 29, 2021 6:58 pm
by Jotne
The app do use IP as hostname and do sort everything after that, so when IP changes, it will see it as a new device.
What can be done is to tag all packed with an id so that all router can be identified even after IP change.
Example, change from:
/system logging add action=logserver prefix=MikroTik topics=dhcp
/system logging add action=logserver prefix=MikroTik topics=!debug,!packet,!snmp
/system logging add action=logserver prefix=MikroTik topics=hotspot
To:
add action=logserver prefix="MikroTik: sys=22" topics=dhcp
add action=logserver prefix="MikroTik: sys=22" topics=!debug,!packet
add action=logserver prefix="MikroTik: sys=22" topics=hotspot
Use different number or name for the
sys to distinguish each ruter.
Take care not use to long ID, since it eats of the max packet size.
Then you need to adapt the Splunk app to use
sys instead of
host
Its some work to do, but it will give you separate logs for each router based by the sys name.
Re: Tool: Using Splunk to analyse MikroTik logs 3.2 (Graphing everything)
Posted: Mon Jul 05, 2021 9:50 am
by David1234
another question
I notice that my all my device are sending data to another syslog system
so I have connected to the log file of it and sendting the data to the Splunk
it's working - I get the data - but not as mikrotik (just as regular udp syslog )
is there anything I can change in the setting of the Splunk-Mikrotik to read that data?
this is what I'm getting on the splunk :
SEVERE 05/07 06:24:06 wrong message: 3.13.12.118 <27>Jul 5 09:24:06 Router script error: error - contact MikroTik support and send a supout file (2)
can I change the reading somehow so it will enter the splunk as Mikrotik ?
Thanks ,
Re: Tool: Using Splunk to analyse MikroTik logs 3.2 (Graphing everything)
Posted: Mon Jul 05, 2021 2:01 pm
by Jotne
If I understand you, you do not get the "
MikroTik" prefix?
system,info,account MikroTik: sys=22: user hidden logged out from 1.2.3.4 via winbox
The whole app with field extraction etc are based on this tag, so If that changes or are removed, lots of the stuff inn the app must be rewritten.
Possible, but you need to try to figure it out.
Re: Tool: Using Splunk to analyse MikroTik logs 3.2 (Graphing everything)
Posted: Wed Jul 28, 2021 7:32 am
by eb123456
Thank you so much Jotne this is an amazing tool you put together!
I am new to Mikrotik, just got the router 2 weeks ago.
I am wondering how you guys get the hostname to show in the screenshots? I have the IP address instead?

Re: Tool: Using Splunk to analyse MikroTik logs 3.2 (Graphing everything)
Posted: Wed Jul 28, 2021 2:54 pm
by jvanhambelgium
Thank you so much Jotne this is an amazing tool you put together!
I am new to Mikrotik, just got the router 2 weeks ago.
I am wondering how you guys get the hostname to show in the screenshots? I have the IP address instead?
My Splunk host (=VM) just resolves these.
If you have a rather "static" small home-network, just add them to /etc/hosts or something on the Splunk host so your internal entries are resolved too.
If you run a Pihole or other DNS internal just let Splunk use that one and add the entries over there.
Re: Tool: Using Splunk to analyse MikroTik logs 3.2 (Graphing everything)
Posted: Wed Jul 28, 2021 6:34 pm
by Jotne
I am wondering how you guys get the hostname to show in the screenshots? I have the IP address instead?
Some scripts run only once every day, so if you wait one day, it should be ok.
PS post image on the forum using Attachements below the post instead of posting a link.
Re: Tool: Using Splunk to analyse MikroTik logs 3.2 (Graphing everything)
Posted: Thu Jul 29, 2021 5:56 am
by eb123456
Thank you editing the /etc/hosts does provide immediate name resolution.
I need to do some digging though: on the splunk host I seem to be experiencing local DNS issues:
me@docker01:~/scripts$ host 192.168.88.24
Host 24.88.168.192.in-addr.arpa. not found: 3(NXDOMAIN)
me@docker01:~/scripts$ ping DESKTOP-MESF01
ping: DESKTOP-MESF01: Temporary failure in name resolution
me@docker01:~/scripts$ ping DESKTOP-MESF01.local
PING DESKTOP-MESF01.local (192.168.88.24) 56(84) bytes of data.
Re: Tool: Using Splunk to analyse MikroTik logs 3.2 (Graphing everything)
Posted: Thu Jul 29, 2021 8:35 am
by jvanhambelgium
Ah ok, you run Splunk in a container.
DNS resolving in a container is slightly different so I read. Perhaps you could try info below ?
On linux systems, DNS resolution happens using /etc/resolv.conf file, check this file inside your container, if it has invalid DNS, then your container won't be able to resolve hostnames.
Docker uses a property set in /etc/docker/daemon.json file(on host) for populating entries in /etc/resolv.conf inside container.
update the value of this property in /etc/docker/daemon.json file in host machine:
{
"dns": ["8.8.8.8"]
}
Note: This change requires restarting docker to take effect, also existing containers have to be removed and created again.
Restarting Docker:
sudo systemctl restart docker
removing containers:
sudo docker stop <container-name/id>
sudo docker rm <container-name/id>
Re: Tool: Using Splunk to analyse MikroTik logs 3.2 (Graphing everything)
Posted: Fri Jul 30, 2021 1:33 am
by eb123456
oh I should have mentioned that the command line output I shared were directly from the docker host that runs the docker container. The DNS issues materialize on the physical machine and for some reasons name resolution only happen with the .local domain.
Anyway - I did not figure it out yet, but I am happy with the /etc/hosts solution. I actually find it better than DNS resolution because I can give more friendly name to my devices.
For those who are contemplating running splunk in docker, here is my script:
docker stop splunk-server
docker rm splunk-server
docker run -d \
-p 8000:8000 \
--name splunk-server \
-v /data/syslog/udp:/data/syslog/udp \
-v /data/syslog/tcp:/data/syslog/tcp \
-v /data/splunk/etc:/opt/splunk/etc \
-v /data/splunk/var:/opt/splunk/var \
-v /etc/localtime:/etc/localtime:ro \
-v /etc/hosts:/etc/hosts:ro \
-v ~/conf/input.conf:${SPLUNK_HOME}/etc/apps/MikroTik/default/input.conf \
-e SPLUNK_START_ARGS='--accept-license' \
-e SPLUNK_PASSWORD='XXXXXXXXXXX' \
--restart always \
splunk/splunk:latest
Re: Tool: Using Splunk to analyse MikroTik logs 3.2 (Graphing everything)
Posted: Fri Aug 13, 2021 8:18 am
by Jotne
# Script version 4.4
# 4.4 Removed on-error from wifi
# 4.4 Removed on-error from board info
Some small changes to error handling, no need for upgrade.
Re: Tool: Using Splunk to analyse MikroTik logs 3.3 (Graphing everything)
Posted: Fri Aug 13, 2021 12:17 pm
by Jotne
Splunk for MikroTik updated to v3.3
New file found under section 1g) at the first post
This version contains lots of tweaks and fixes, and some new KV store
To upgrade, delete the folder /splunk/etc/app/Mikrotik
Then install the unpacked spl (use winrar/winzip) file, install app from
"Manage app" -> "Install app from file"
To get the most out of this version, upgrade the script (not needed) on the router to latest version. (3.9+)
# 3.3 (13.08.2021)
# New KV store (used to store info about Devices and DHCP info
# Changed from table to fields in base search for all dashboard to speed up searches.
# Added more DNS extraction
# Updated script to 4.4 (Added firmware info)
# Added frimware info "MikroTik Device List"
# Fixed lookup "MikroTik Wifi strength"
# Added new DoH dashboard "MikroTik DoH information"
# Change table format "MikroTik Interface Changes"
# Fixed typo in eventtype "MikroTik VPN Connections"
# Added user local ip "MikroTik VPN Connections"
# Fixed missing search in 2b, duplicate entry in user-name, added 1b login info "MikroTik VPN Connections"
# Fixed to not show false logged in user "MikroTik VPN Connections"
# Fixed html formatting in "Mikrotik DHCP to Static"
# Fixed missing City in "Mikrotik Firewall Rules"
# Moved "Mikrotik uPnP" to Connections menu
# Added table view to "Mikrotik uPnP"
Re: Tool: Using Splunk to analyse MikroTik logs 3.3 (Graphing everything)
Posted: Fri Aug 13, 2021 1:41 pm
by jvanhambelgium
Thanks for the update Jotne.
I seems I've lost data on the "Overview" > "Device List" is not populating (as in "no result found")
All other tabs seems to work find, data is still coming in normally.
I'm running it on a RB3011 / 6.47.x release
If I look in the output on the console while the script is running, I'm only seeing this line : " script=version ver=4.4" where I normally would need to see more like
:log info message="script=sysinfo version=\"$version\" board-name=\"$board\" model=\"$model\" serial=$serial identity=\"$identity\" factory-firmware=\"$ffirmware\" current-firmware=\"$cfirmware\" upgrade-firmware=\"$ufirmware\""
The previous script had this section
# Collect system information
# ----------------------------------
:local model
:local serial
if ($SystemInformation and $run) do={
:local version ([/system resource get version])
:local board ([/system resource get board-name])
:do {
:set model ([/system routerboard get model])
:set serial ([/system routerboard get serial-number])
} on-error={
:set model na
:set serial na
}
:local identity ([/system identity get name])
:log info message="script=sysinfo version=\"$version\" board-name=\"$board\" model=\"$model\" serial=$serial identity=\"$identity\""
}
While you new script has this one
# Collect system information
# ----------------------------------
:local model na
:local serial na
:local ffirmware na
:local cfirmware na
:local ufirmware na
:if ($SystemInformation and $run) do={
:local version ([/system resource get version])
:local board ([/system resource get board-name])
:if ([/system routerboard get routerboard]) do={
/system routerboard
:set model ([get model])
:set serial ([get serial-number])
:set ffirmware ([get factory-firmware])
:set cfirmware ([get current-firmware])
:set ufirmware ([get upgrade-firmware])
}
:local identity ([/system identity get name])
:log info message="script=sysinfo version=\"$version\" board-name=\"$board\" model=\"$model\" serial=$serial identity=\"$identity\" factory-firmware=\"$ffirmware\" current-firmware=\"$cfirmware\" upgrade-firmware=\"$ufirmware\""
}
Re: Tool: Using Splunk to analyse MikroTik logs 3.3 (Graphing everything)
Posted: Fri Aug 13, 2021 4:07 pm
by rextended
If I can, I want suggest something...
list is from -> to
:local hour [:pick ([/system clock print as-value ]->"time") 0 2]
:local hour [:pick [/sys clock get time] 0 2]

	:foreach logline in=[/ip firewall nat find dynamic=yes] do={
	:foreach logline in=[/ip firewall nat find where dynamic=yes and comment~"^upnp "] do={

	:if (([/system health get]~"state=disabled" || [/system health get]="")=false) do={
	:if (!([/system health get]~"(state=disabled|^\$)")) do={
Re: Tool: Using Splunk to analyse MikroTik logs 3.3 (Graphing everything)
Posted: Fri Aug 13, 2021 4:47 pm
by Jotne
@ jvanhambelgium
Some script runes only once a day and since some part is changed to use KV store, it may take a day before all is populated.
Re: Tool: Using Splunk to analyse MikroTik logs 3.3 (Graphing everything)
Posted: Fri Aug 13, 2021 5:01 pm
by Jotne
:foreach logline in=[/ip firewall nat find where dynamic=yes and comment~"^upnp "] do={
This I do not understand. Can there be other dynamic nat than upnp lines, and why should I include the comments test.
Other line are fine, thanks
Re: Tool: Using Splunk to analyse MikroTik logs 3.3 (Graphing everything)
Posted: Fri Aug 13, 2021 5:13 pm
by rextended
the comment can distinguish the upnp rules from the other dynamics
yes, dynamic SMTP from HotSpot, and other related dynamic hotspot rules, walled garden rules, etc.
for example
print code
/ip firewall nat> pri
Flags: X - disabled, I - invalid, D - dynamic
 0  D chain=dstnat action=jump jump-target=hotspot hotspot=from-client

 1  D chain=hotspot action=jump jump-target=pre-hotspot

 2  D chain=hotspot action=redirect to-ports=64872 protocol=udp dst-port=53

 3  D chain=hotspot action=redirect to-ports=64872 protocol=tcp dst-port=53

 4  D chain=hotspot action=redirect to-ports=64873 protocol=tcp hotspot=local-dst dst-port=80

 5  D chain=hotspot action=redirect to-ports=64875 protocol=tcp hotspot=local-dst dst-port=443

 6  D chain=hotspot action=jump jump-target=hs-unauth protocol=tcp hotspot=!auth

 7  D chain=hotspot action=jump jump-target=hs-auth protocol=tcp hotspot=auth

 9  D chain=hs-unauth action=return dst-address=179.44.232.13

10  D ;;; www.paypal.com
      chain=hs-unauth action=return dst-address=2.17.140.171

11  D ;;; www.paypal.com
      chain=hs-unauth action=return dst-address=2.20.40.117
[...]
Re: Tool: Using Splunk to analyse MikroTik logs 3.3 (Graphing everything)
Posted: Fri Aug 13, 2021 5:18 pm
by rextended
another hint:
# from
        :set ( $array->$listname ) 1
[...]
    :foreach k,v in=$array do={


# to
        :if (!($array ~ $listname)) do={ :set array ($array , $listname) }
[...]
    :foreach k in=$array do={
# only k without v
Re: Tool: Using Splunk to analyse MikroTik logs 3.3 (Graphing everything)
Posted: Fri Aug 13, 2021 5:34 pm
by rextended
WARNING: BREAKED COMPATIBILITY
missing : before some occurrences of if
(no matter is missing on root, but better if you put : on every if also on root to be sure...)
	if ([/ip accounting get enabled]=yes) do={

		if ($listdynamic = true) do={

		if ($i = $cmd) do={:set $f 1}
		if ($f<>1) do={
		foreach logline in=[/ip accounting snapshot find] do={

	foreach i in=[/system history find] do={
Re: Tool: Using Splunk to analyse MikroTik logs 3.3 (Graphing everything)
Posted: Fri Aug 13, 2021 6:31 pm
by rextended
anoter two fix:
replace all this
:do {
    :if ([:len [/caps-man registration-table find]] > 0 and $CAPsMANN) do={

    }
} on-error={}
with only this
:if ( ([:len [/interface find where type="cap"]] > 0) and $CAPsMANN) do={ /system script run capsman }
and replace all this
:do {
} on-error={
    :if ([:len [/system ntp client get last-update-from]]>0) do={
        :log info message="script=ntp status=synchronized"
    } else={
        :log info message="script=ntp status=not-synchronized"
    }
}
with this:
:local ntpstatus ""
:if ([:len [/system package find where !disabled and name=ntp]] > 0) do={
    :set ntpstatus [/system ntp client get status]
} else={
    :if ([:typeof [/system ntp client get last-update-from]] = "nil") do={
        :set ntpstatus "using-local-clock"
    } else={
        :set ntpstatus "synchronized"
    }
}
:log info message="script=ntp status=$ntpstatus"
Re: Tool: Using Splunk to analyse MikroTik logs 3.3 (Graphing everything)
Posted: Fri Aug 13, 2021 7:24 pm
by rextended
I do not check (for now) the "Collect DHCP Pool information" because is really complicated and I must have more time.
I hope you like my effort to help you

Re: Tool: Using Splunk to analyse MikroTik logs 3.3 (Graphing everything)
Posted: Fri Aug 13, 2021 9:24 pm
by Jotne
I do own you several beers for helping out

DHCP part is the only part I have taken from some other
Added all parts to the script. Even found some local variable without :
Not 100% sure on what I do with the uPnP script. One option is to use your solution, other is to rename Dashboard to Dynamic NAT, and to show all types of NAT added to the Router. Do the other dynamic nat has comment set?
Comments for dynamic nat are some strange. In Winbox overview, you do see the comment, but when you open a rule, the comment button is missing and you can not see the comment.
/ip firewall nat print does not show to command for dynamic lines.
Re: Tool: Using Splunk to analyse MikroTik logs 3.3 (Graphing everything)
Posted: Fri Aug 13, 2021 9:56 pm
by rextended
Very thanks for the beers
I just notice also one :do without the : , :set variable with $ in front of variable, and what you already have noticed for global and local
apparently new routeros 6.48+ ignore if the : are present or not, but previous version get an error when the script is on "subdirectory" like "/ip address" and : are omitted.
# *** missing : on do {
# Get uncounted data
		do {
			/ip accounting uncounted {

# *** remove $ from first $value in front of ":set"
				:set $value [:pick $value 0 $newline]
I rewrite this directly, too much errors
:if ([:tonum [:pick [/system resource get version] 0 1]] > 6 and $CmdHistory) do={
#       v missing : on both global and local
	:global cmd
	:local f 0
	:foreach i in=[/system history find] do={
#               v missing : on both if    v removed $ from $f
		:if ($i = $cmd) do={ :set f 1 }
#               v       v replaced <> with != but not really an error if v7 accept <>
		:if ($f != 1) do={
			:log info message="StartCMD"
			:log info message=[/system history get $i]
			:log info message="EndCMD"
		}
	}
#       v missing :          v missing /
	:global cmd  [:pick [/system history find] 0]
}
About the dynamic NAT, can be one from 3 types:
this match upnp rule because all upnp rule are "upnp <MACHINE-IP>: <SERVICE>" real example: "upnp 192.168.0.163: DIRECT_REVERSE_SERVER"
[/ip firewall nat find where dynamic=yes and comment~"^upnp "]
this match dynamic rules added from hotspot
[/ip firewall nat find where dynamic=yes and chain="hotspot"]
this match dynamic rules added from walled garden
[/ip firewall nat find where dynamic=yes and chain="hs-unauth"]
