It's clear that the 2 Github examples of dashboard have some errors in them.
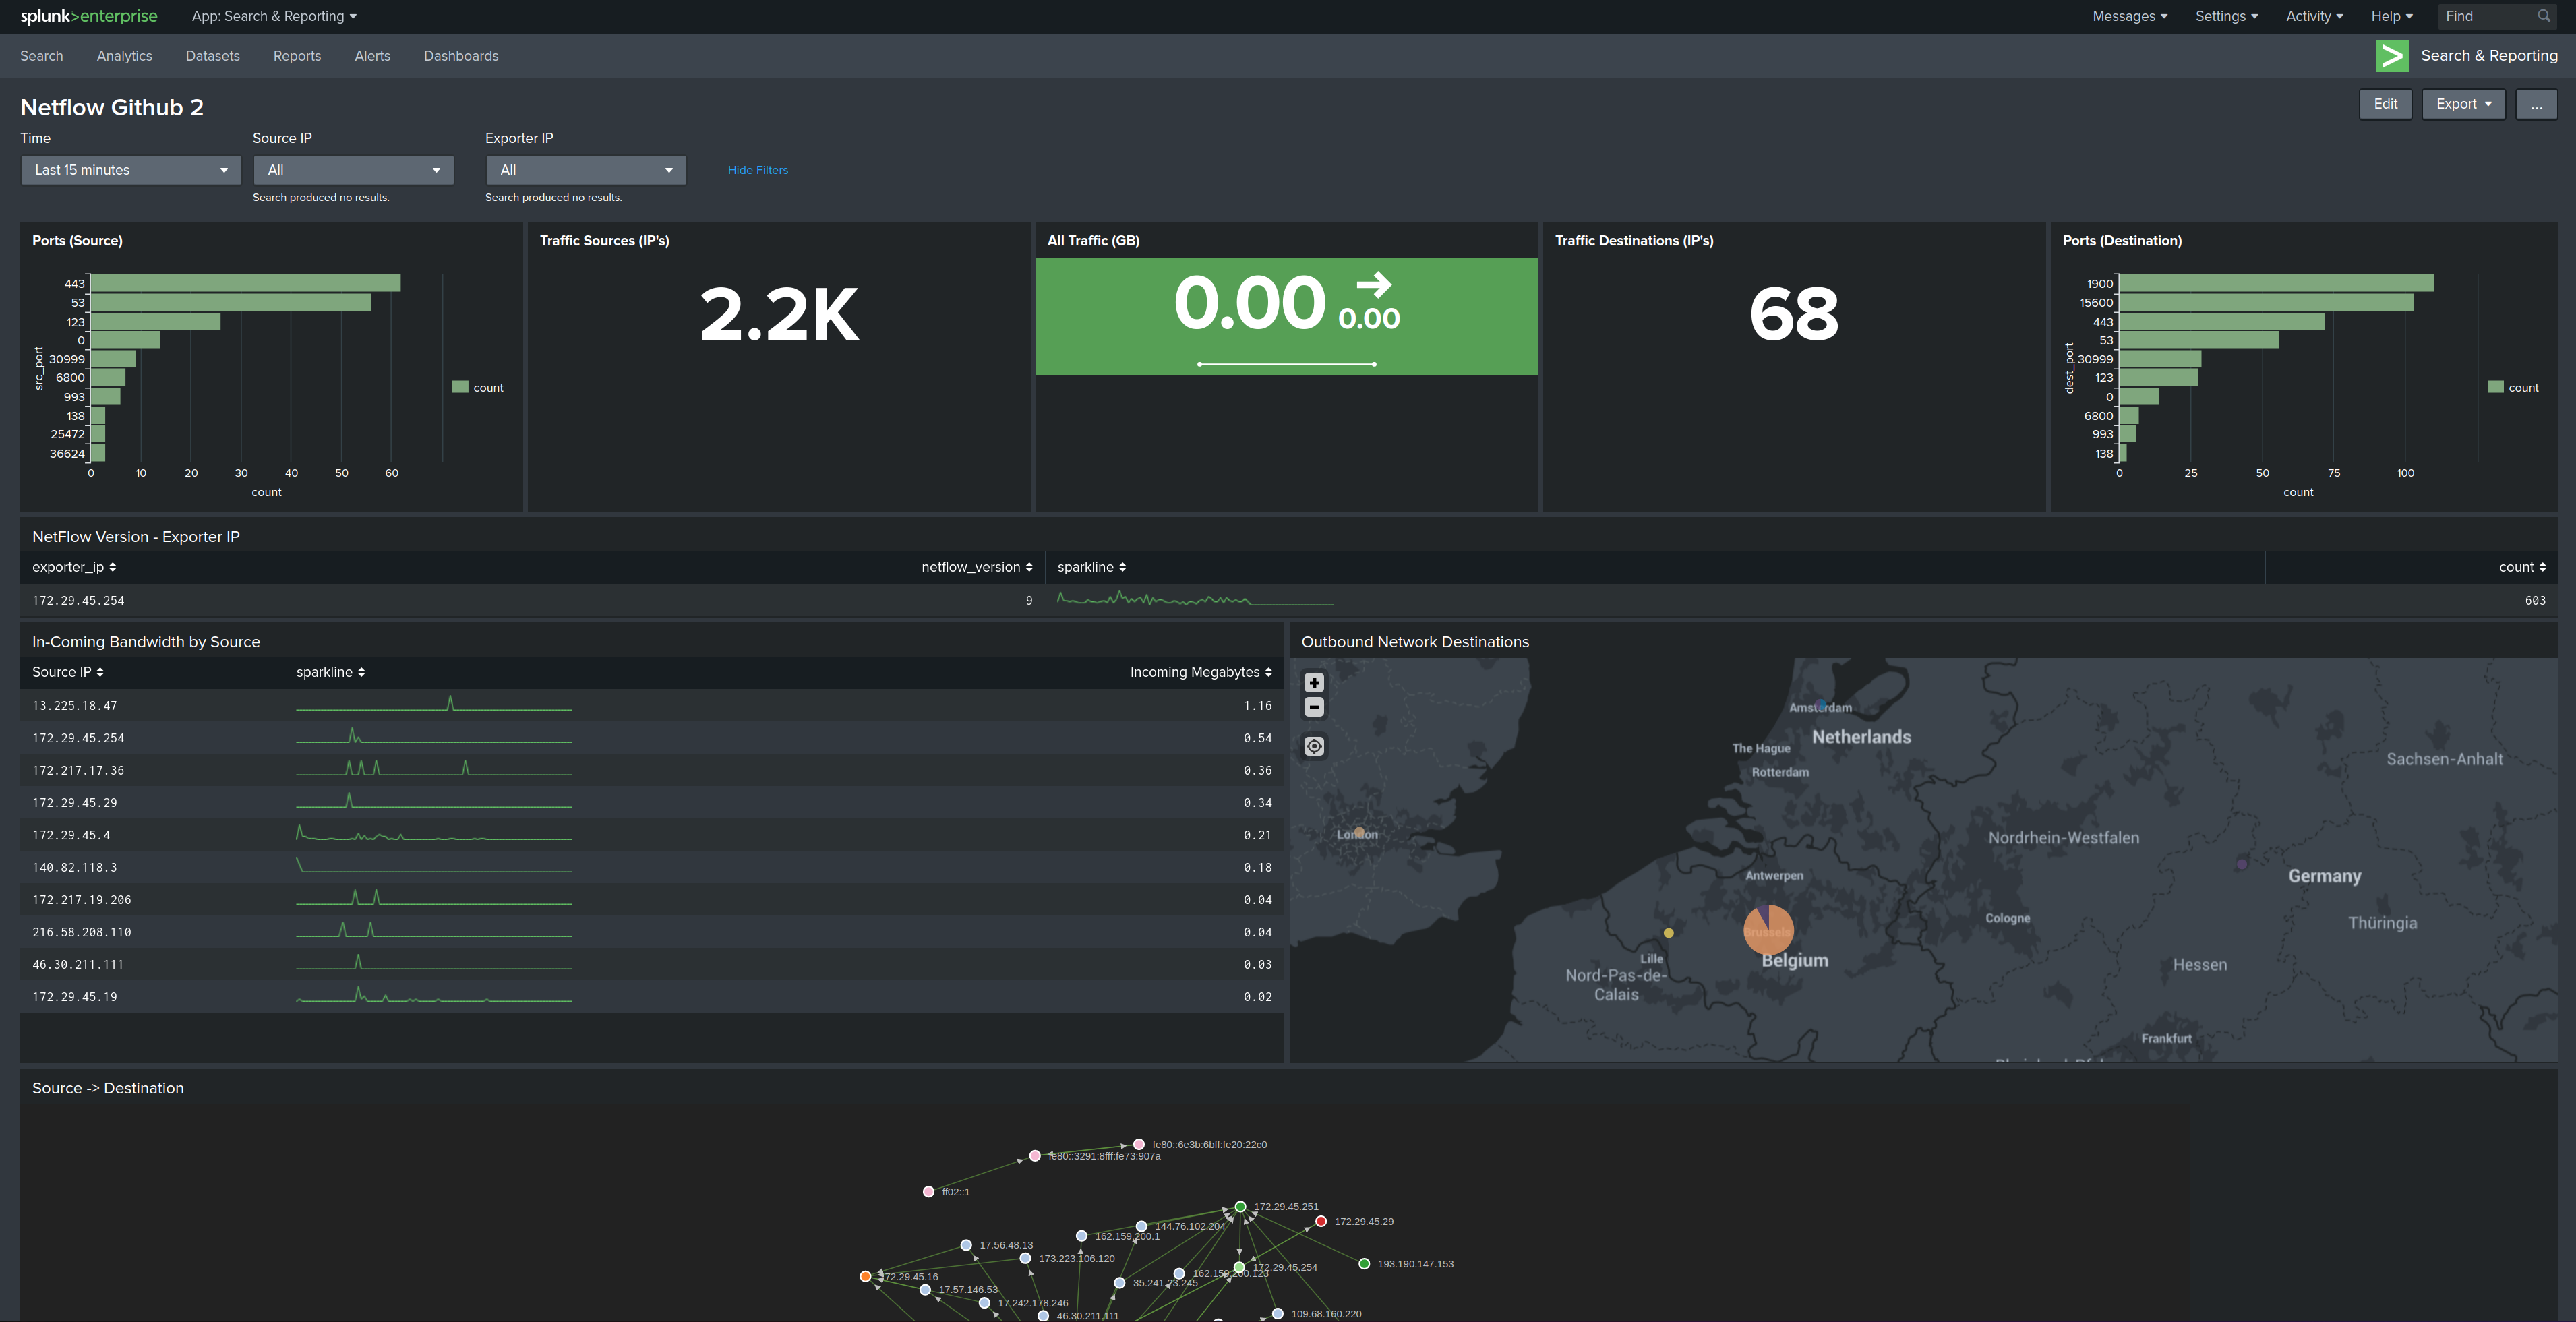
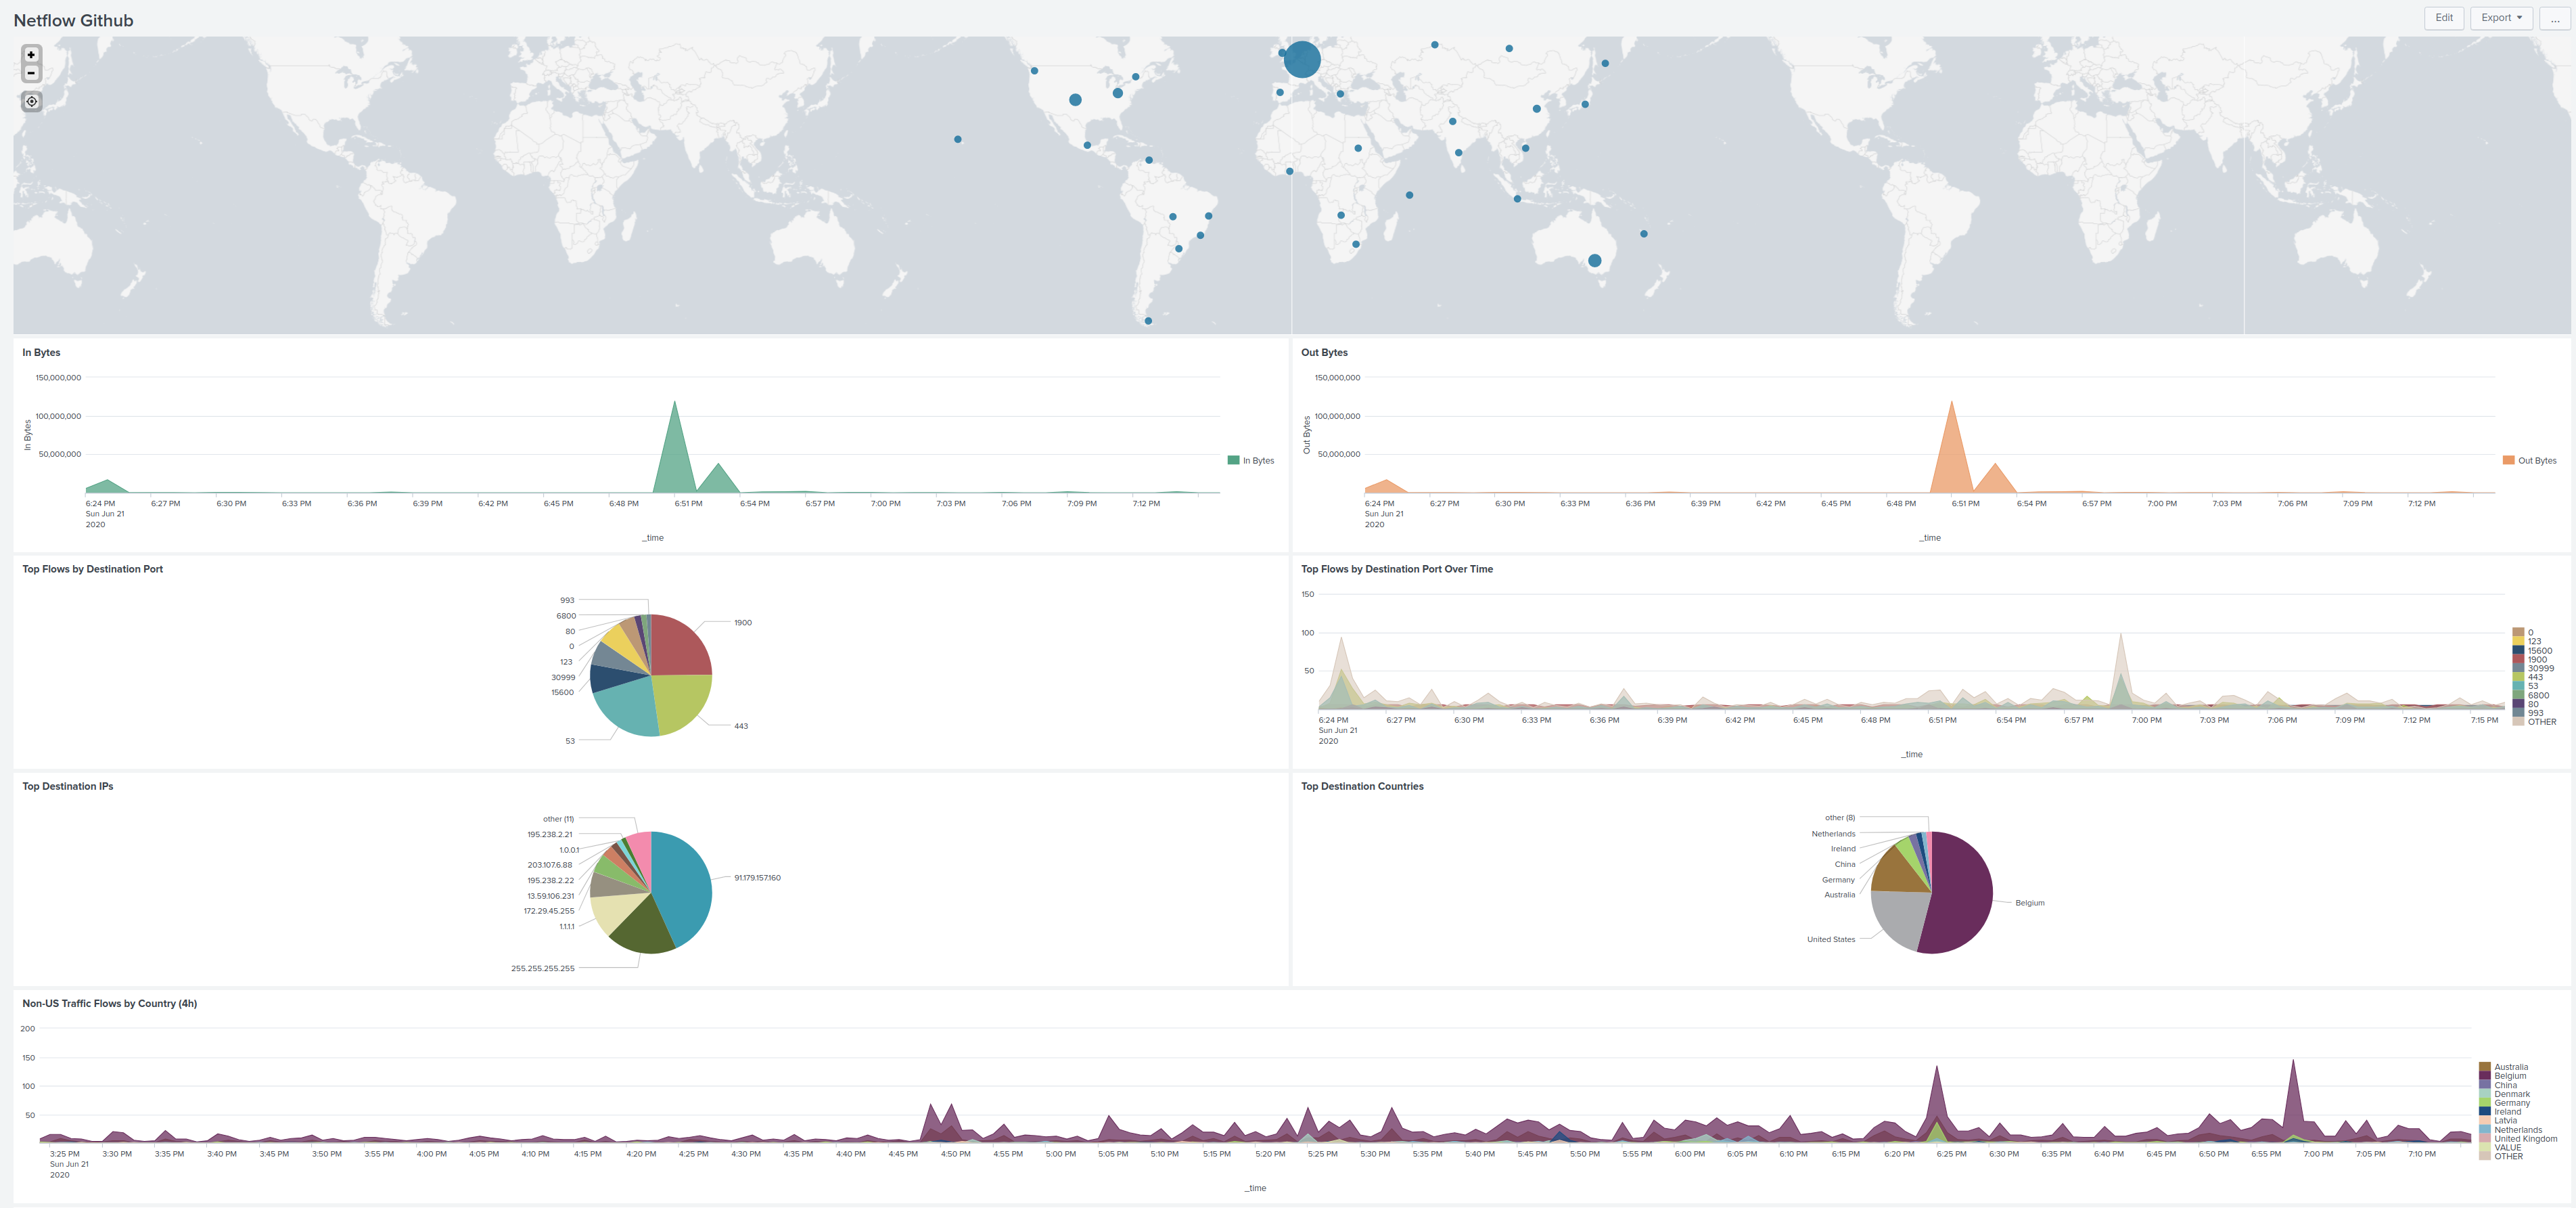
Example the one with a pie-graph "Top Destination IP's" I see large chunck that has MY own public IP address which does not make sense and this is because of NAT and just returning traffic.
Sure the "dest_ip" field in the packets IS my Mikrotik public IP, but logic should be there to know that Splunk should not look at it in this context.
Splunk can "learn" what the public/NAT IP is by comparing "dest_ip' with "nexthop_addr" . If you find any records where these 2 are the same, then store the "dst_ip" value because that is a public IP used for NA(P)T.
Then later you can make sure you exclude this because it does not contribute to the aspect of "top
destination IP's" (for calculating VOLUMES you obviously need this in some way, as a large chunck of return traffic hits this public IP, but then the "nexthop_addr" will reveal the real internal host to which this traffic belongs). IF the "nexthop_addr" = "dst_ip" AND src_ip =! RFC1918 space then this traffic is destined for Mikrotik itself (DNS lookups, IPSEC tunnels traffic etc) but for VOLUMES should be counted too actually.
I'm not 100% with my above claim but it looks like it, I only don't know how to pull this off in Splunk ;-(
I'm going to check if I can find some Splunk expertise within my company to ask some questions on this. I know we do, only not sure they are willing to help out
 EDIT
EDIT : My statement is NOT correct at all ... back to the drawing board...
EDIT2 : Wouldn't it be simpler to extended your script and obtain the IP-addresses associated with interfaces (eg. PPPoE or others) and get them into Splunk ? In addition, the pre-req could be that users must add the keyword "WAN" on the interface-description to you know directly what is the external/outside interface. That is not really THAT much of a problem I guess since your script requires some modifications/config anyway. This is easy for everyone.
Another pre-req could be Netflow should only be activated on the WAN-interface. Let's keep it simple to start with.
Once there you can obtain the current "WAN" interface-IP my making the query in Splunk at least you don't need to SNMP interface-ID stuff anymore?. Any record with dst_ip = WAN-IP is clearly "inbound" (could be DNAT portmapping traffic but also regular returning packets from an inside started session, doesn't matter for accounting purposes just count the bytes in a given time).
Then also you can count everything =! (NOT) equal to the WAN-IP and this will give you "upload" traffic. If you want to "split" traffic generated by Mikrotik add the "src_ip=WAN_IP" to the query.
So suppose WAN=92.178.157.120
Eg. source="stream:netflow" dest_ip!="92.178.157.120" src_ip="92.178.157.120" => For my dataset this returns packets related to EGRESS activity Mikrotik itself, so DNS/IPSEC/DDNS/NTP updates and I also got hits on an IP SMTP of my provider when Mikrotik sends out MAIL.
This can be added to the package of other EGRESS traffic (caused by internal hosts) that can be found with.
source="stream:netflow" dest_ip!="92.178.157.120" src_ip!="92.178.157.120" and cross-checking with the retrieved "src_ip" list only list "internal" hosts indeed.
So these combined would be total OUTPUT on the link I guess.
For INBOUND/DOWNLOAD, the logic is a bit different.
source="stream:netflow" dest_ip="92.178.157.120" nexthop_addr="92.178.157.120" gives me only records with src_ports like DNS/NTP/IPSEC to for sure traffic inbound to the Mikrotik. Pretty sure DNAT would go also under this. (need to test this)
And then finally the "bulk" of download traffic coming back from Internet for clients on the local LAN would be
source="stream:netflow" dest_ip="92.178.157.120" nexthop_addr!="92.178.157.120" => When I make this query my nexthop_addr list only contains all my LAN-stations receiving this returning traffic.
That would take care of an "accounting" alternative I guess for Inbound/Outbound at a high level.