Page 1 of 1
Interfaces monitoring
Posted: Thu May 23, 2019 9:12 pm
by leostereo
Hi guys.
Im setting a new monitoring platform.
Since most of device we have are mikrotik we decided to go with the dude.
Here is my question:
I would like to set a dashboard view where I can quickly see 4 or 6 traffic graphs , something like cacti does.
So , generally I would like to know how to properly monitor traffic / interface statistics on the dude.
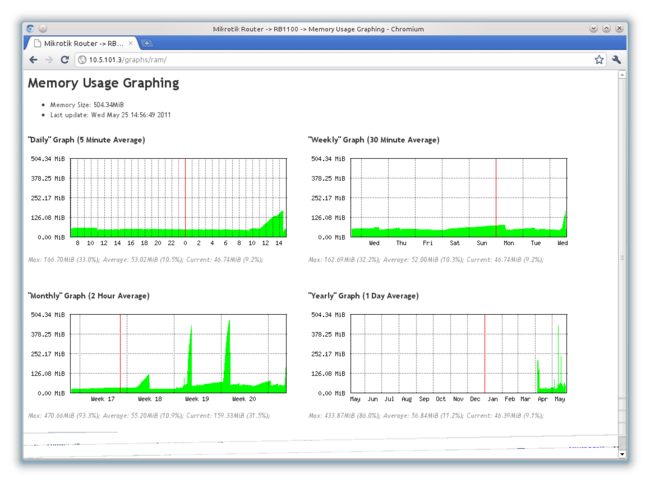
So far I succeeded creating a link and I can see traffic info, but I need to click on it so:
It would be great to monitor interface statistics directly on the device without creating a link, how to do it ?.
Can I create a view with a bunch of monitored interface statistics ? like a kpi section.
Re: Interfaces monitoring
Posted: Thu May 23, 2019 11:32 pm
by maxsaf
Re: Interfaces monitoring
Posted: Fri May 24, 2019 6:29 pm
by leostereo
Dear Maxsaf.
Thanks for your response.
I toke a look to the tool you mentioned.
This graph you mentioned is hosted on the device , please correct me if im wrong.
It is not good for production device.
I would like to manage graphs from multiple devices from a centralized platform like cacti.
I found on the dude the charts section , it seems very nice to create graphs , but here I can not create a grid of charts to have a kpi dashboard.
I will keep looking for.
Thanks.
Re: Interfaces monitoring [SOLVED]
Posted: Sun May 26, 2019 10:12 pm
by ingdaka
Yes graph is hosted on device only!
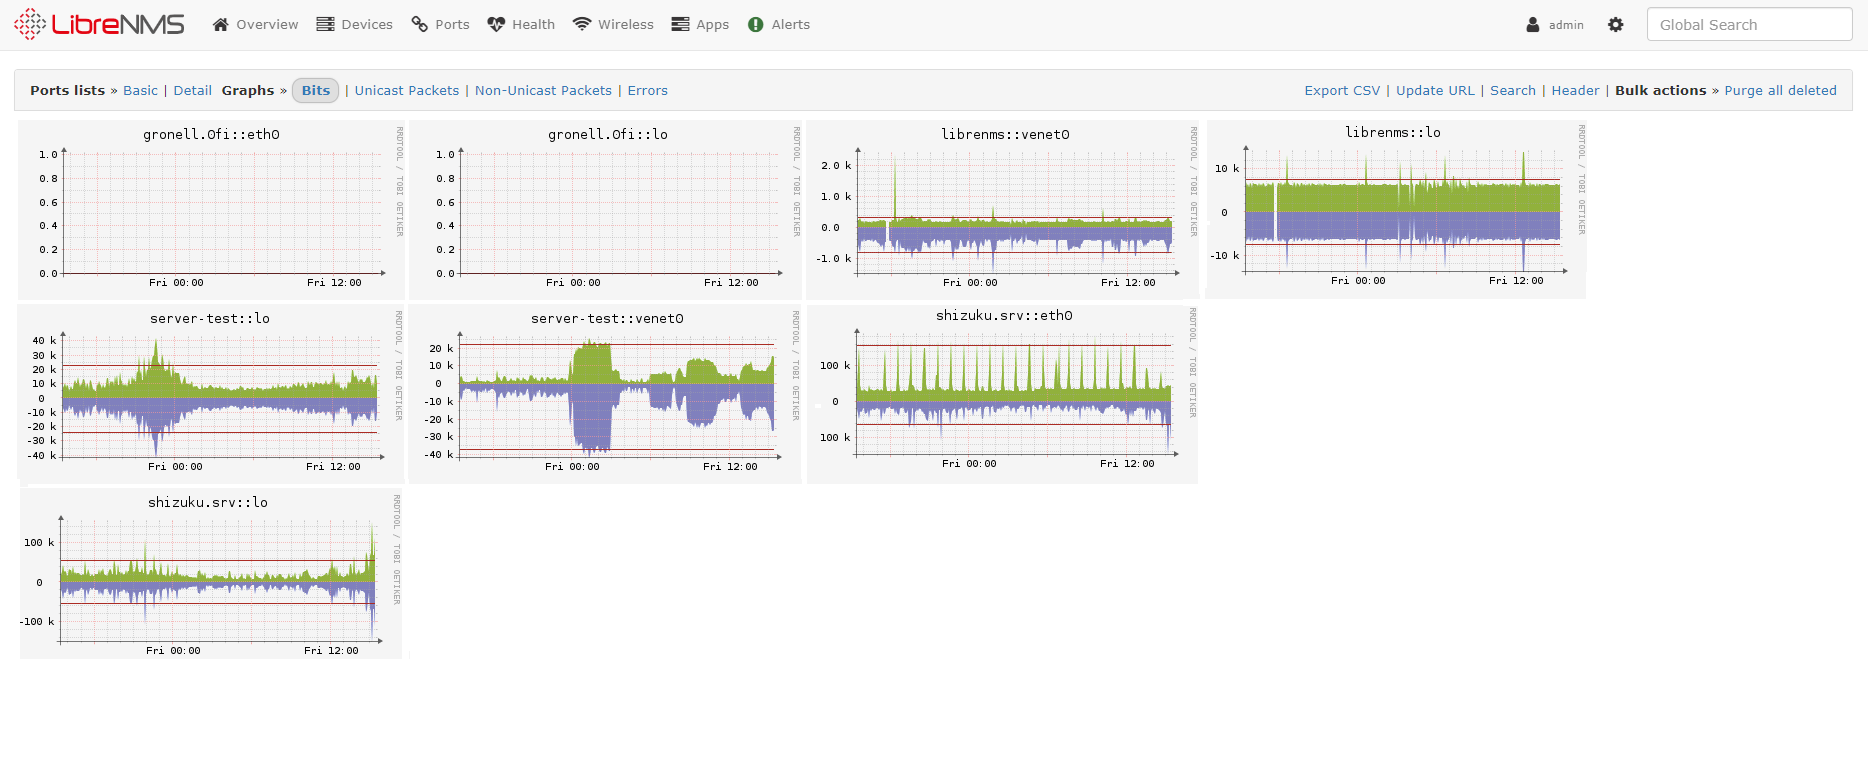
In my company I use Observium, free PHP tool that is automatic discovery with SNMP. Is great to see traffic, discovery, map, processor, ram, storage and all others!
All device types supported and most of all, it's open source and you can modify it in your needs! Also you can create checkers to send e-mail notification for events, like high cpu / ram usage etc.
http://demo.observium.org/
http://www.observium.org/
Re: Interfaces monitoring
Posted: Mon May 27, 2019 5:24 pm
by maxsaf
I would like to manage graphs from multiple devices from a centralized platform like cacti.
Based on my own experience MT devices are not very good with SNMP. I was compared SNMP vs RouterOS API so on SNMP graph i see gaps, RouterOS graphs looks much better. The DUDE supports both SNMP and RouterOS API. Also Zabbix monitoring system has ROS API plugin, but i had no chance to test it.
I can not create a grid of charts
This graph you mentioned is hosted on the device
I guess you can create one html page with frames and put all graphs from different devices to one web page.
Re: Interfaces monitoring
Posted: Mon May 27, 2019 9:48 pm
by ingdaka
You can check Observium live on Mikrotik here, is my environment:
http://171.22.151.3/
Credentials: demo/public
There are 3 Mikrotik Devices 1 used as internal DHCP Server and CAPsMAN, 1 run as central router with DHCP Server and CAPsMAN and last one is a CCR that is used as PPPoE Server for approximately 350 clients!
Re: Interfaces monitoring
Posted: Wed May 29, 2019 8:32 pm
by maxsaf
To ingdaka:
3 devices, 76 ports total? CooI.
have 3658 devices at The Dude with Up to 1000 Clients on some PPPoE servers

What is difference between non-100%-free Observium and free LibreNMS?

Re: Interfaces monitoring
Posted: Thu Oct 31, 2019 5:49 pm
by yabdali
You can check Observium live on Mikrotik here, is my environment:
http://171.22.151.3/
Credentials: demo/public
There are 3 Mikrotik Devices 1 used as internal DHCP Server and CAPsMAN, 1 run as central router with DHCP Server and CAPsMAN and last one is a CCR that is used as PPPoE Server for approximately 350 clients!
Hi, can you share again the link to the demo site for Observium please? The IP address you provided in the previous post doesnt seem to be working. I am looking at Observium or LibreNMS to replace Zabbix for SNMP monitoring. Thanks in advance...
Re: Interfaces monitoring
Posted: Thu Oct 31, 2019 5:52 pm
by yabdali
To ingdaka:
3 devices, 76 ports total? CooI.
have 3658 devices at The Dude with Up to 1000 Clients on some PPPoE servers
What is difference between non-100%-free Observium and free LibreNMS?
How is LibreNMS vs Observium in terms of monitoring Mikrotik devices (RB4011) and Cap AC with Capsman? I have also some NAS devices and IP Cameras that I am intending to monitor which are currently monitored by Zabbix.
Re: Interfaces monitoring
Posted: Thu Oct 31, 2019 10:29 pm
by ingdaka
http://171.22.151.100:8000/
User/Password = demo/public
This user has access only to some random and different vendors of devices!
Re: Interfaces monitoring
Posted: Thu Oct 31, 2019 10:34 pm
by ingdaka
To ingdaka:
3 devices, 76 ports total? CooI.
have 3658 devices at The Dude with Up to 1000 Clients on some PPPoE servers
What is difference between non-100%-free Observium and free LibreNMS?
I have never tried LibreNMS but It looks like a commercial version based in Observium!
Using Observium since 6 years now and I'm very conform since now other thing is that I've integrated Observium with phpIPAM (
https://phpipam.net/) and with phpweathermap too! So I have an invertory of my IPs and a map of network with snmp monitoring!
Re: Interfaces monitoring
Posted: Sat Nov 02, 2019 1:52 am
by yabdali
Thanks alot for sharing, looks nice. I may download a VM to try it.
Re: Interfaces monitoring
Posted: Sat Nov 02, 2019 1:55 am
by yabdali
To ingdaka:
3 devices, 76 ports total? CooI.
have 3658 devices at The Dude with Up to 1000 Clients on some PPPoE servers
What is difference between non-100%-free Observium and free LibreNMS?
I have never tried LibreNMS but It looks like a commercial version based in Observium!
Using Observium since 6 years now and I'm very conform since now other thing is that I've integrated Observium with phpIPAM (
https://phpipam.net/) and with phpweathermap too! So I have an invertory of my IPs and a map of network with snmp monitoring!
Well, according to what I read its a fork of Observium but totally open-source with some features (alerts) that comes out of the box compared to the commercial equivalent of Observium. I will do further research. I am used to Zabbix but I find it a bit cumbersome to customize. I got a new NAS device with IP Camers and new RB4011/cAP AC so I am planning to have them monitored using NMS type of solution. Thanks for your inputs ....
Re: Interfaces monitoring
Posted: Sat Nov 02, 2019 9:57 am
by danunjaya123
Is this open suorce ?
Let me know how can we install it.
Yes graph is hosted on device only!
In my company I use Observium, free PHP tool that is automatic discovery with SNMP. Is great to see traffic, discovery, map, processor, ram, storage and all others!
All device types supported and most of all, it's open source and you can modify it in your needs! Also you can create checkers to send e-mail notification for events, like high cpu / ram usage etc.
http://demo.observium.org/
http://www.observium.org/
Re: Interfaces monitoring
Posted: Thu Aug 13, 2020 9:08 am
by seriousblack
I recommend LibreNMS. Intelligent Light fast and easy to setup.