
-

-
DyadyaGenya
Member Candidate

- Posts: 220
- Joined:
Is it possible to transfer data from the script to Graphing
Is it possible to collect data using a script and pass it to Graphing?

Re: Is it possible to transfer data from the script to Graphing
Unfortunately no.
-
-
DyadyaGenya
Member Candidate
- Posts: 220
- Joined:
Re: Is it possible to transfer data from the script to Graphing
Suppose I collect data from the LTE interface (Siera modem) with a script. They come out like this:Unfortunately no.
Code: Select all
Mode: ONLINE
RSSI: -59;-65;-63;-67
SINR: 3.4
RSRP: -89;-97;-94;-96
RSRQ: -11.5
LTE band: B3
LTE bw: 20 MHz
LTE CA state: INACTIVE
LTE Scell band: B7
LTE Scell bw: 15 MHz
Re: Is it possible to transfer data from the script to Graphing
of course you can write a script that displays the interesting data in a loop (e.g. every few seconds), and when you start that from the terminal you can look at it.
you can even maintain some derived values in the script and display them as well, like average, average over last minute, lowest, highest, whatever.
it is also possible to call a script from SNMP. you can then graph it on another system with the wellknown graphing tools that work over SNMP.
I think it would be a nice addition to allow adding of a graph rule that is bound to a script, and that graphs the output of that script. I have proposed it before.
(it could e.g. be used to graph temperature, voltage, number of routes, etc)
-
-
DyadyaGenya
Member Candidate
- Posts: 220
- Joined:
Re: Is it possible to transfer data from the script to Graphing
But is it possible to display information in the terminal as on the screen?of course you can write a script that displays the interesting data in a loop (e.g. every few seconds), and when you start that from the terminal you can look at it.
you can even maintain some derived values in the script and display them as well, like average, average over last minute, lowest, highest, whatever.
it is also possible to call a script from SNMP. you can then graph it on another system with the wellknown graphing tools that work over SNMP.
I think it would be a nice addition to allow adding of a graph rule that is bound to a script, and that graphs the output of that script. I have proposed it before.
(it could e.g. be used to graph temperature, voltage, number of routes, etc)
https://itgap.ru/static/uploads/posts/2 ... 18ab06.jpg
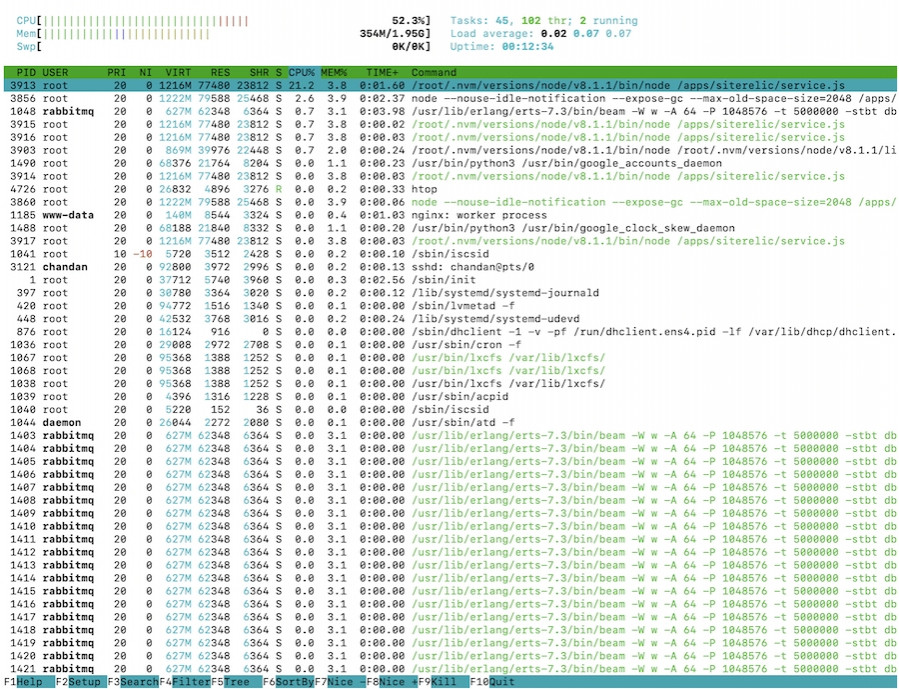
I could not figure out how to insert an image here, so I inserted a link to the first screenshot of the "htop" command that came across. The picture above shows the CPU and memory usage.
-
-
DyadyaGenya
Member Candidate
- Posts: 220
- Joined:
Re: Is it possible to transfer data from the script to Graphing
I understand that this is done in a loop and there is already an option where everything is written in a line. And the new line, as it were, continues the columns. But this is not very convenient. I want a graphic display.