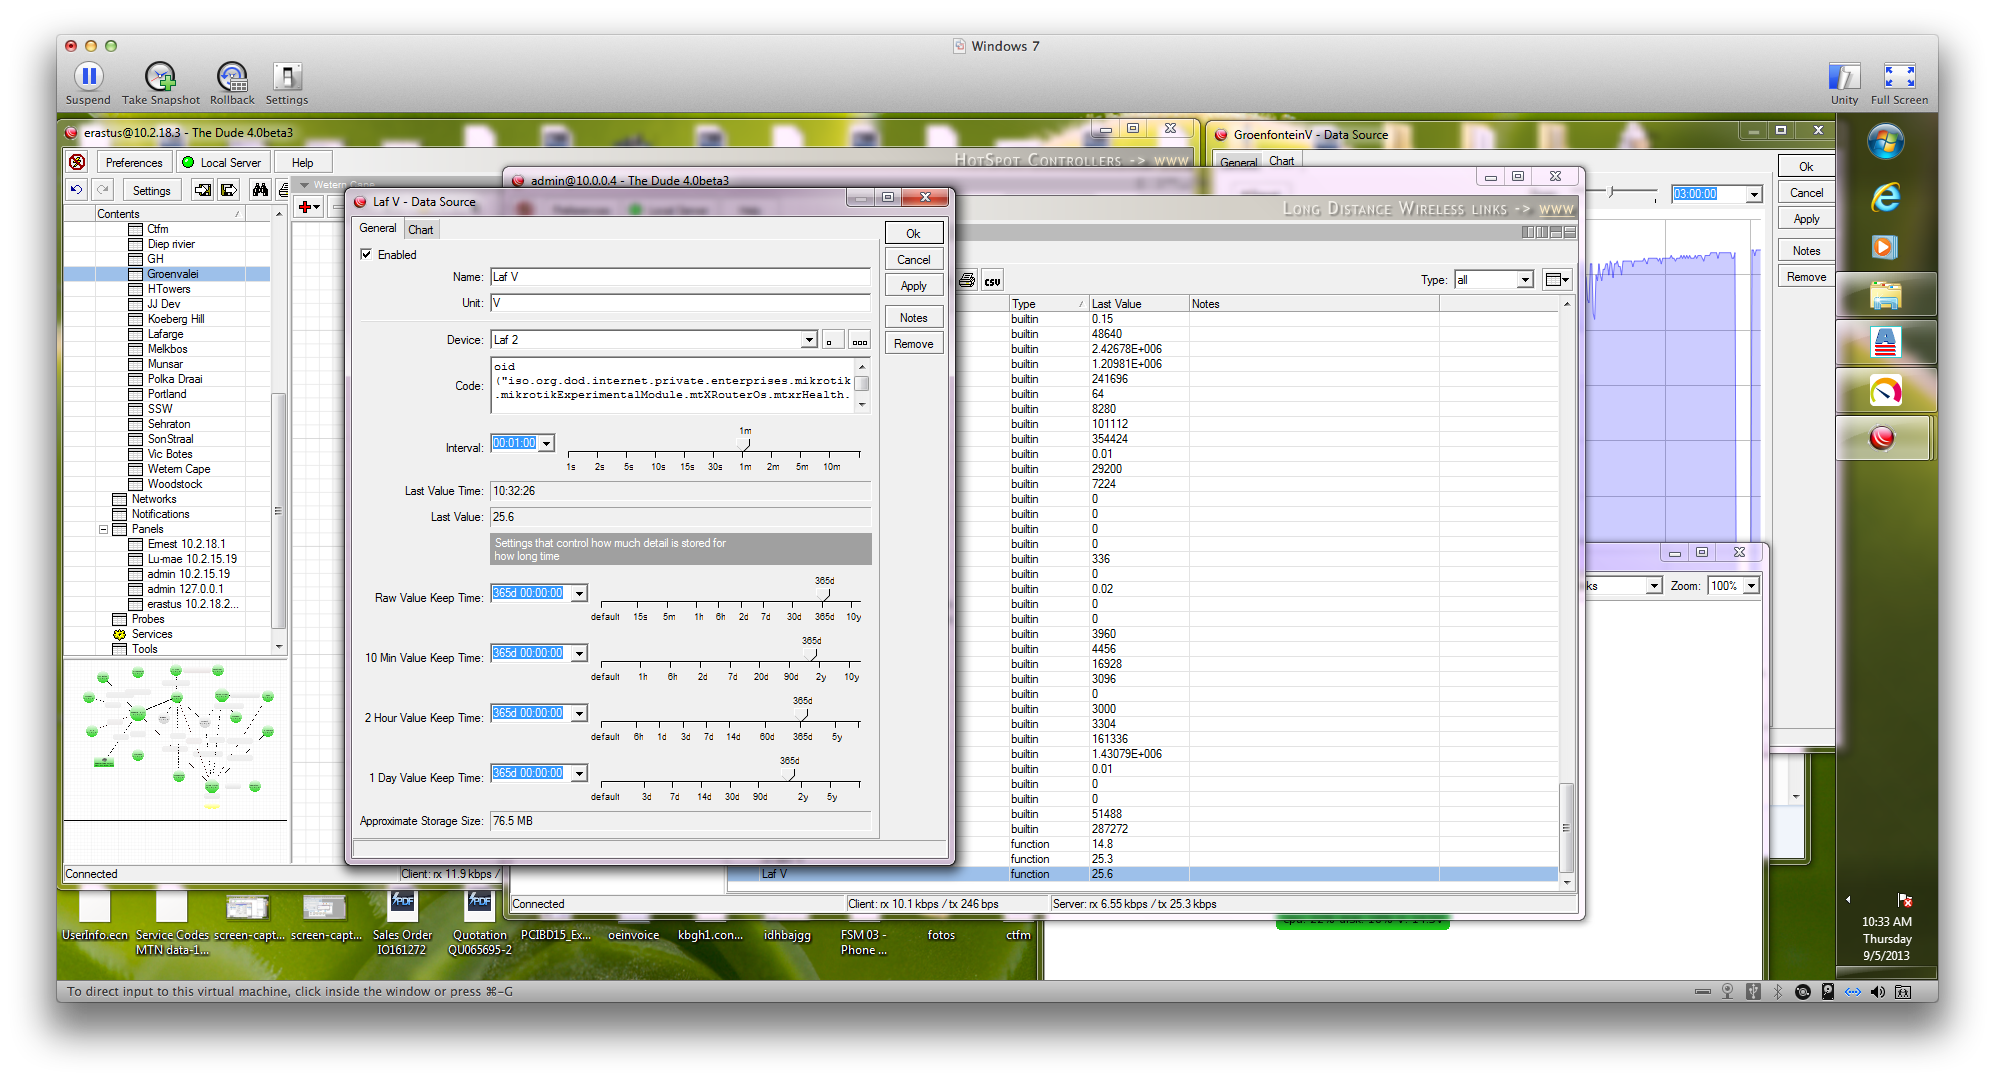
I added a voltage function:
Name: mipsbe_voltage
Description: Voltage for MISBE
Code: oid(“iso.org.dod.internet.private.enterprises.mikrotik.mikrotikExperimentalModule.mtXRouterOs.mtxrHealth.8.0”)
/10
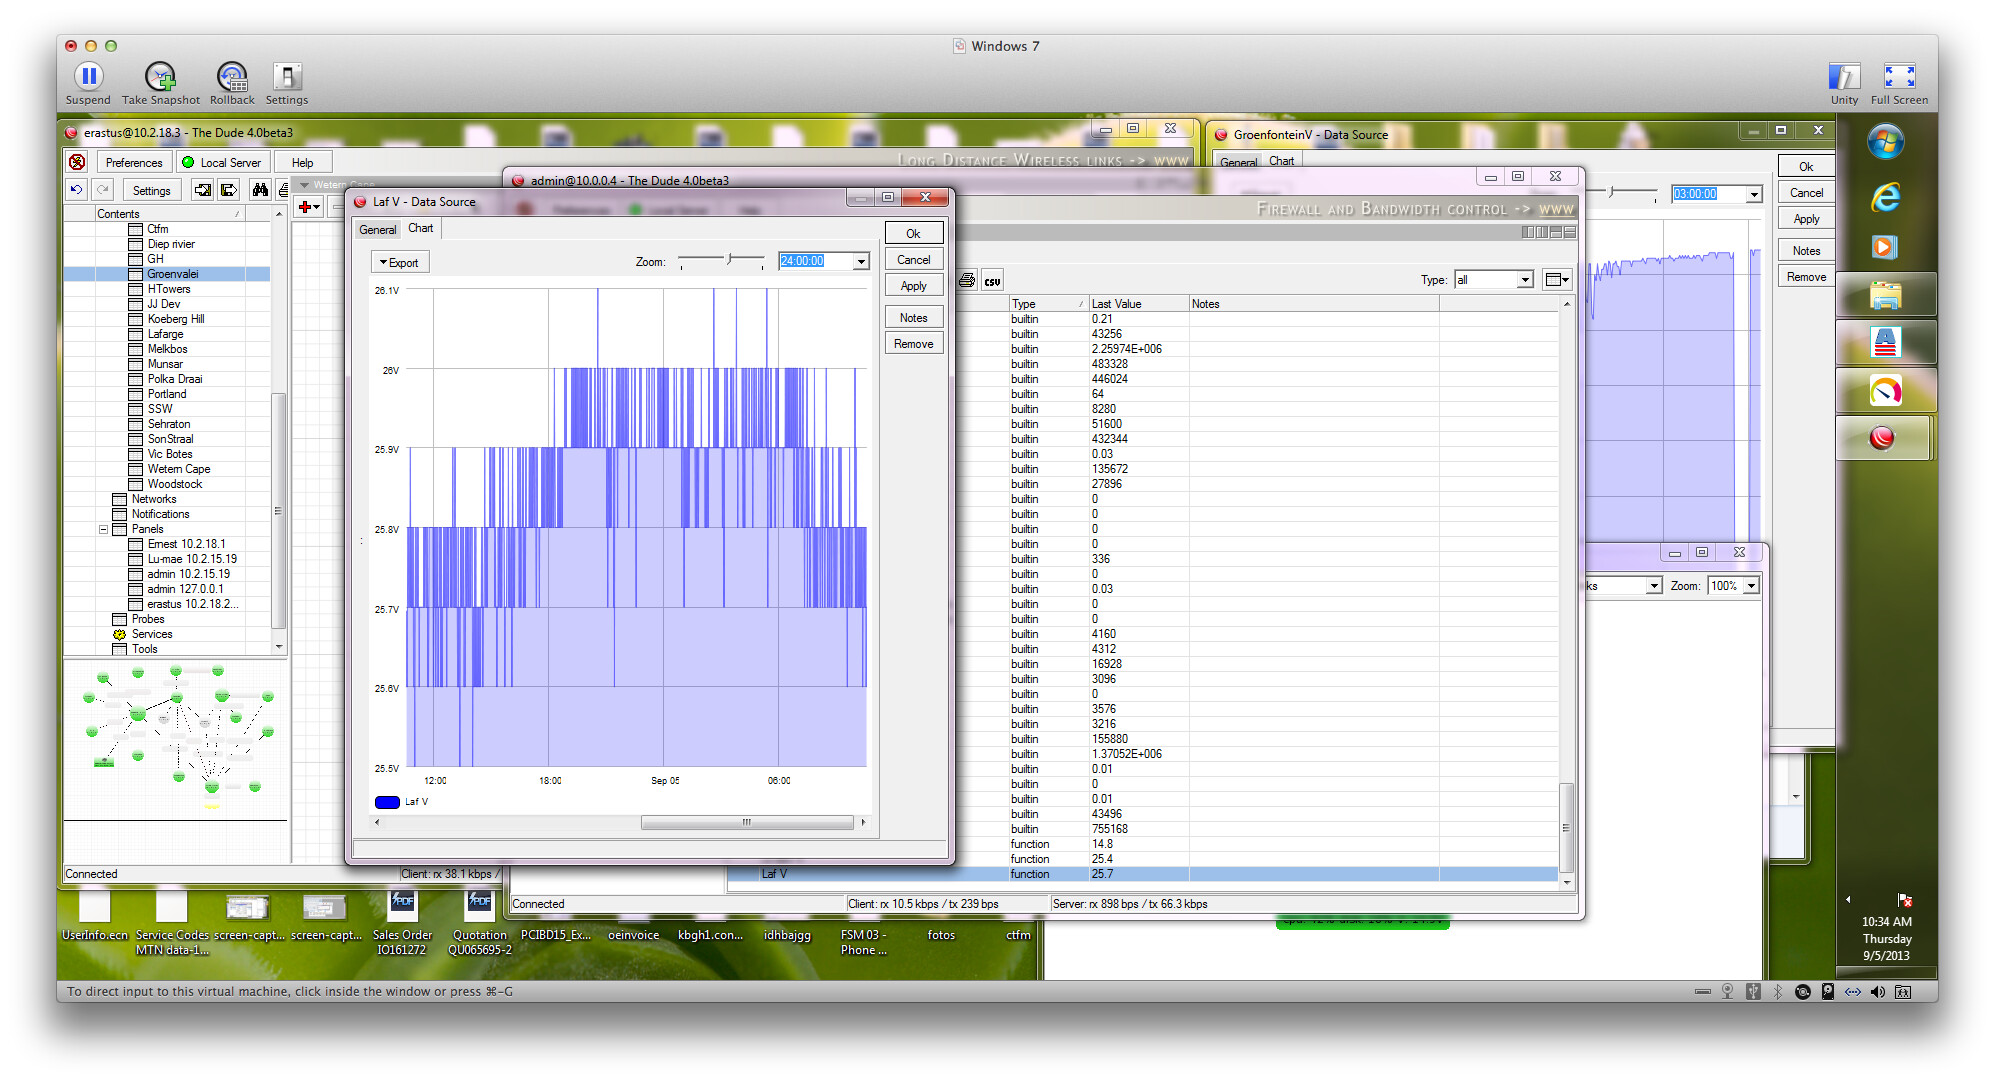
When I go to charts to ad a chart I see the voltage values accumulated by dude( a lot are lost I recon it is a feature of dude)
Following are the settings to aquire the data:
The following is the data captured by the function:
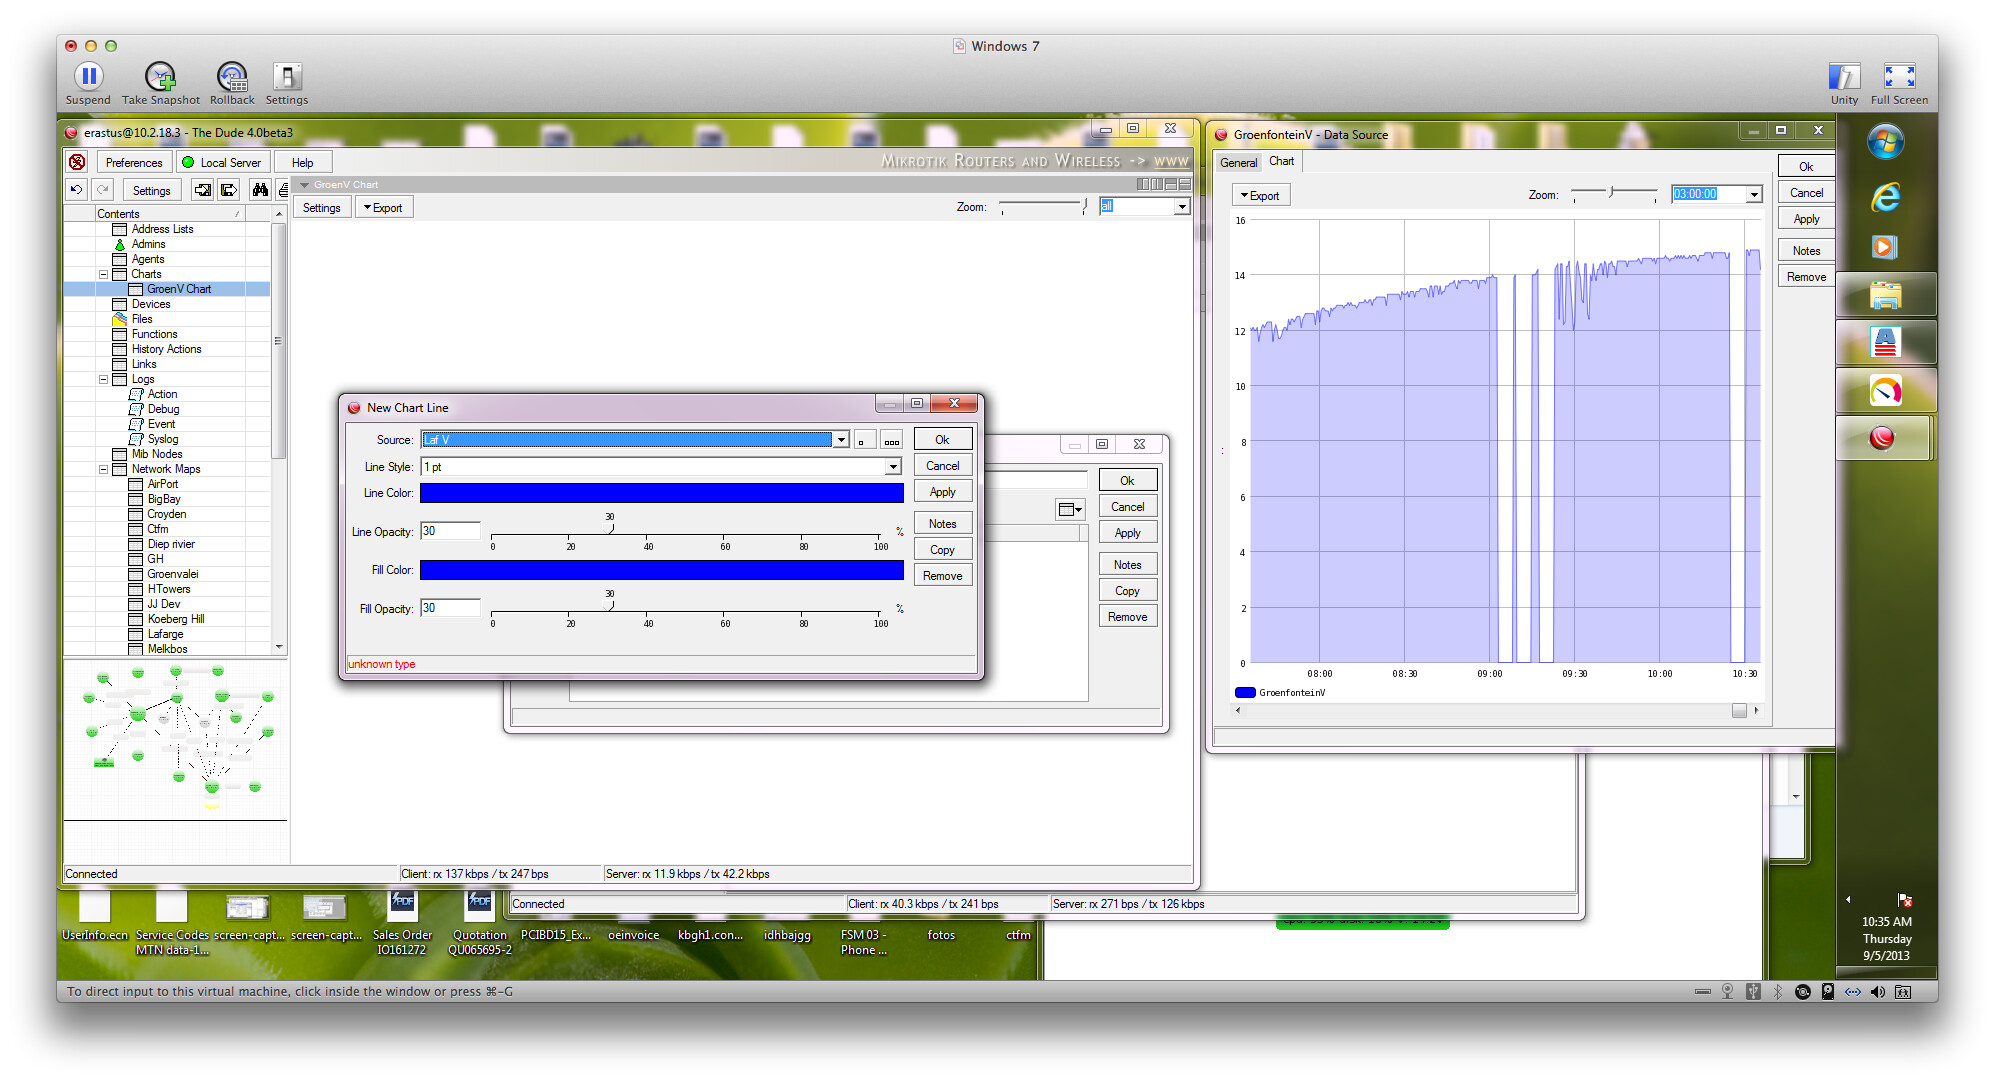
Following is the settings to add a graph with the functions graph on the right:
If I press apply I get the error in the bottm left corner.
Question: If you are keeping raw values for 365 days why do you keep any other values for 365 days?
Note: I don’t know what happens if you don’t store any averaged values.
You should be very careful trying to keep raw values for so long. Keep an eye on your database if it gets near 2gb back off your raw values. The dude will fail if your database is over 2gb. The dude process old data at some interval but mostly it averages raw values to 10 minute averages (wtf 5 minute averages is the standard) then the amount of stored data is reduced x10 then when it converts that 10 minute average to 2 hour averages that reduces the stored data again so the database will remain small. I notice that it says the stored data will take 76.5M so it looks like it should be fine. Maybe the dude automatically will not store averages if they are equal to the raw keep time?
Anyhow maybe you could convert your data source to a function and a probe to eliminate the error?
Thanks for the information. I tried adding it as a probe and then dude struggles to provide the graph from the icon when hovering over it.
Still the same problem with a function/ probe . I can not build an graph from it it keeps on saying type error.
I guess it is save to say dude is dead
Dude looses also a lot of data so I recon it is best to file it in file 13 and get a package that can do it effortless.