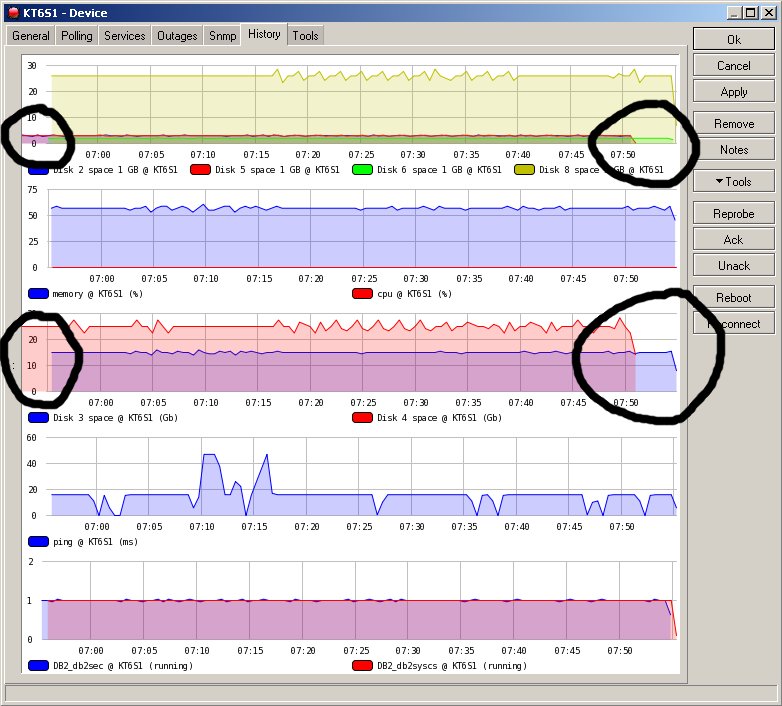
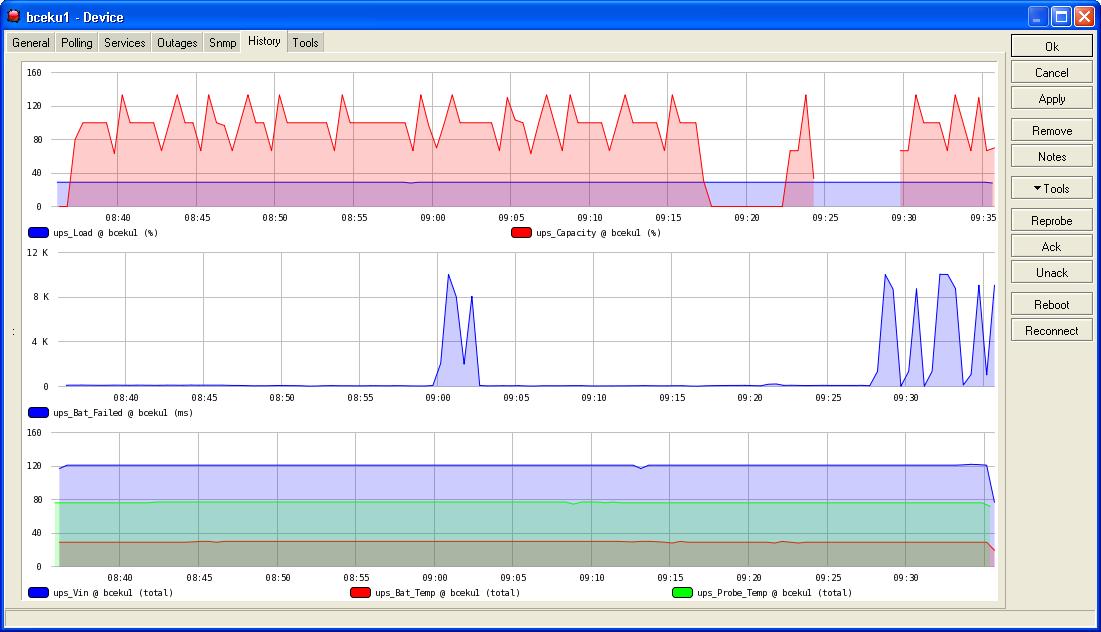
I have a strange problem with the history charts, sometimes parts of them are displaced (take a look at the screenshot). Unfortunately this goes hand in hand with the fact, that the Dude classifies this services as down but they aren’t. Reprobe will also not help (it seems that reprobing will not do anything), after a few minutes they are up again and in the history graphics is a hole for the (not occurred) downtime. This happens in Vers. 3.0rc3 and and also in the actual 3.0.
Can you tell us if this is being looked at? If this gets fixed it will clean up a lot of false positives. Also I saw in another thread that people were not getting down messages just up messages. I also get those and this looks like it is the cause of it.
I am anxious to see this get fixed since it is the only issue that is keeping us from deciding to continue to use “The Dude” and put more stuff in it.
One thing I can imagine is that you haven’t correctly configured your up/down because “up->down” and “down->up” doesn’t usually happen, it’s “up->unstable->down” and “down->unstable->up”
I don’t have much configured just down->up and up->down. You can clearly see in the graphs above that the data in the graph is not lined up within the timeline. Every time the graphs return to normal (where the data fits correctly on the timeline) I get an up message but I never see down messages. They are not actually down…
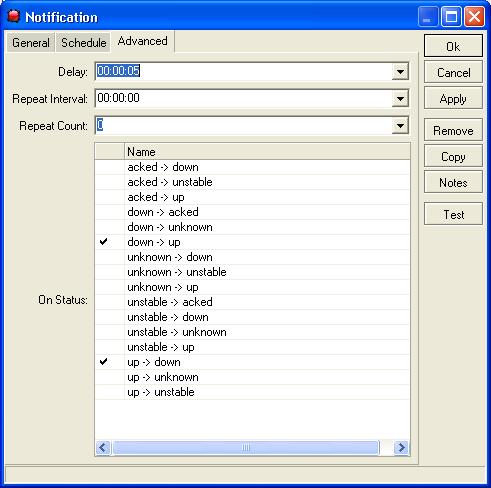
In my case I have only configured a sound at up-down and unstable-down. Additional a syslog entry at up-down, unstable-down and down-up. Now I also marked the unstable-up entry for the syslog and have increased the delay time of both notifications.
Thanks Normis, Do you think this will solve the odd graph issues?
I configured beep on unstable-down and flash on unstable-up and left notification as up-down and down-up.
Also set syslog for up-down, down-up, unstable-down and unstable-up.
I still get the graph issue with more notifications setup. I added flash on up-unstable and unstable-down, email on up-down, down-up but I only get an email when devices come back up…
The same for me. It does not help to activate more notification steps. It would also not be the best solution for me, because I only want to have an accoustic notification when a service really wents down. On the other hand, why is it possible to activate/deactivate all this different notification steps, when you should always activate all the steps (up-unstable, unstalbe-down, up-down and so on)?
In the last weeks (where many people in the company where on Holidays) the false alarm notifications happens not so often as before. Could it be that they go hand in hand with a higher network load?
Well I upgraded to 3.1 asap this morning.
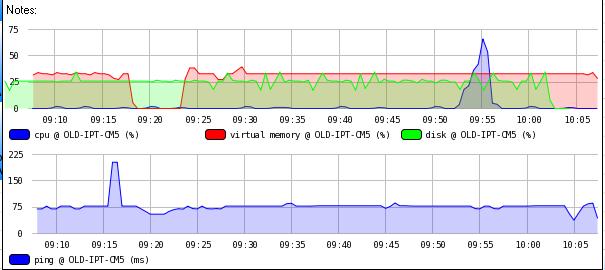
The issue where a false positive shows up and the graph is not lined up with the timeline still exists. I added notification up-unstable and I get an email that corresponds to the graph not lining up when I get the unstable message.
A minute later the graph is lined up and the unstable-up email arives…
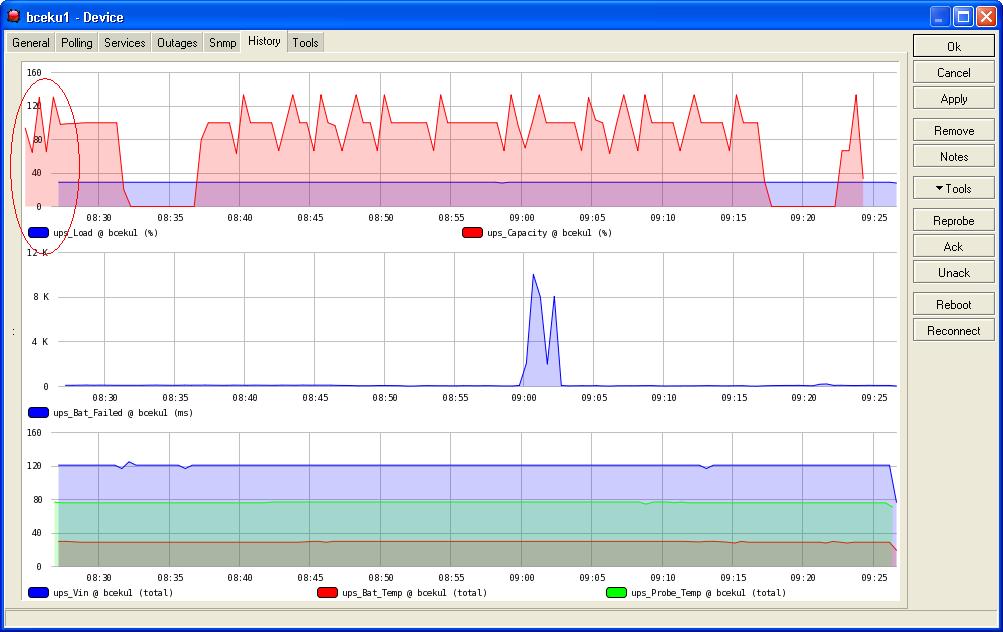
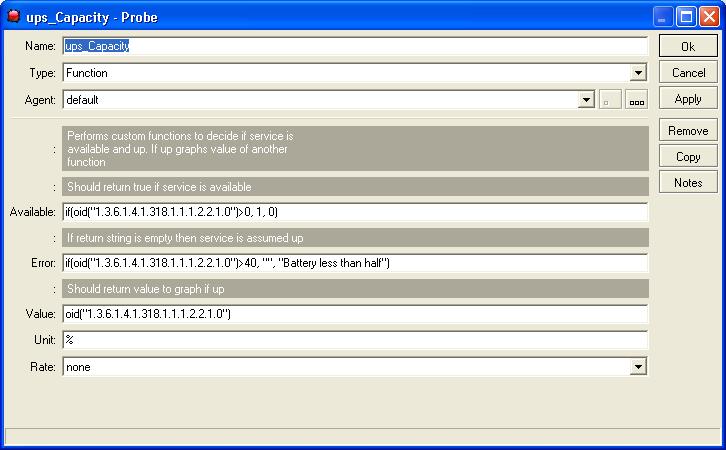
Here is the probe I use to collect battery capacity.
I rarely see this issue with other types of devices… Mostly on UPS. They are probably slow to respond?
It sometimes happens with the disk probe but I have never seen it with ciscoCPU probe.
Labels on links seem to be missing counters more often now too.
I am surprised more people are not reporting this. I am running the dude on a 3.0 ghz dual-dual core server in win2k3 sp1.
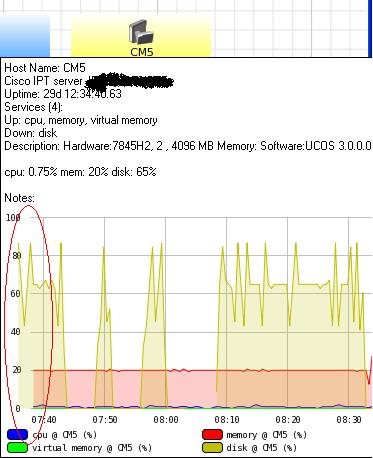
I get more of the data not lined up with the timeline in 3.1 than I did with 3.0. I disabled notification and syslog and still get the issue with graphs. Also the graphs are always recording values incorrectly. Look closely at the disk for this server cm5 it should be a flat line without spikes.