I'm working with networks 10+ years and want to make best ever netflow app, so I developing FlowSphera, I hope you will like it: GitHub - telesphera/flowsphera: FlowTrack - NetFlow v9 collector + web dashboard · GitHub
Yeah the visuals are great! You put some time into think about the look-and-feel and feature set. And there are not a lot good tools for NetFlow (although I have no looked much in past year+), but likely fill a niche.
Now, on the licensing... Not picking your project per se. But wonder with AI, it can copy the whole design of anything, without copying a line of code. And it's your design and feature set is the real work not the code. So I do think it going to bumpy road for paid software for anyone at some point.
Hi Buckeye!
Thank you for your question.
That is exactly how it works: while in Community mode, the program does not send any data anywhere and performs no checks; when in Pro mode, it only checks the license status.
Hi Ammo0!
Thank you for you comment. On our testing 5000 rec/s is a realy big amount of data and for most of border routers and firewals it should be enought. For network engineers in homenets and SMB it great option to get all the features for free. And you right - licensing, it is needed for big companies networks and sometime a customization of software features, it is additional work.
Please try it, FlowSphera is not so hungry for CPU and RAM and I hope you will like to for yours network visibility.
The page mentions that this will run on linux x86 or arm64.
What are the minimum hardware requirements to run on arm64? Will it run on a Raspberry Pi 4 with 4GB ram and external SSD (e.g. Raspberry Pi 400 with external SSD connected via UBS 3 adapter?
Thanks for the question!
Short answer: unfortunately, no. FlowSphera won't run on a Raspberry Pi 4 or Pi 400, even with an external SSD.
The reason is the CPU, not RAM or storage. FlowSphera keeps its flow data in ClickHouse. The official ClickHouse arm64 build needs an ARMv8.2-A processor, and the Pi 4's Cortex-A72 is ARMv8.0. ClickHouse
lists the Pi 4 as unsupported, and the database stops with an "Illegal instruction" error.
By "arm64" I mean ARMv8.2+ chips such as AWS Graviton 2 and newer, Ampere Altra, or ARM virtual machines on Azure and GCP.
For a small network today, the safe choice is any x86_64 machine or VM.
Ok, what about an old HP t520 thin client as a dedicated monitoring device. I have one in my "junk" pile.
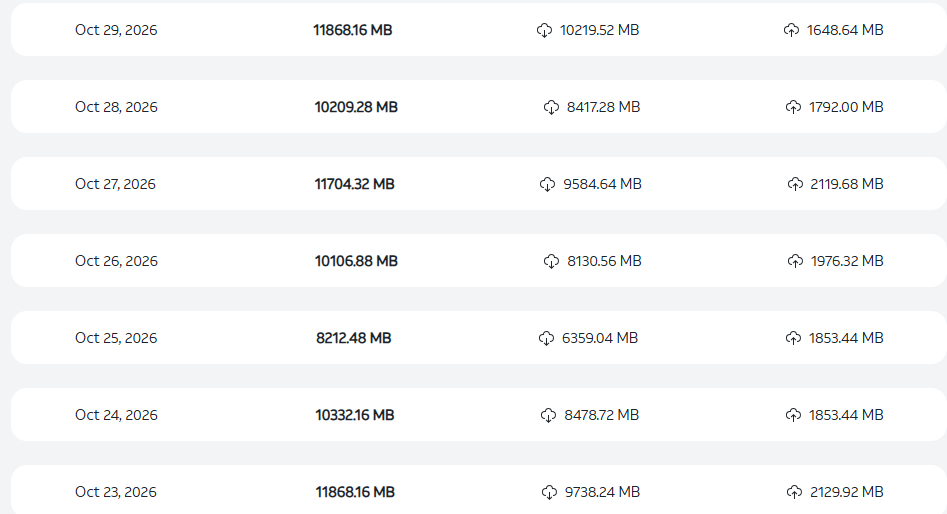
(For Home with relatively low use 300Mbps fiber internet connection). Here is what ATT reported for last 7 days
HP t520 Flexible Thin Client Mini PC desktop, manufacturer part number Y6Z02UT#ABA
Key Technical Specifications
- Processor: AMD GX-212JC Dual-Core SOC APU (1.2 GHz)
- Memory: 4 GB DDR3L-1600 SDRAM
- Storage: 16 GB M.2 Flash/SSD
The AMD GX-212JC SOC Benchmark on PassMark details the specs and low-power profile of the AMD GX-212JC embedded processor
Processor Specifications
- Architecture: 64-bit x86 ("Puma" / "Steppe Eagle" / Jaguar+)
- Cores / Threads: 2 cores / 2 threads
- Clock Speed: 1.2 GHz base (up to 1.4 GHz turbo)
- TDP: 6W ultra-low power consumption
- L2 Cache: 1 MB
- Graphics: Integrated AMD Radeon R2E / Radeon HD 8210 / Radeon HD 9000 series (128 shader cores)
- Memory Support: DDR3L-1333/1600, single-channel (with ECC support)
- Release Date: June 2014
Hi Buckeye!
The t520 should work. Its AMD GX-212JC is a regular 64-bit x86 CPU (Jaguar family), and it has the instructions ClickHouse needs on x86 (SSE4.2, PCLMUL, POPCNT), so the Raspberry Pi problem doesn't apply here.
The things to watch:
- RAM 4 GB: enough. The installer gives ClickHouse half of the RAM (2 GB here).
- Disk 16 GB: the tightest part. Ubuntu Server plus Docker plus the ClickHouse image take about 6–7 GB. Flow records take about 25 MB per million after compression. A home connection usually exports tens of records per second, so 30 days of history is a few GB. That fits, but leaves little room, so an extra SSD would be safer.
- CPU 1.2 GHz × 2: collecting will be fine at home rates. Pages over long periods will load slower than on a desktop CPU. I haven't measured this exact box, so I'd be glad to hear how it goes if you try it.
I've deployed your app in a section of test network and must say it works quite well!
Currently at about 350 records/sec Netflow v9 coming from a Palo Alto cluster.
Running a Linux Ubuntu VM ontop of Proxmox, specced with 4Gbytes RAM / 64GB disk and 4 vCPU.
Very responsive!
At the moment some issues to get the datastreams correctly. The "usage" menu gives mostly "0 B" downloaded. This might be fixed when I also apply the netflow-profile on the Palo "external" (=Internet) interfaces or something. Let's give it a try
Thanks a lot for trying it and for the numbers — great to hear it runs smoothly on a 4 GB VM!
About "0 B downloaded": you're right, it's the NetFlow profile. PAN-OS exports only ingress records, and only on interfaces that have a NetFlow profile. With the profile on the inside interfaces only, FlowSphera sees the outgoing half of each session, but the replies coming in from the Internet are never exported, so everything looks like upload. Please add the same NetFlow profile to the external (Internet-facing) interfaces as well and commit. Downloads should appear within a minute or two.
If the numbers still look odd after that, you can mark the external interfaces as WAN in Settings → Devices. Then direction is decided by interface instead of private/public address ranges.
I'd be glad to hear how it goes!
Seems to work fine now when including the WAN-side!
I've taken the time to edit the various interface-names, bandwidth etc and have some LAN-networks defined and I must say it really works intuitive and very fast.
You developed this from scratch ? Vibe-coding ? Since I spot "claude" as a Github contributor 
I've hit once the 5000/sec limit it seems. Might be some incoming Internet scanning/probing or something
I also like the various event-messages on "internal hosts" that are performing some scans towards Internet etc.
This is by far one of nicest toolings with a free flavour that I've encountered in a long time.
Thanks for making this available.
Also the easy backup/restore is nice & flexibel!
At present I cannot yet find any bug or something. No crashes, going to leave it running for some time.
Thanks a lot for testing it this thoroughly and for the kind words, it really motivates!
About the development: not vibe-coding in the usual sense. FlowSphera started at home: I wanted proper traffic statistics for my own FortiGate, and after 10+ years in networking I had a clear picture of what a NetFlow tool should show and how. The architecture, features, UI and all product decisions are mine. Every release is tested on real FortiGate and MikroTik traffic and on synthetic load before it goes out.
And yes, I use Claude as a coding assistant, that's why you see it in the commits. I don't hide it, it's a tool like an IDE or a compiler, and it lets one person build and test much more than before. But someone still has to know what to build, why, and check that the numbers are correct, and that part is not automated.
About the 5,000/s limit: short peaks above it usually come from Internet scans hitting the WAN (every probe becomes a separate flow record). If you see it often, check Security events and Top hosts for that moment, it should show where the burst came from. Let me know what you find, I'm interested in such cases.
Glad backup/restore works for you too. If you find any bug or something feels unclear, write here or open an issue on GitHub.
Did you consider adding "Last 15 minutes" at the top selector window ?
Now there "last hour" , "last 6 hours" "last 24h" "last 7days" and "last 30days" or the CUSTOM. There indeed there is option to take a 15min window.
Why not have it incorporated in the general selector ?
For my understanding, your tool does not understand Palo Alto*** App-ID field ? In the flow-config I can select this box "Pan-OS Field Types" ? Currently not selected
***I know this is a Mikrotik Forum but
Good point about "Last 15 minutes". Having it in the main selector next to the others, not only in Custom, sounds reasonable. I'll consider it for future releases.
About Palo Alto App-ID: you're right, FlowSphera doesn't read it yet. Today application names come from ports and known services, not from the firewall's own application field, so the "PAN-OS Field Types"
checkbox doesn't add anything for now. Leaving it unchecked is fine.
App-ID support is an interesting idea, since it would give much better application names than port guessing, and I'll look into it. If you'd be willing to help, a short capture (a few minutes of NetFlow from the PA with "PAN-OS Field Types" enabled, as a .pcap) would be very useful if I go that way. No need to post it here, a private message is fine. Only if you're comfortable with that, of course.
And no worries about the Palo Alto question on a MikroTik forum FlowSphera works with both.
Small cosmetic thing/bug.
Using MS Edge browser 149.4022.62 on Windows 11
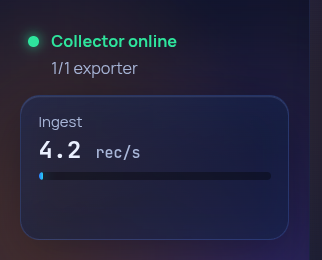
It seems the most left with the menus does not "fit" the screen, so I'm losing the view on the
"Collector online" green button + widget indicating current ingress records/sec
When I re-scale my laptopscreen to 80% or even 75% everything "fits" but obviously text becomes small...
On my other system, Ubuntu Linux + Chrome browser it behaves well. 100% and everything is visible.
Re-scaling to eg. 125% and the widgets remain visible. Note that I'm on a 32" / 4K display here.
Could it be an option to consider a slightly bigger detailed graph for the ingress stats ?
I understand space is limited, but perhaps place a larger version on the "Flows" page ? On the right below the "Inspector" there is some unused screen estate.
Then when using the time-selector on the top you could get a better graph of the ingress over time. A bit like the graph "Traffic Volume" on the same page on the bottom. You could have the
I've raised an Issue on GITHUB for "Feature Request" on the PanOS extensions.
It contains a mini PCAP with real-world data what is coded in these fields.
EDIT:
Can you also elaborate a bit more on the messages I see about "loss" of flows ? So my exporter is working but I see a message on 4.5% "Loss".
and info like "duplicates 10.8% and 3400 repeated packets dropped"
How do you conclude to this ?
The Linux VM show 0 issues on the network-interface and this test-VM sits on 25Gbits trunk connected to a beefy Cisco Catalyst 9300X. Everything "0" in terms of packet-drops on the actual interfaces etc.
So yeah, trying to understand this a bit.
Thanks again for the detailed feedback!
Sidebar on Edge (#16): fixed. On short windows the menu now goes compact and scrolls, so "Collector online" and the ingest widget stay visible. It will be in the next build.
Bigger ingest graph (#17): good idea, the space under the Inspector is free. I'll look at a larger ingest-over-time chart there that follows the period selector.
Loss / duplicates / repeated packets (#18): these come from the NetFlow export itself, not from your network, which is why the interfaces show zero drops:
- Repeated packets dropped: FlowSphera received the same export packet again within 2 seconds, identical except for the sequence number. The copies are dropped, so traffic numbers are not doubled.
- Loss: gaps in the NetFlow v9 sequence numbers per source ID. Your report helped me find a bug here: when the exporter numbers such a copy with the next sequence number, FlowSphera drops the copy but then counts it as a lost packet. So part (maybe all) of your 4.5% is the copies, not real loss. I'll fix it in the next build.
- Duplicates 10.8%: identical flow records (same addresses, ports, interfaces, start time and size) arriving twice. PAN-OS sends no direction field, so they can't be told apart automatically.
Both point to the export sending some data twice. Since it's a cluster, could both members, or two export paths, be sending to the collector? If you can, a few minutes of capture on the
collector (tcpdump -i any -w pa.pcap udp port 2055) would show it quickly.
App-ID (issue #1) and CSV import (issue #2): thank you for the pcap and the ideas, both are on my list.
Sure, there IS a "direction" field in the template, but perhaps a PanOS bug Would not be the first
I've checked on PCAP I took earlier and the "direction" field IS effectively populated.
Eg I see "Direction : ingress (0)"
But fair to say I never seen any "Egress" value
Hmm OK...