Hi,
I'm trying to understand how RouterOS accounts memory for containers.
Setup:
- RouterOS 7.21.x
- RB5009
- Native RouterOS containers
- Distroless Rust application (DNS server)
process_resident_memory_bytes(RSS) exported by the application stays almost constant at ~42–43 MB.- Application heap breakdown also remains stable.
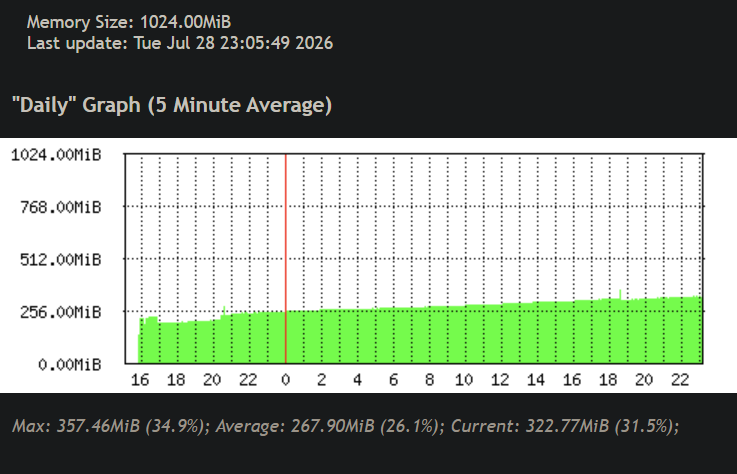
However, RouterOS reports memory-current steadily increasing:
- After restart: ~29 MB
- After boot completes: ~65–70 MB
- After several hours: ~100 MB
- It continues to grow even though the application's RSS and heap remain essentially unchanged.
The application periodically writes small log/history files and updates cached rule files under /data, but there is no evidence of a userspace memory leak.
Setting memory-high=100M caused RouterOS to terminate and restart the container, so that is not a usable solution.
Question:
Is memory-current in RouterOS simply the Linux cgroup memory.current, including page cache, filesystem cache, kernel memory, socket buffers, etc., or should it closely track the process RSS?
More specifically:
- Can
memory-currentcontinuously increase only because of file-backed page cache, while the process RSS remains flat? - Does RouterOS reclaim that cached memory automatically under memory pressure, or is there any recommended way for applications to hint that cached file pages are no longer needed (e.g.
posix_fadvise(POSIX_FADV_DONTNEED))? - Is there any way in RouterOS to inspect the cgroup memory breakdown (anonymous vs file cache vs kernel memory) for a container?
I'm mainly trying to determine whether this behavior is expected Linux page-cache accounting or whether it indicates a real memory leak.
PS: since yesterday
 :
: