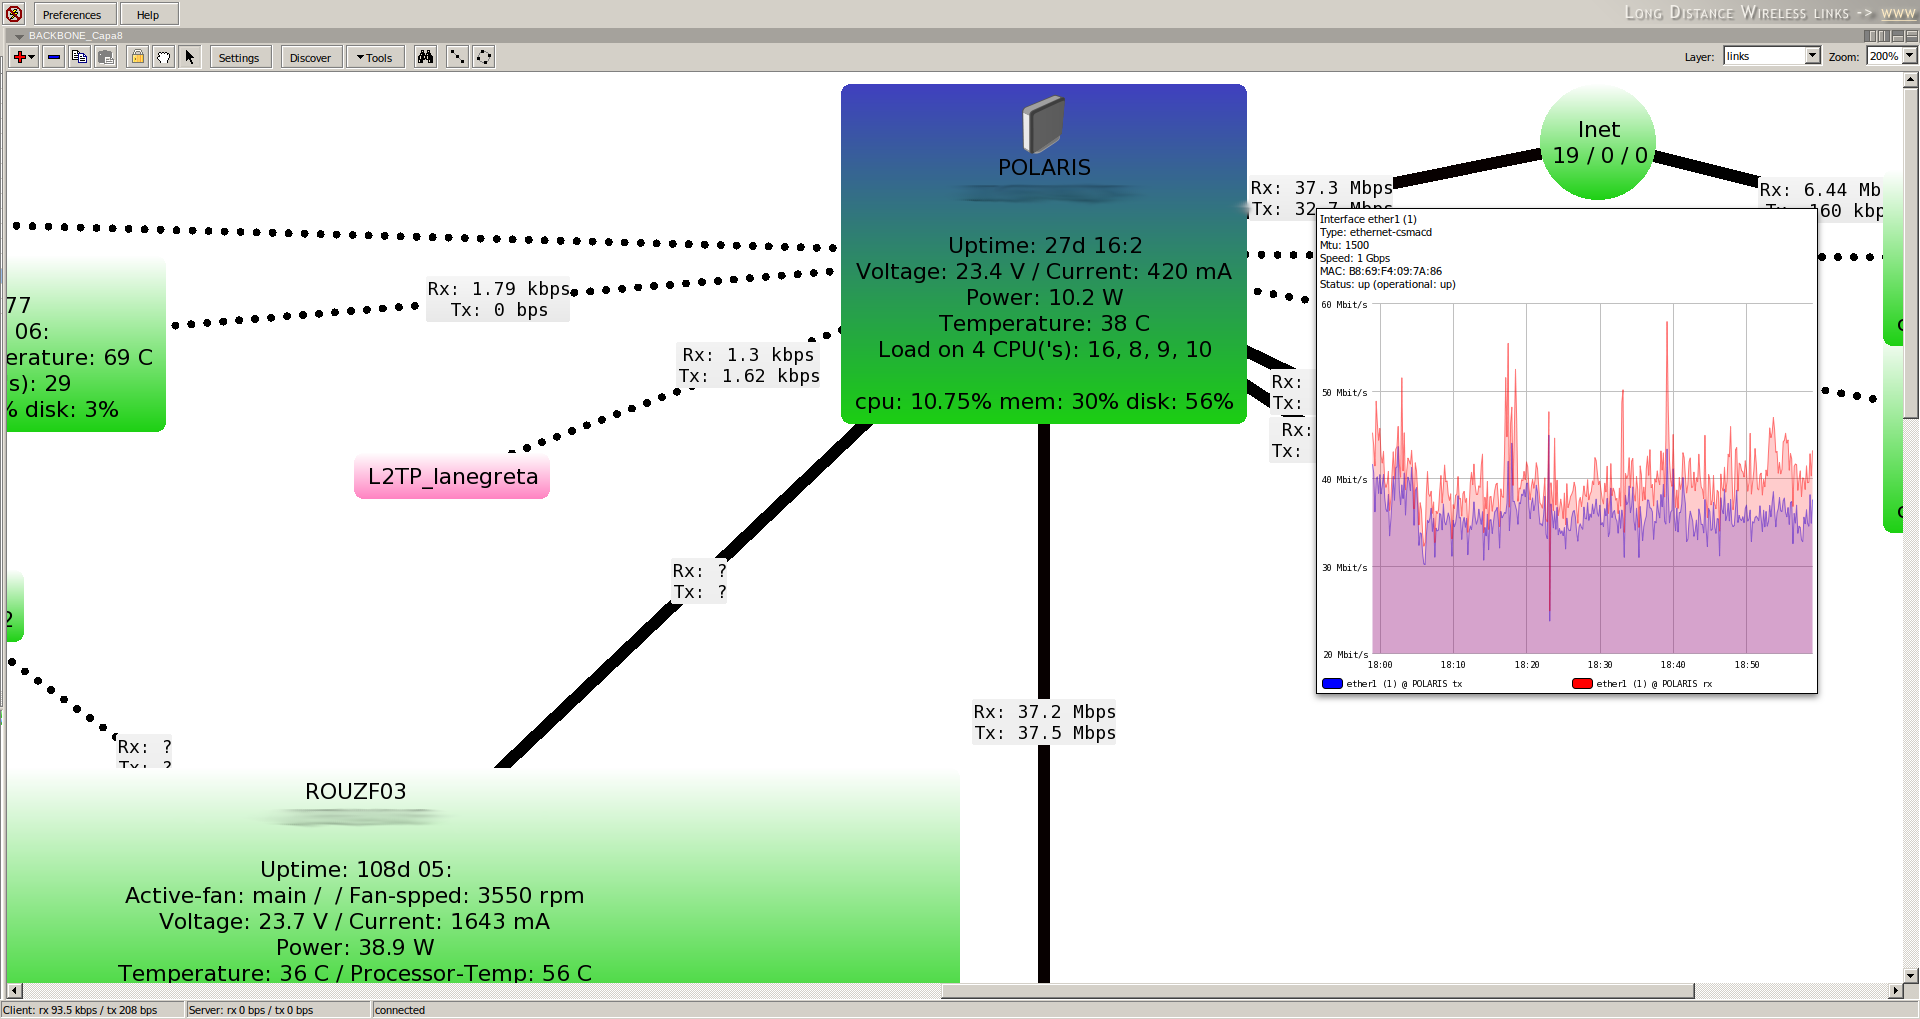
Regards. It is my first post and if it is not the right place or there is already a solution I apologize in advance; I have not been able to find any posts that refer to the problem I have. Well, I have a little problem that I didn’t really care about at the time, but it’s starting to seriously bug me. I run a small network and have been using the dude for years, with no particular problems. About two years ago I migrated the old dude to a RB1100AHx4 Dude Edition and everything worked fine except one detail. Of all the monitored devices, there is one that has not re-plotted internal variables; curiously, the traffic of the interfaces is correctly graphed. Precisely the router that hosts the Dude server. The rest, like silk, but I am unable to get graphs - or, of course, have a history - of the device that hosts the dude server.


Another fact that I cannot explain is that the RB1100 log indicates connection attempts of the admin user … from an IP address that is configured in the router itself, when there is no admin user in it nor, it is assumed, on the dude server (I have not been able to find the user list in the dude server configuration, so I have to assume that it is taken from the system -where there is no active admin user)
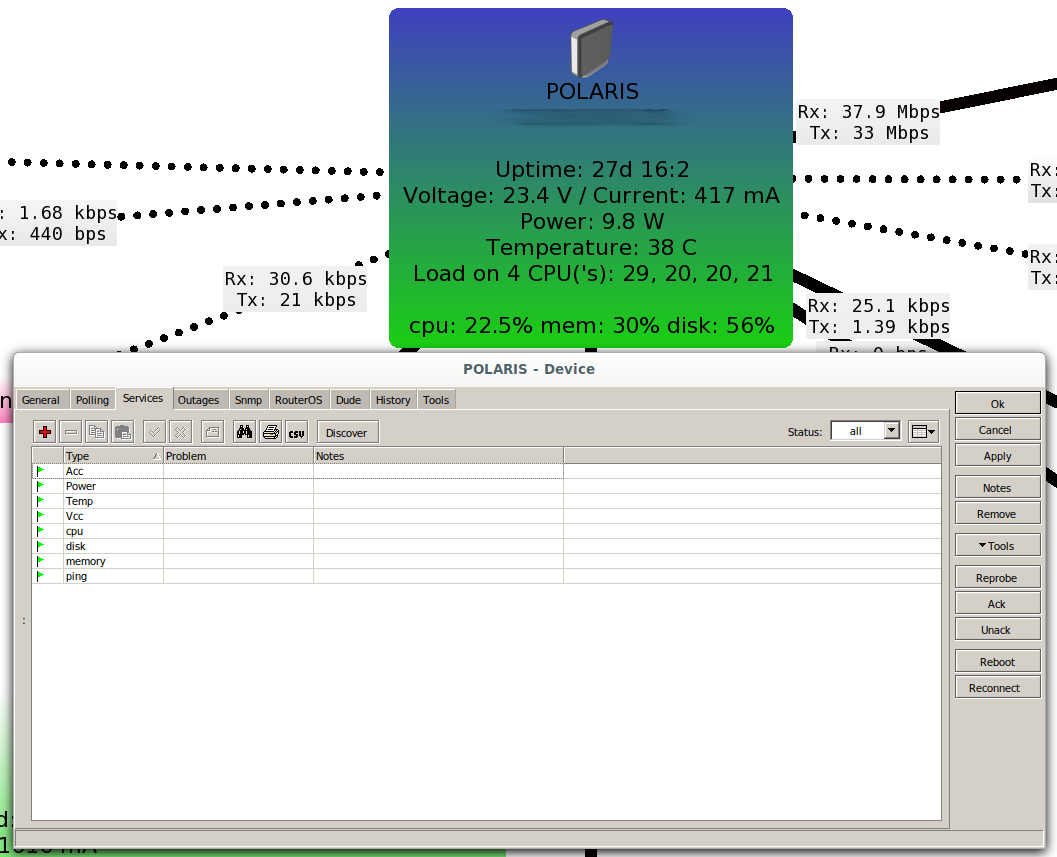
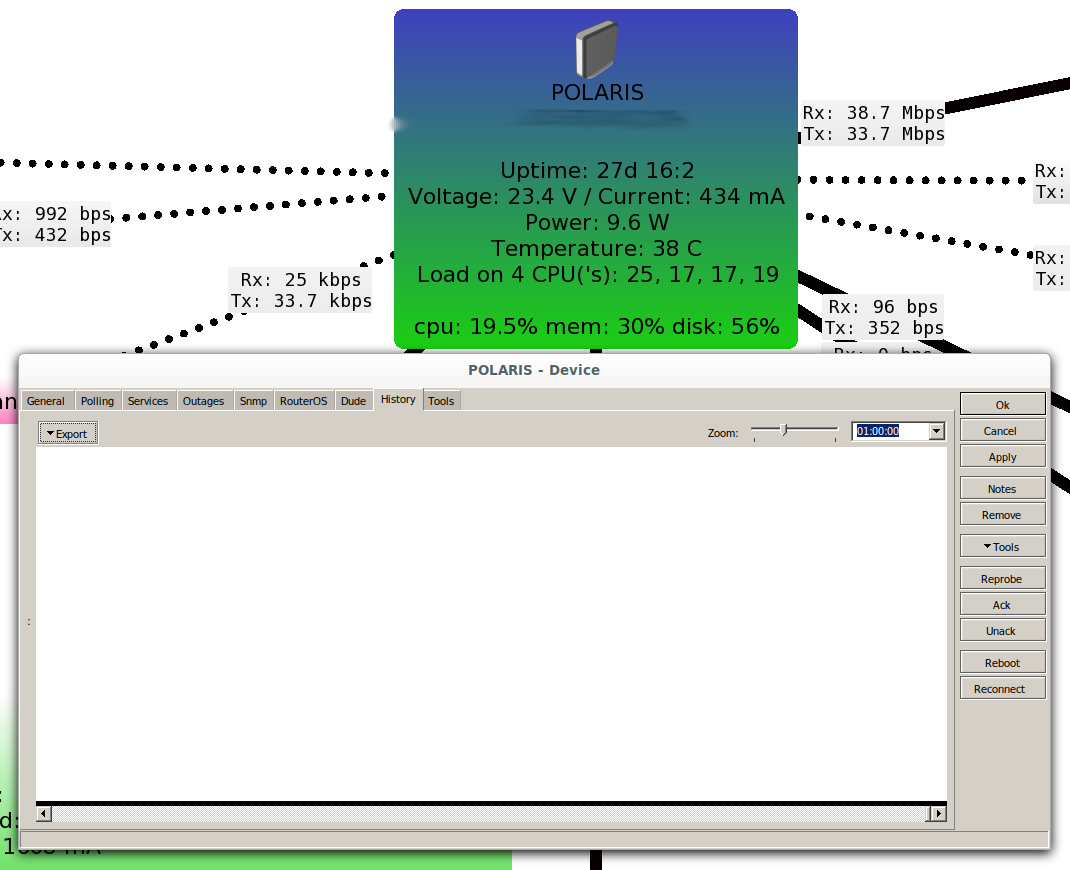
Well, I think I need help; I don’t know what else to look at; the SNMP version is consistent; dude informs me that it is successfully registered on the device; SNMP walk indicates that data is collected … And on the screen I see the variables (cpu, disk, memory, Vcc, etc …) continuously updating values, but without obtaining graphs from the first day.
Can anyone shed some light on the mystery?
Infinite thanks in advance.
A greeting.
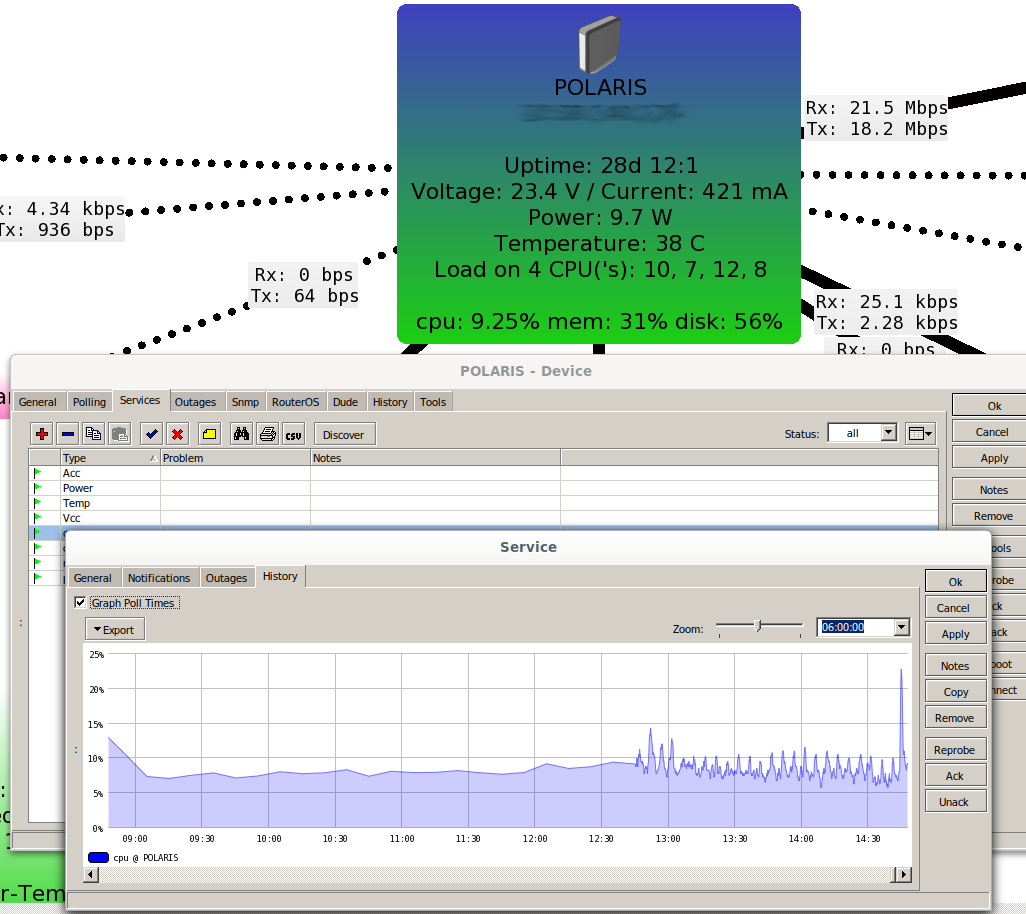
One more strange thing; You can see the history of each service separately …
I don’t think this is your problem but I have discovered a very similar issue where the host Dude server can’t monitor itself. You also see many login attempts from itself. I discovered a firewall rule to block access from interfaces not in the LAN list was the problem -
/interface list member
add comment=defconf interface=bridge list=LAN
add comment=defconf interface=ether1 list=WAN
/ip firewall filter
add action=drop chain=input comment="defconf: drop all not coming from LAN"  in-interface-list=!LAN
If I changed the !LAN to WAN the Dude could monitor itself.
Hmm…
Absolutely not sure here, but wouldn’t it be more secure, or more precise to just include the loopback interface (lo) to the LAN list?
I believe this is the interface that would be used to monitor itself.
When I did, it started monitoring right away…