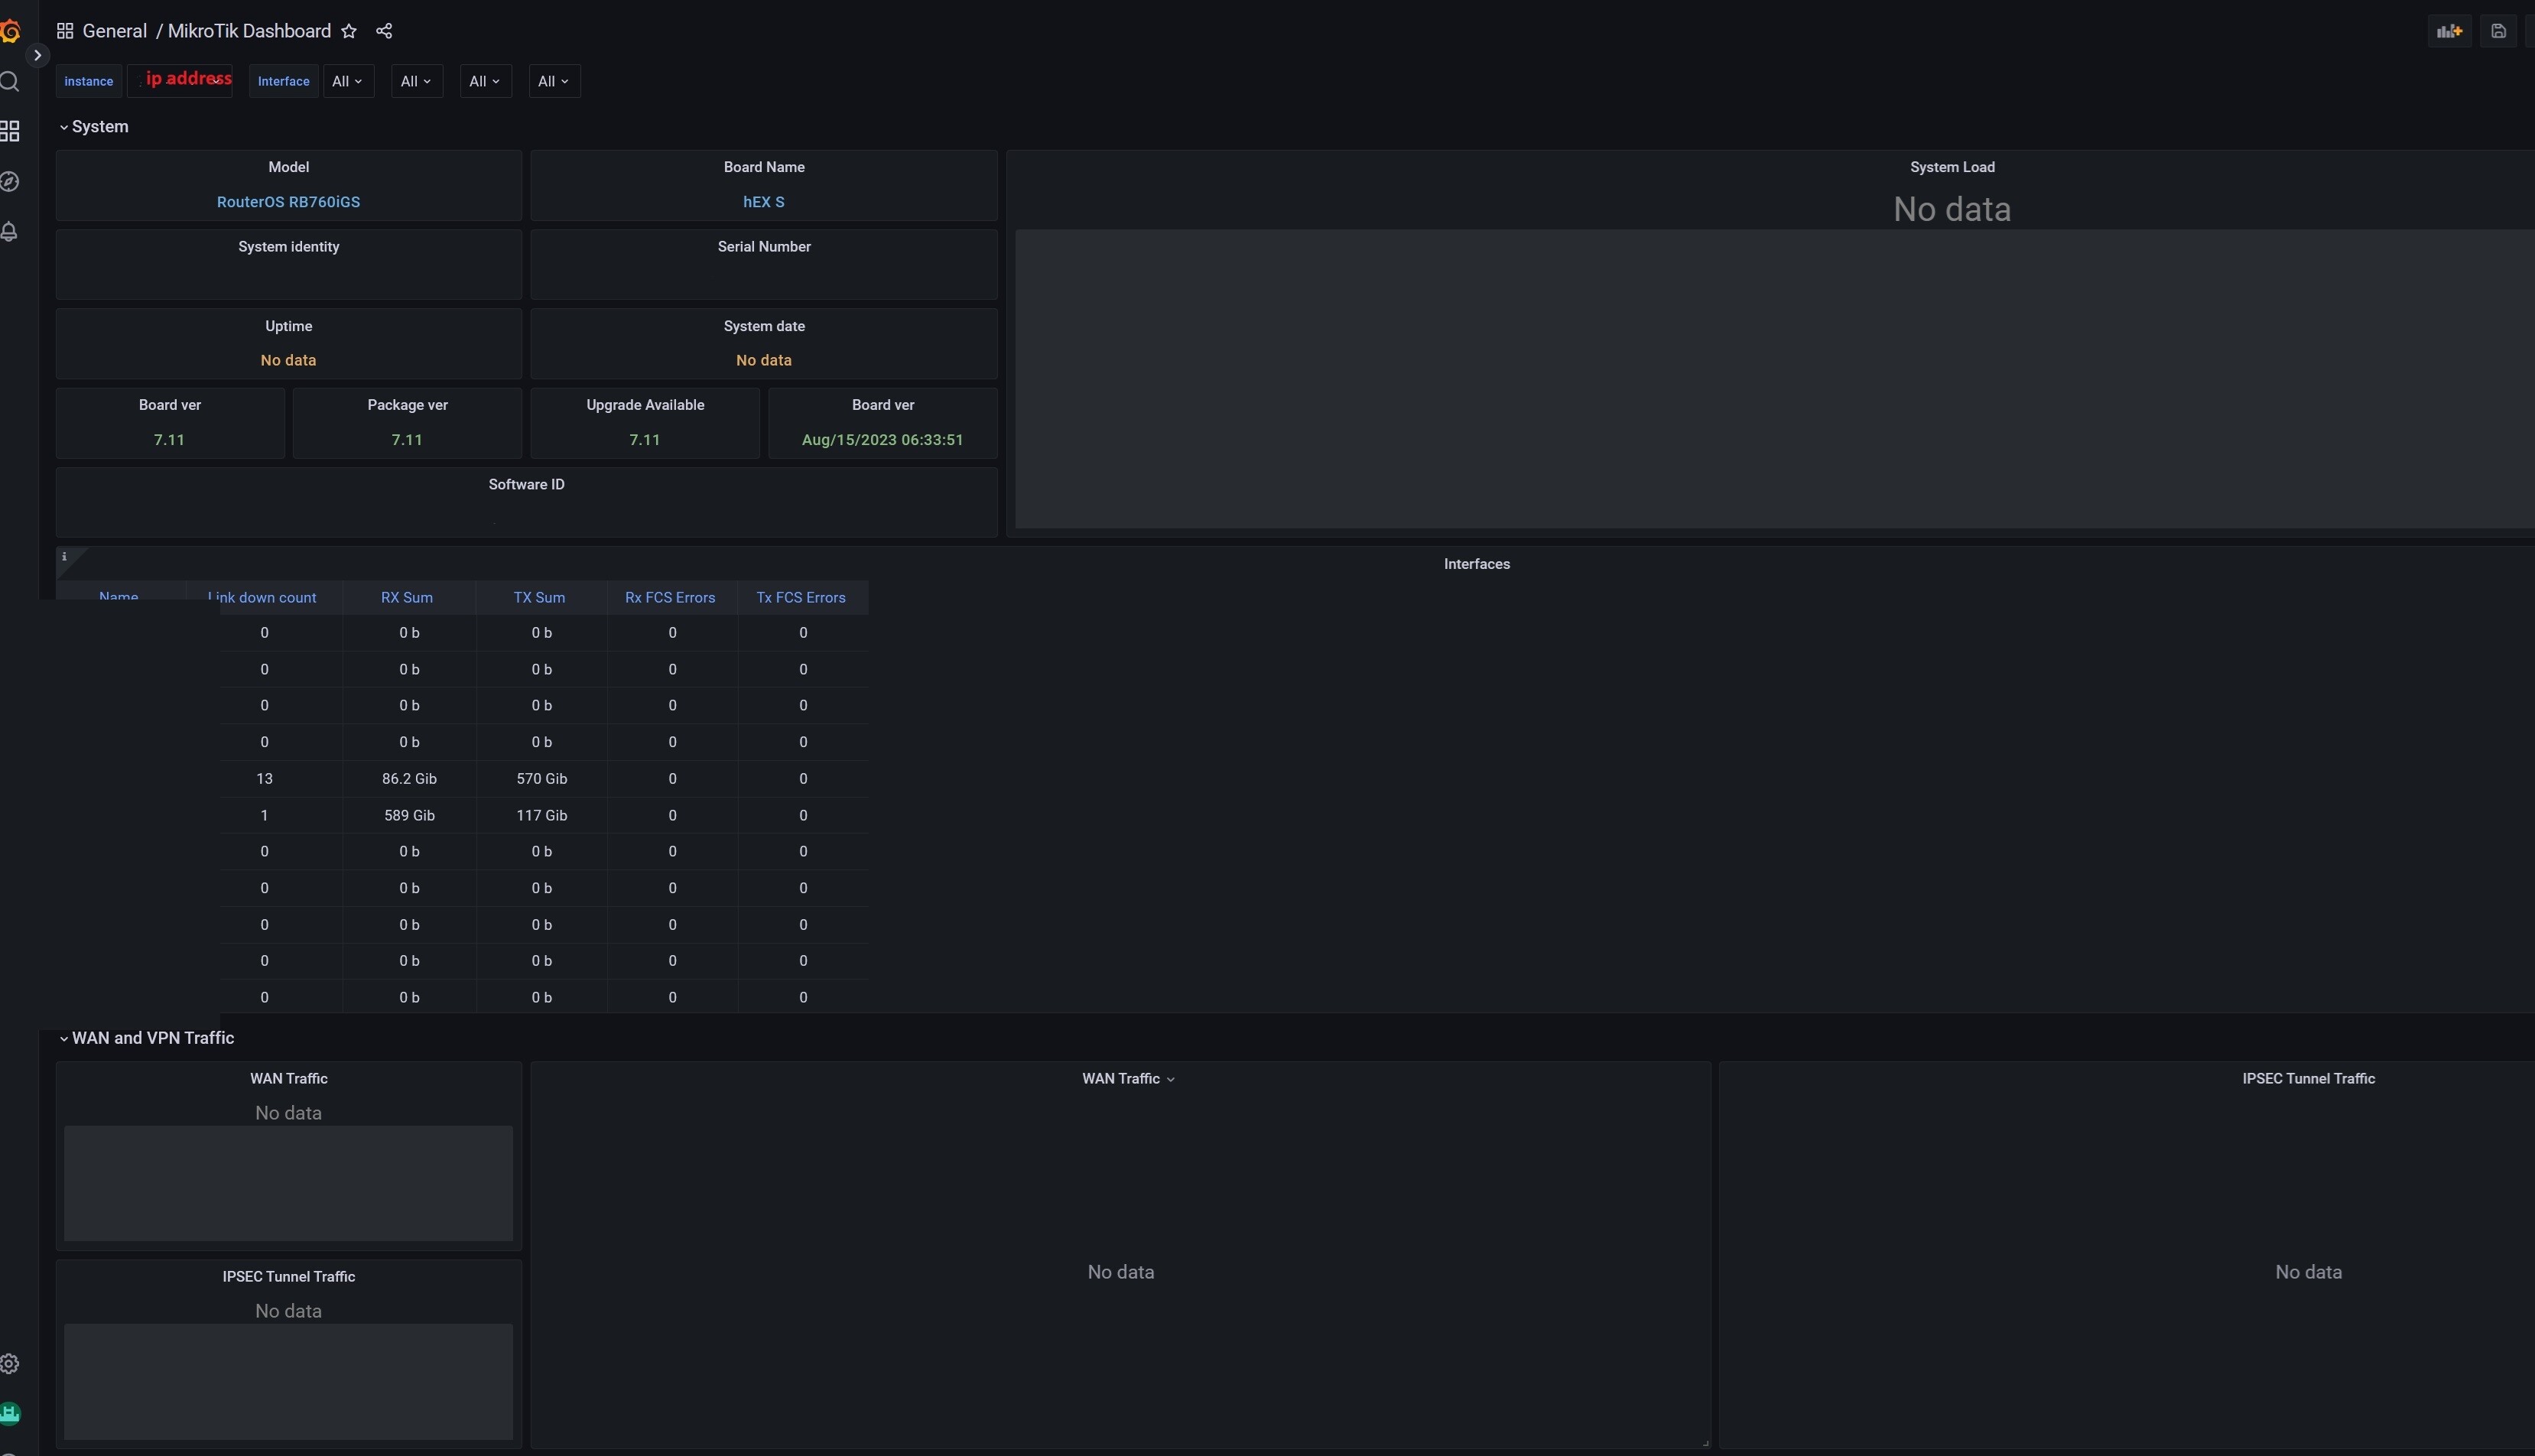
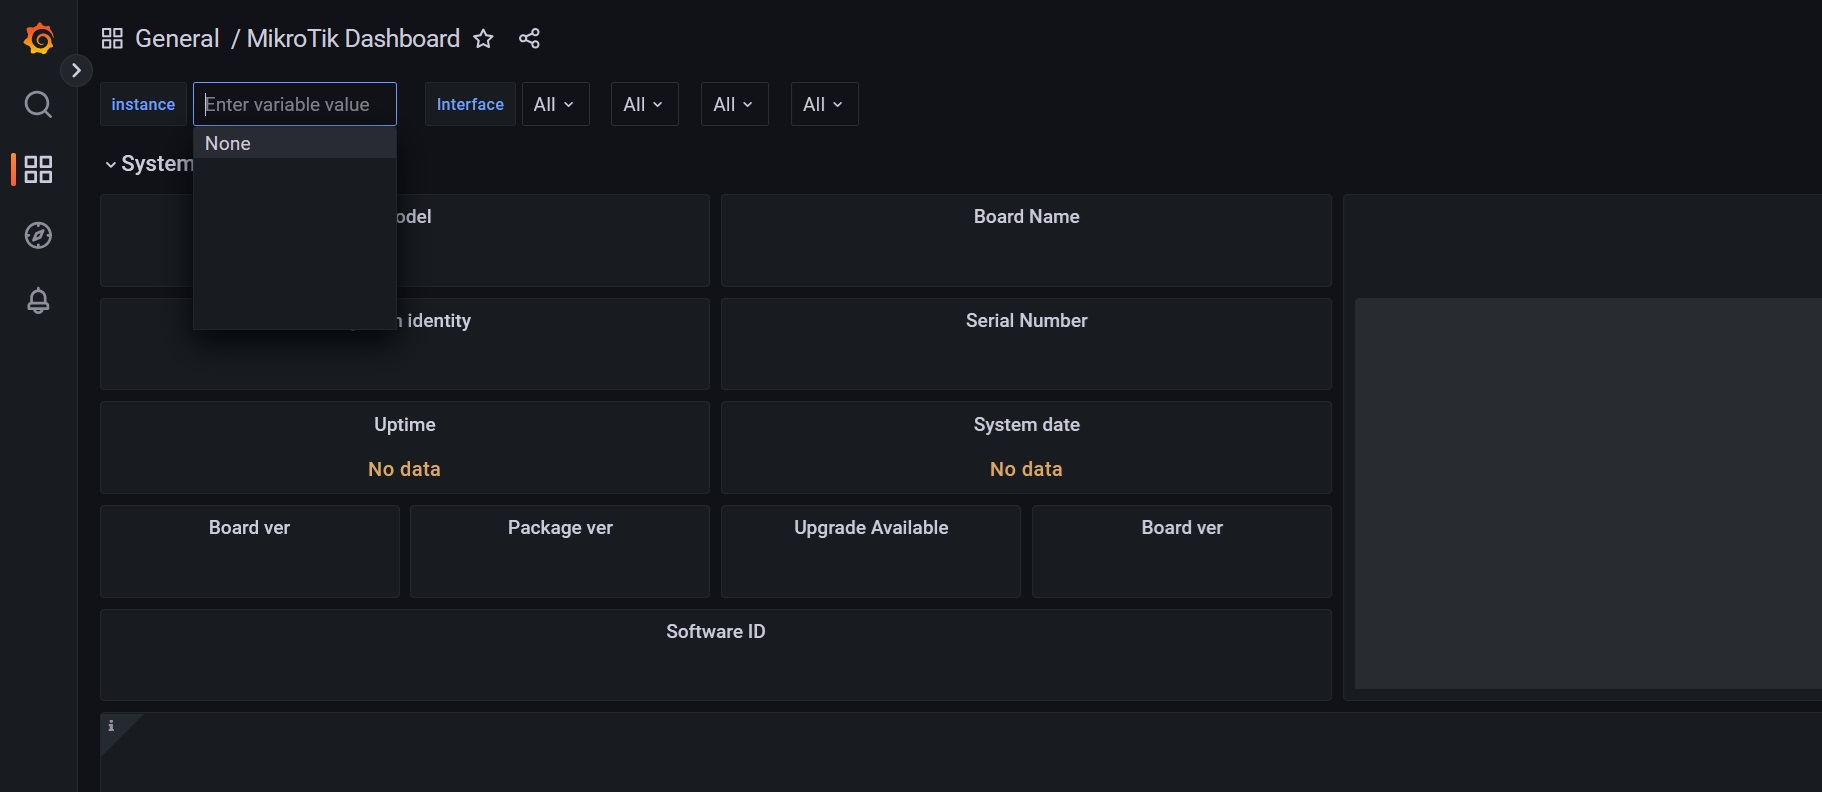
Hello everyone. I have completed all the steps, but it seems that it is not working correctly. In the Grafana dashboard, it does not automatically detect the instance IP address. However, if I manually enter the IP address of MikroTik, some dashboard information appears… but actually very little information. I can’t understand why the instance variable in the dashboard is not being defined??
My problem was solved. I took snmp.yml that bruins0437 posted in first post and that the decision! Default snmp.yml not worked.
Also I tried to generate my own snmp.yml with Mikrotik.mib modules, built snmp generator e.t.c. and than tried to us it, snmp exporter shows me multiple parse errors.
Can this be used to collect data from 20+ MT devices?
I’ve built snmp.yml from latest Mikrotik.mib (7.16.1), it’s REVISION “202405090000Z” and there is no difference in section metrics with file in first post. So no concerns about file relevant.
snmp.yml.txt (143 KB)
I’m trying to use this beautiful tool but I’ve the same problem.
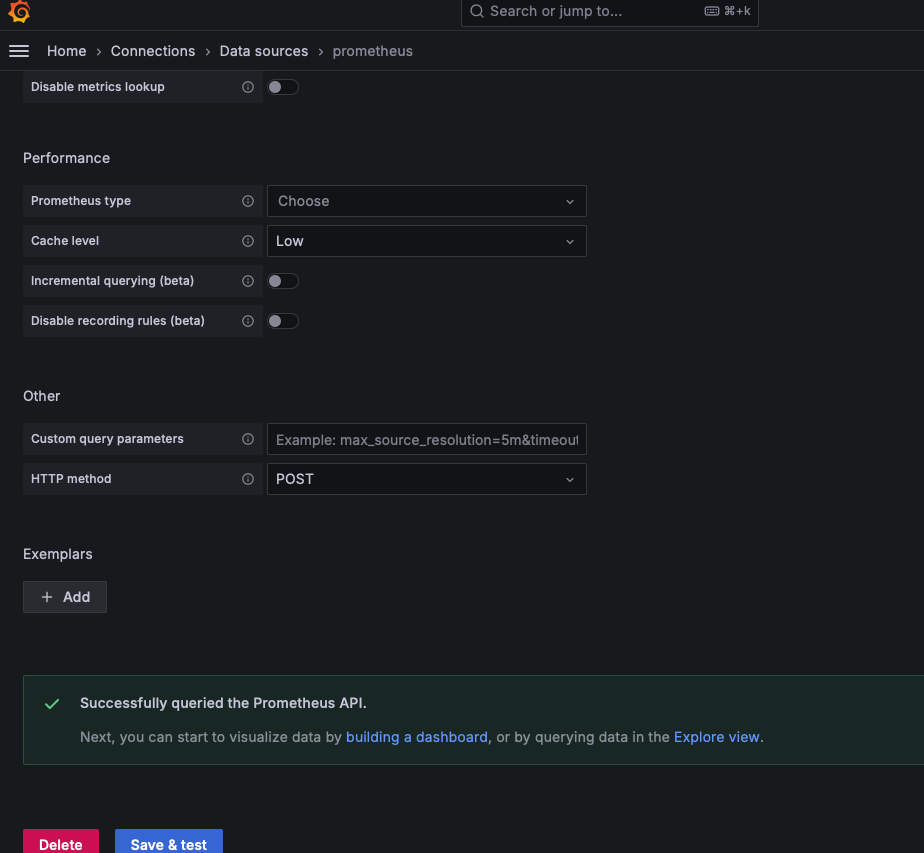
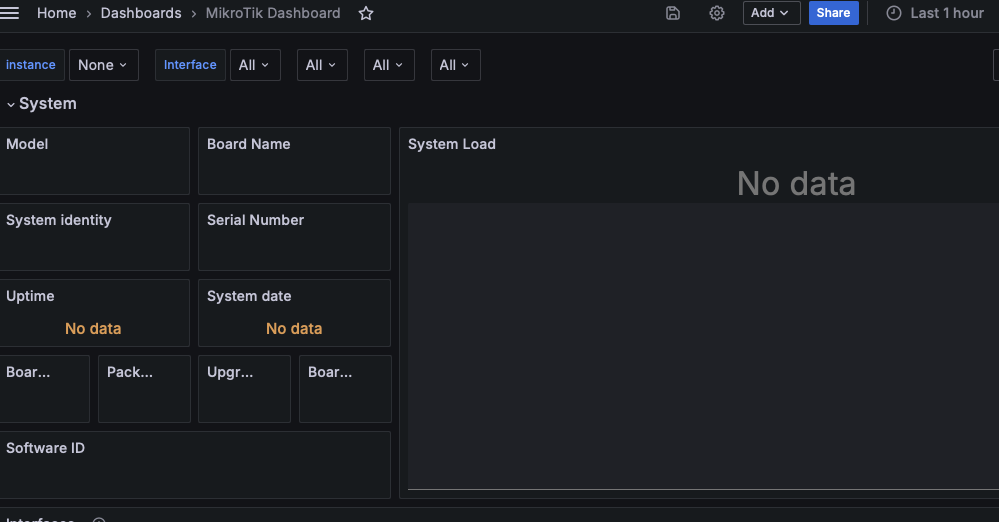
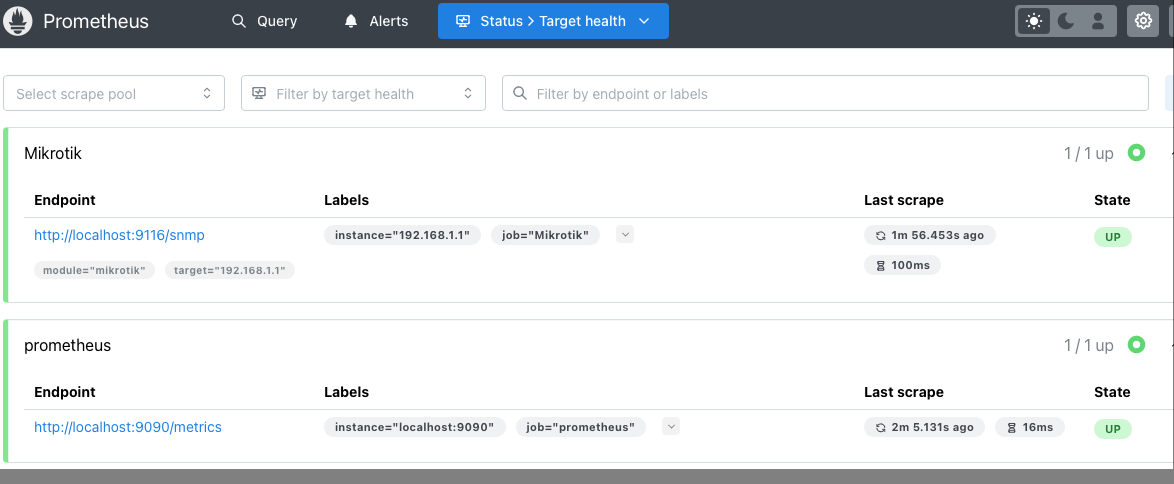
No data shown in the dashboards . Probably the guide isn’t so accurate for actual software.
Is there an updated version to this guide? I seem to be having a lot of difficulty with it. Using Debian 12
thank you for this file. I’m not a programmer by any stretch of the imagination and was wondering how in the world I’m supposed to build the generator.yml file from the MIB script provided by mikrotik (which didn’t make much sense to me either).
Such noob I am, many thanks