This guide is for Ubuntu Server 22.04 and what I call Promstack (Grafana, Prometheus, and snmp_exporter).
Have an installed, updated Ubuntu 18.04 or newer (preferably 22.04).
Prep for Prometheus install:
sudo apt update && sudo apt dist-upgrade -y
sudo groupadd --system prometheus
sudo useradd -s /sbin/nologin --system -g prometheus prometheus
sudo mkdir /var/lib/prometheus
for i in rules rules.d files_sd; do sudo mkdir -p /etc/prometheus/${i}; done
sudo apt update
sudo apt -y install wget curl
----------------------------------------------------------------------------------------
Install Prometheus:
mkdir -p /tmp/prometheus && cd /tmp/prometheus
curl -s https://api.github.com/repos/prometheus/prometheus/releases/latest | grep browser_download_url | grep linux-amd64 | cut -d '"' -f 4 | wget -qi -
tar xvf prometheus*version*.tar.gz (say prometheus-2.18.0)
cd prometheus*version*/
sudo mv prometheus promtool /usr/local/bin/
prometheus --version
sudo mv prometheus.yml /etc/prometheus/prometheus.yml
sudo mv consoles/ console_libraries/ /etc/prometheus/
----------------------------------------------------------------------------------------
Create Prometheus Service File
sudo nano /etc/systemd/system/prometheus.service
[Unit]
Description=Prometheus
Documentation=https://prometheus.io/docs/introduction/overview/
Wants=network-online.target
After=network-online.target
[Service]
Type=simple
User=prometheus
Group=prometheus
#ExecReload=/bin/kill -HUP \$MAINPID
ExecStart=/usr/local/bin/prometheus \
--config.file=/etc/prometheus/prometheus.yml \
--storage.tsdb.path=/var/lib/prometheus \
--web.console.templates=/etc/prometheus/consoles \
--web.console.libraries=/etc/prometheus/console_libraries \
--web.listen-address=0.0.0.0:9090 \
--web.external-url=
SyslogIdentifier=prometheus
Restart=always
[Install]
WantedBy=multi-user.target
Adjust directory permissions:
for i in rules rules.d files_sd; do sudo chown -R prometheus:prometheus /etc/prometheus/${i}; done
for i in rules rules.d files_sd; do sudo chmod -R 775 /etc/prometheus/${i}; done
Create, Enable and Start Prometheus:
sudo chown -R prometheus:prometheus /var/lib/prometheus/
sudo systemctl daemon-reload
sudo systemctl enable --now prometheus
sudo systemctl status prometheus
----------------------------------------------------------------------------------------
With Prometheus now running we can get snmp_exporter installed. Version 0.21.0 was latest at time of writing this.
snmp_exporter page [url]https://github.com/prometheus/snmp_exporter[/url]
wget https://github.com/prometheus/snmp_exporter/releases/download/v0.21.0/snmp_exporter-0.21.0.linux-amd64.tar.gz
tar xvf snmp_exporter-0.21.0.linux-amd64.tar.gz
sudo mv snmp_exporter-0.21.0.linux-amd64 /etc/prometheus/snmp_exporter
----------------------------------------------------------------------------------------
Create snmp_exporter service file:
sudo nano /etc/systemd/system/snmp_exporter.service
[Unit]
Description=Mikrotik SNMP Exporter
[Service]
User=prometheus
ExecStart=/etc/prometheus/snmp_exporter/snmp_exporter --config.file="/etc/prometheus/snmp_exporter/snmp.yml"
[Install]
WantedBy=default.target
----------------------------------------------------------------------------------------
Edit /etc/prometheus/prometheus.yml
You can clear out the existing file and copy the contents of the sample prometheus.yml file attached to this post.
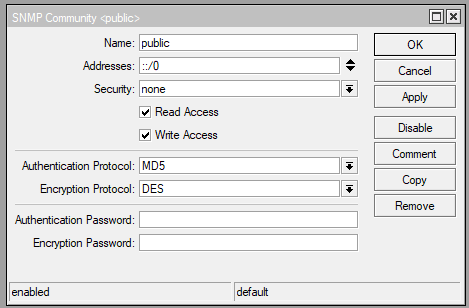
Edit /etc/prometheus/prometheus/snmp_exporter/snmp.yml (I typically delete the existing file and copy the contents of the snmp.yml file attached to this post.) [b]Do not forget to adjust the SNMP_COMMUNITY near the top of the snmp.yml file.[/b]
----------------------------------------------------------------------------------------
Create, Enable and Start snmp_exporter:
sudo systemctl daemon-reload
sudo systemctl enable --now snmp_exporter
sudo systemctl status snmp_exporter
sudo systemctl restart prometheus
----------------------------------------------------------------------------------------
Lastly we install Grafana. Version 9.3.6 was the latest at the time of writing this.
sudo apt-get install -y adduser libfontconfig1
wget https://dl.grafana.com/enterprise/release/grafana-enterprise_9.3.6_amd64.deb
sudo dpkg -i grafana-enterprise_9.3.6_amd64.deb
sudo systemctl enable --now grafana-server
sudo systemctl status grafana-server
You will need to open port tcp/3000 on Ubuntu Server UFW to allow access to grafana.
sudo ufw allow 3000
----------------------------------------------------------------------------------------
Login to Grafana with default creds admin/admin. It will ask you to change admin password.
Once in Grafana, go to Settings (gear icon) on lower left side and select Data Sources.
Click Add New Data Source and select prometheus.
Under HTTP fill in URL = http://localhost:9090
Scroll down and click Save Test. You should get a success message.
----------------------------------------------------------------------------------------
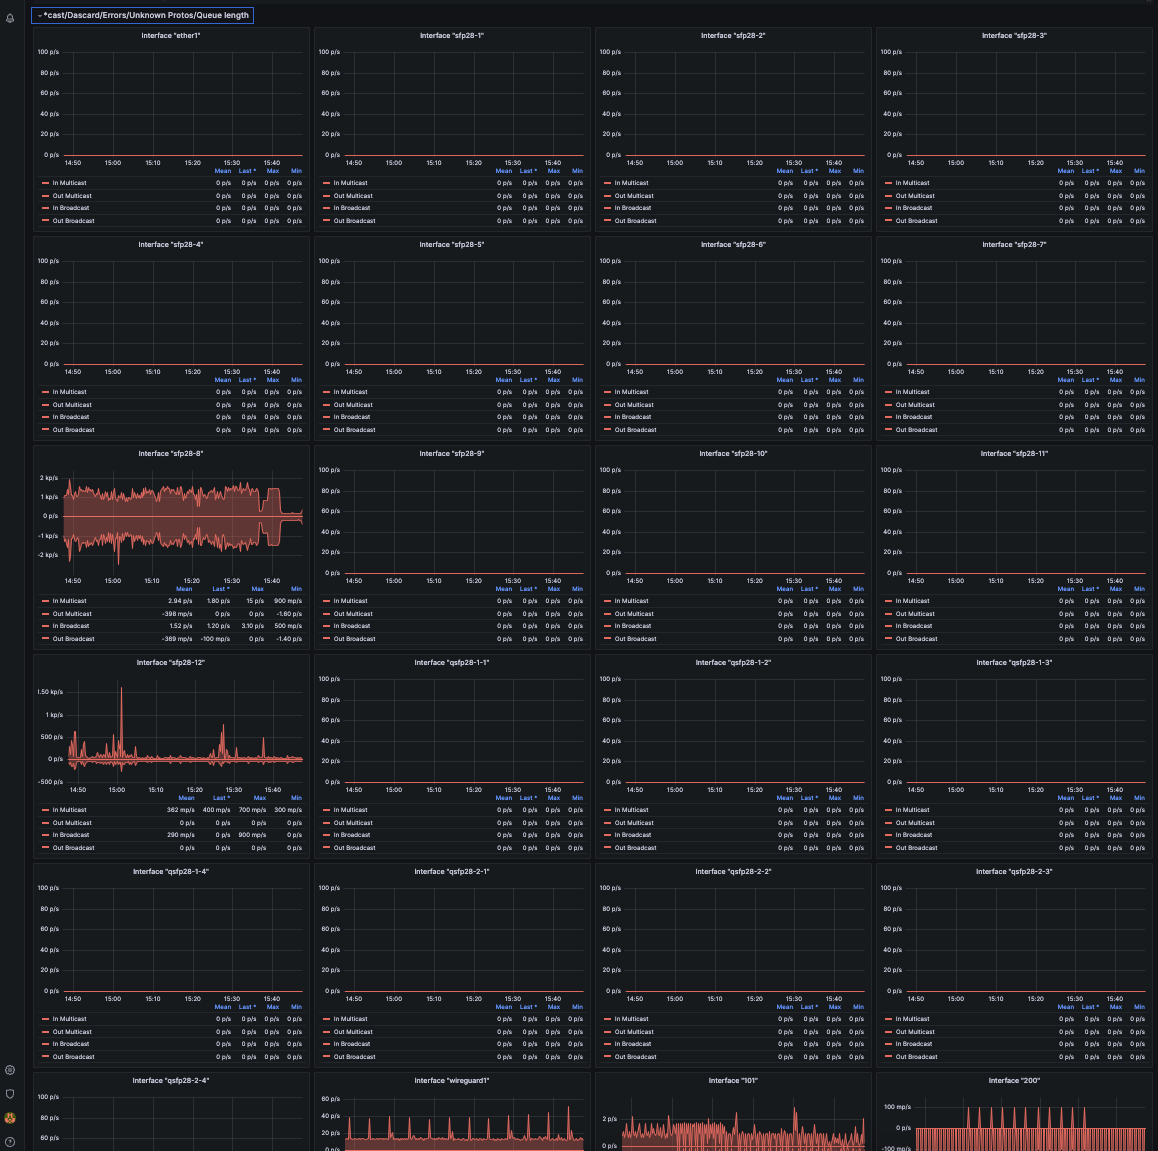
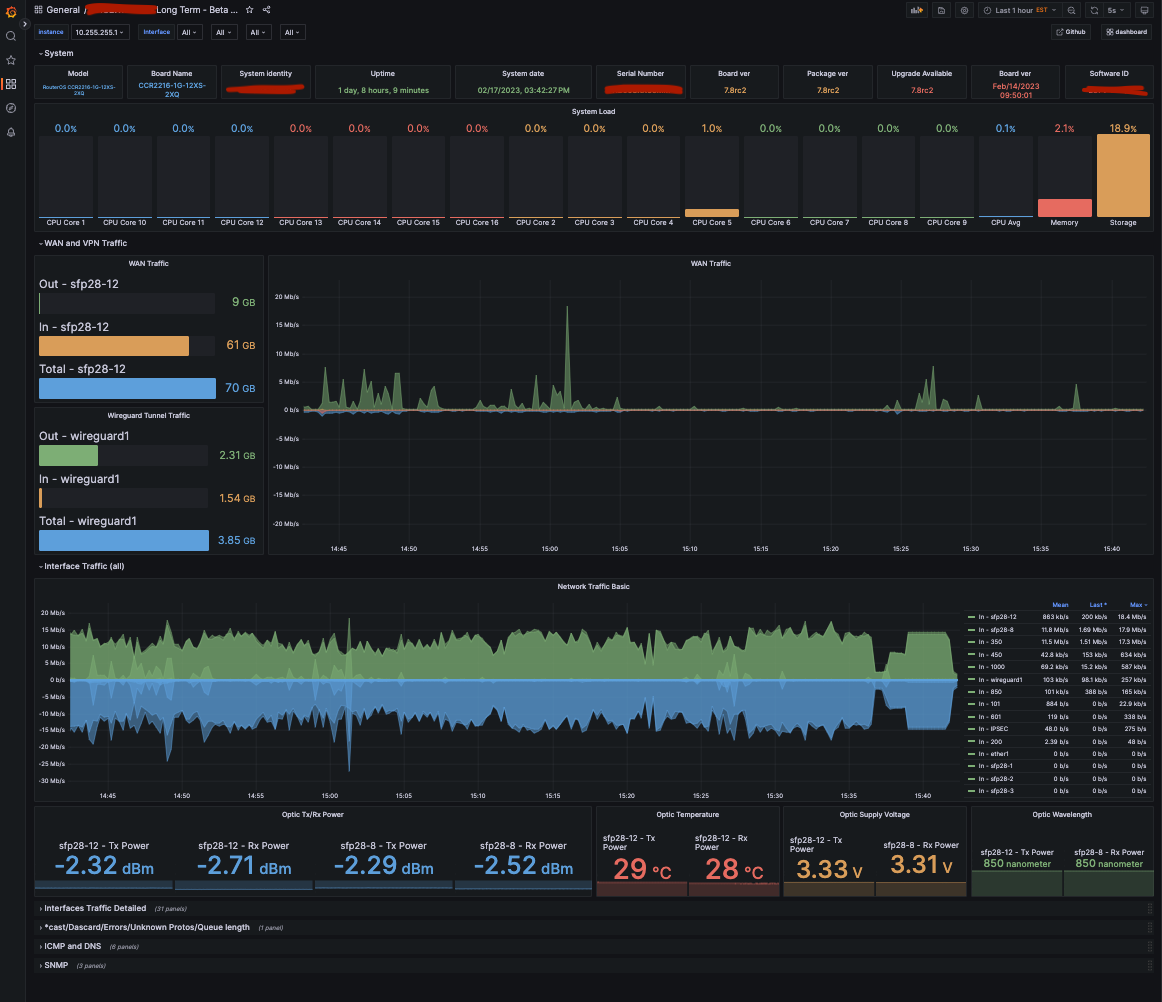
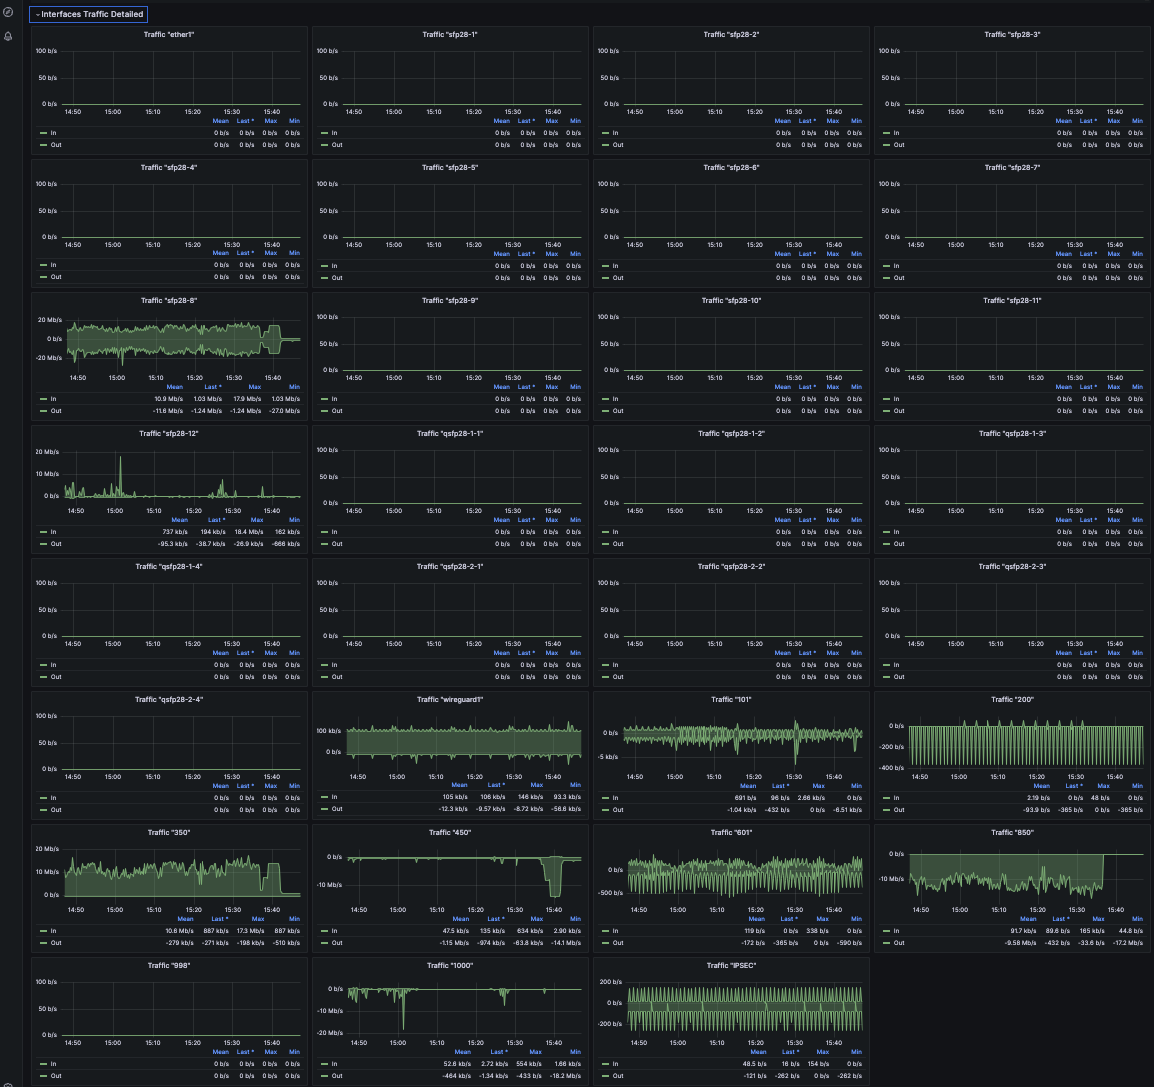
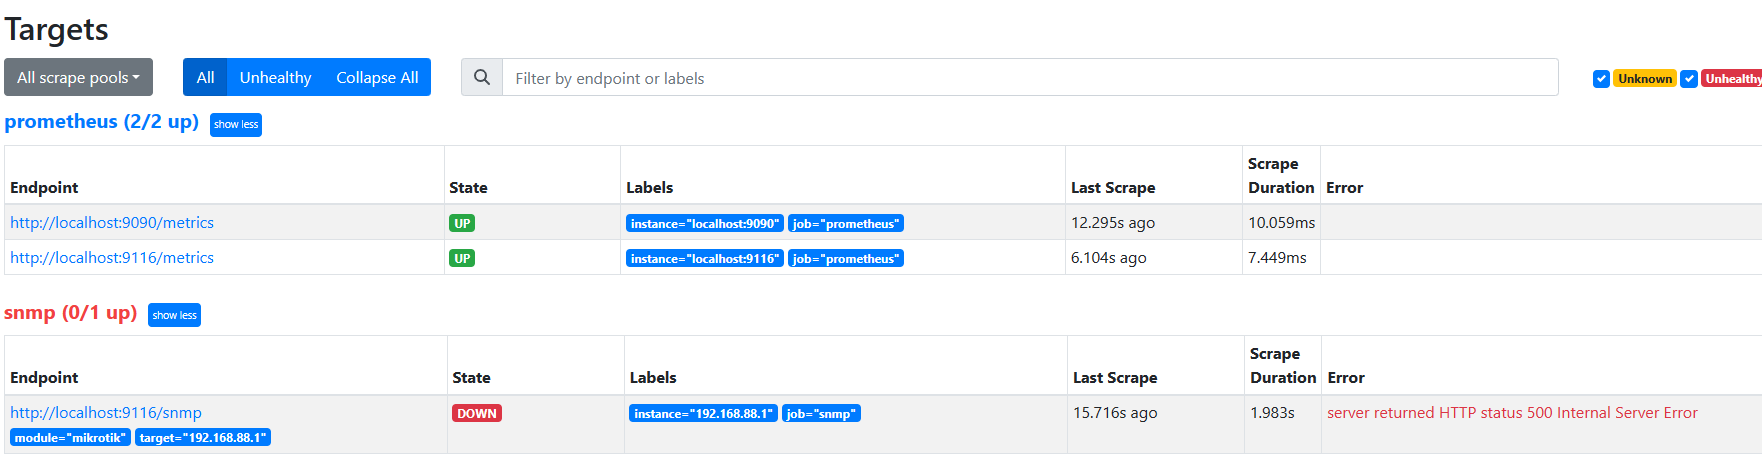
With Prometheus, snmp_exporter and Grafana running and configured you should be collecting SNMP data from your Mikrotik(s). There are a few pre built dashboards out there. I ended up building my own.
Thanks from me alse @bruins0437! I already had things running, but needed to update snmp_exporter and Prometheus and for the life of me couldn’t remember how I did it. Documented it this time
Might I add that running SNMP v2 isen’t secured and SNMP v3 is supported both by MikroTik and snmp_exporter.
May I ask you how did you generate your own snmp.yml?
My Mikrotik router is CCR2004 and it seems to me that many of OIDs in your snmp.yml are not working with my CCR2004
I repeated all your steps, imported 18460 Dashboard at final step and have working only some things in Grafana: Model,Board Name, System load, Board ver, Interface Colored Table.
But anything below Interface Table is not working. For example all ethernet “Traffic” panels are empty. They have real ethernet names but have no data.
@bruins0437 I am very new to this, so all I can do is copy-paste and cross my fingers that it works. I managed to work this out somewhat for my HEX lite.
I wanted to have a panel that shows data consumed per month for each interface, mainly the pppoe ones. Can you please help me by explaining the steps?
Its awesome tools!
But i have a question and can not find it in the other forums,
if I want to monitor the latency from mikrotik to specific destination using grafana and prometheus, is there any tools regarding this?
by example, if I have mikrotik A and I want to monitor latency from Mikrotik A to Google DNS, and I want to graph the average / loss latency using prometheus and grafana
is this possible?
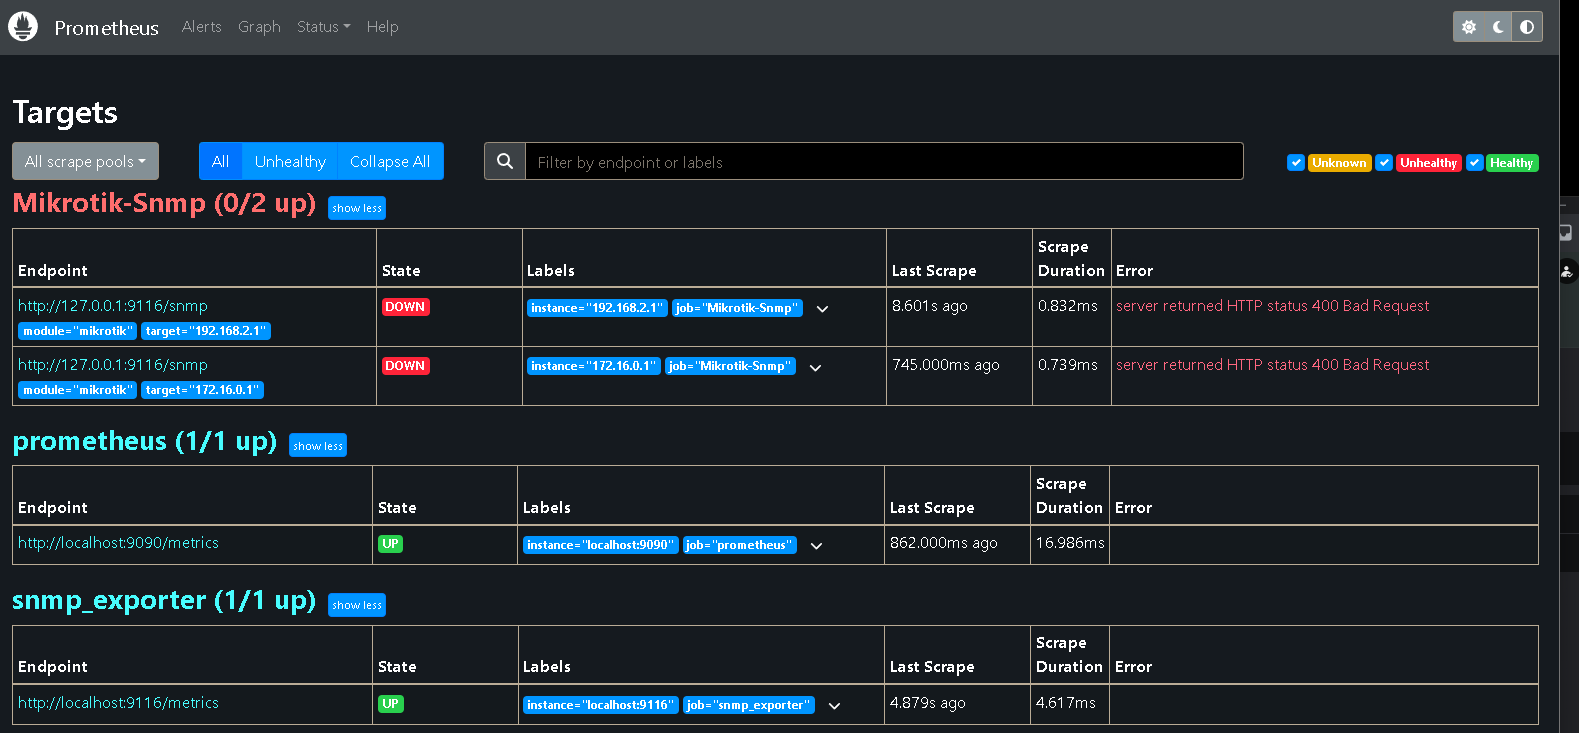
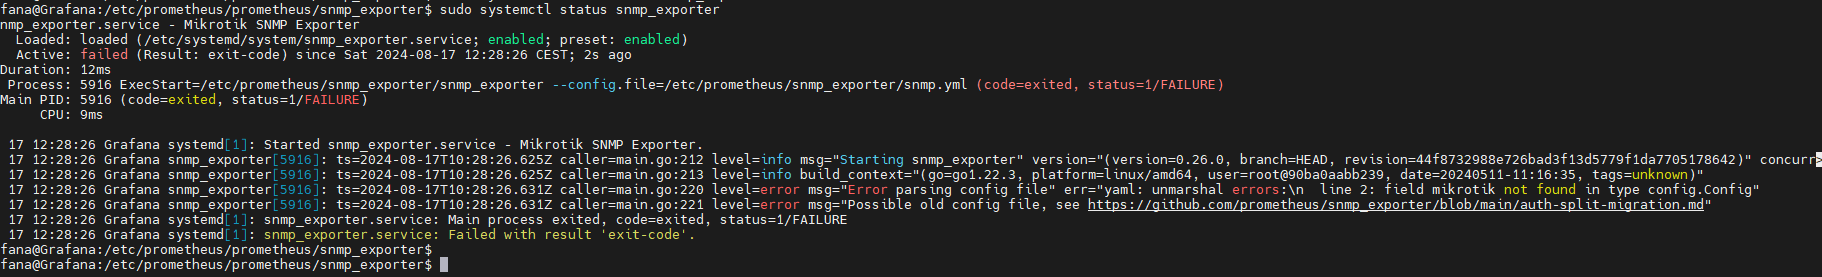
error with snmp_exporter 0.21 and config from this forum
…getnextbulk(N:0, R:25) 1.3.6.1.4.1.14988.1.1.14.1.1.51.7
v3 err: 3 unknown engine id
v3 err: 1 not in time window or incorrect engine boots
This is the Original error that I want to identify with the logs
I understand that to enable the logs I have to add this line --log.level=debug to the file “prometheus.service”
hi,i already followed your guide and i can open the prometheus and grafana interface.but my problem is no data is showing on grafana and now im curious where did i do wrong?i did try the snmp tester and i can get the data.it means that the config i do on mikrotik is right.but something gone wrong in the yml filei think.
did i missed something?
in snmp.yml do i need to change all the oid to my mikrotik specific oid?