I am assuming that the interface oid is changing every time the user logs in? When you select the interface in the drop down does it have a slightly different look? More detail would be good like how you configured the existing probe.
Yes OID changes when client pppoe session is terminated.
I don’t know how to get a static oid for the sessions. There was a instruction set somewhere on google, but can’t find it now.
What info do you need, it’s a standard usermanager + pppoe server setup. I would like dude to graph usage, but as soon as customer disconnects and reconnects for whatever reason the graph is not working cos it get new oid on reconnecting.
Changing OIDs is a pain, there is not a good way for the dude to determine what new oid it becomes.
Maybe the oid is always one of a certain group of oids? Could you use part of the oid to make your own rate calculation. or create a link for each oid and just track them all? Just ping the other side? Or do they get a dynamic address? Probably not any good solutions here…
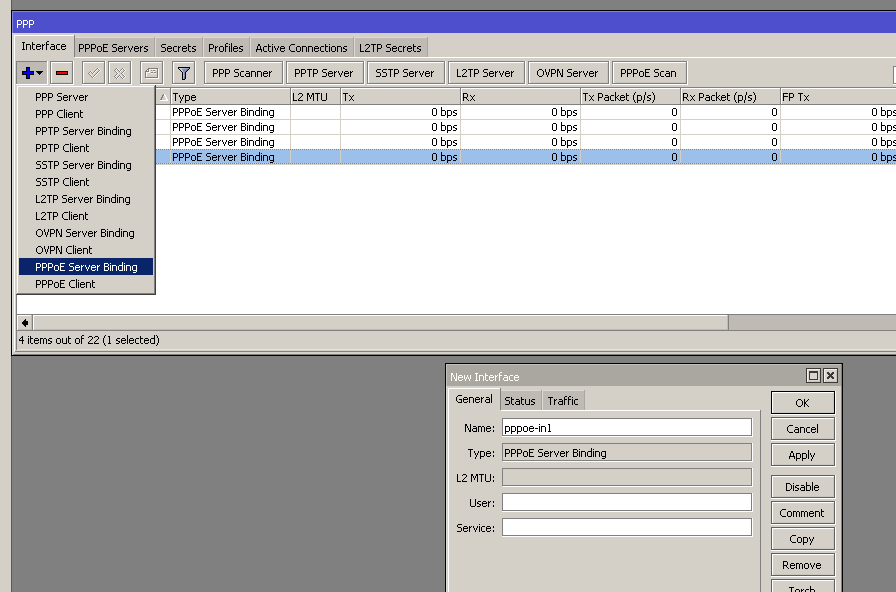
My bad I used incorrect term. I meant that you need to create static PPPOE server bindings for those users that you want to monitor. On next reconnect the dynamic server bindings will no longer appear and this user will now be tied to this static server binding. Then from this entry use oids for monitoring.
In Interface configuration enter User and Service field if present in your configuration.
Very similar in CLI side: “/interface pppoe-server add service=example user=example”
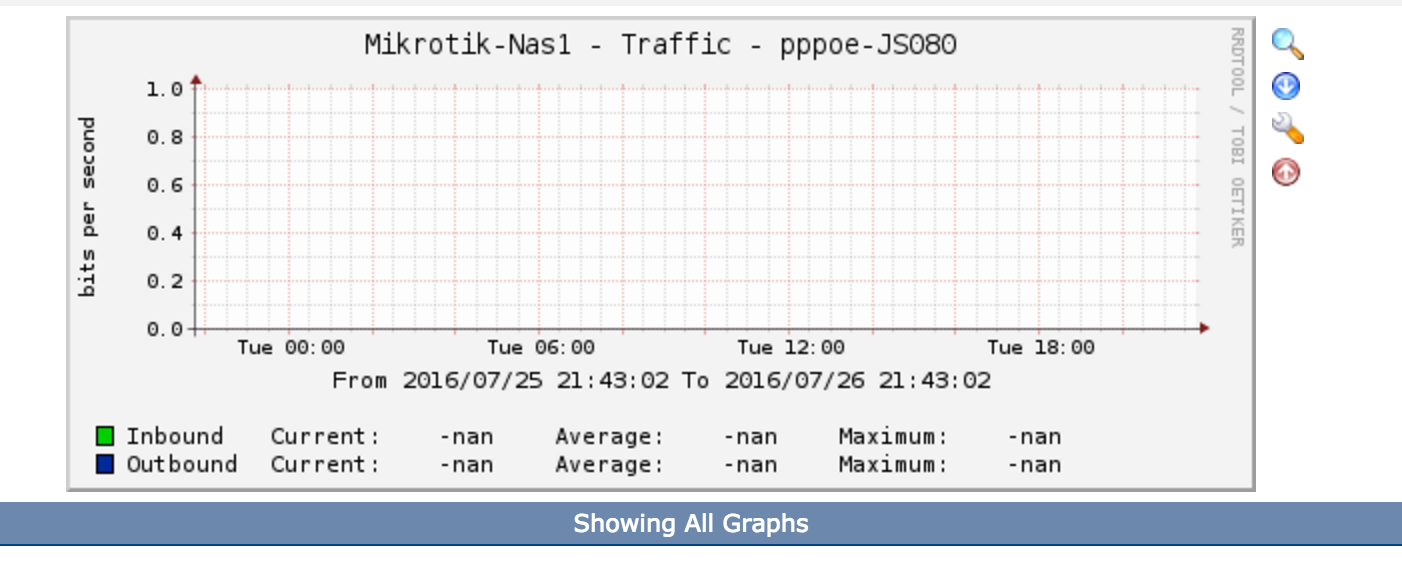
Yes, Dynamic entry wont be shown anymore. Only the static static server binding will be in interface list. And what do you mean by “0 usage”? If you mean traffic, then possibly new connections haven’t yet been made from client side.
I mentioned that, before this new binding will become active reconnect of this user is needed. I did not say that it will happen automatically.
Okay fine.
I logged him out and then it auto logged in again. So, I guess login is working fine.
Now what do I copy from this mcirotik user to monitor his graph in cacti or MRTG ?
His MAC ID ?
Now find the OIDs that you need from that interface and use them where you intended.
[admin@MikroTik] > interface print oid where name~“pppoe-user-test”
Flags: D - dynamic, X - disabled, R - running, S - slave
0 R name=.1.3.6.1.2.1.2.2.1.2.19 actual-mtu=.1.3.6.1.2.1.2.2.1.4.19 mac-address=.1.3.6.1.2.1.2.2.1.6.19
admin-status=.1.3.6.1.2.1.2.2.1.7.19 oper-status=.1.3.6.1.2.1.2.2.1.8.19
bytes-in=.1.3.6.1.2.1.31.1.1.1.6.19 packets-in=.1.3.6.1.2.1.31.1.1.1.7.19
discards-in=.1.3.6.1.2.1.2.2.1.13.19 errors-in=.1.3.6.1.2.1.2.2.1.14.19
bytes-out=.1.3.6.1.2.1.31.1.1.1.10.19 packets-out=.1.3.6.1.2.1.31.1.1.1.11.19
discards-out=.1.3.6.1.2.1.2.2.1.19.19 errors-out=.1.3.6.1.2.1.2.2.1.20.19
Presuming that your NMS is prepared for MikroTik device monitoring. Template or mib imported, etc.
[soamxxx@xxxx] > interface print oid where name~“JS080-monitoring1”
Flags: D - dynamic, X - disabled, R - running, S - slave
0 R name=.1.3.6.1.2.1.2.2.1.2.28 actual-mtu=.1.3.6.1.2.1.2.2.1.4.28 mac-address=.1.3.6.1.2.1.2.2.1.6.28
admin-status=.1.3.6.1.2.1.2.2.1.7.28 oper-status=.1.3.6.1.2.1.2.2.1.8.28 bytes-in=.1.3.6.1.2.1.31.1.1.1.6.28
packets-in=.1.3.6.1.2.1.31.1.1.1.7.28 discards-in=.1.3.6.1.2.1.2.2.1.13.28 errors-in=.1.3.6.1.2.1.2.2.1.14.28
bytes-out=.1.3.6.1.2.1.31.1.1.1.10.28 packets-out=.1.3.6.1.2.1.31.1.1.1.11.28 discards-out=.1.3.6.1.2.1.2.2.1.19.28
errors-out=.1.3.6.1.2.1.2.2.1.20.28