How to graph values despite error state

Hi guys,

I’m running into a problem of which I don’t have the faintest idea how to get this working the way I want it to work..
The case itself is pretty easy..

We’ve sensorprobes measuring relative humidity in % and/or temperature in degrees C via SNMP.
In the real-life example below I use the settings I currently use for monitoring RH in %
I created a function that graphs the returned value, but.. there seems to be something going otherwise then I would expect it…

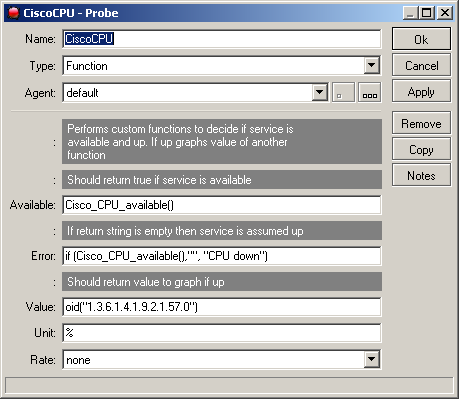
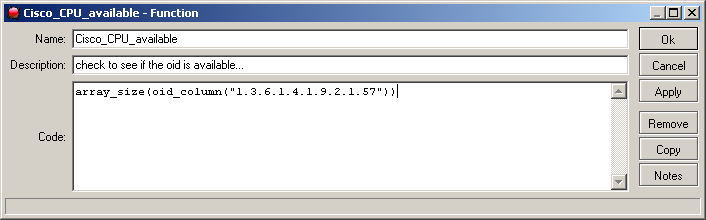
First of all The Dude checks if the OID is available
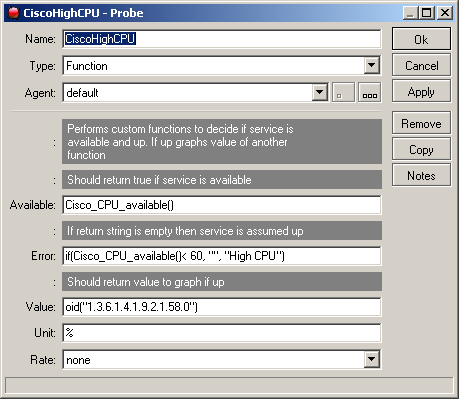
When the returned value is below 30 % or above 70 % the value enters error state.
Then I expect the function to graph the returned value and make sure it displays the fact I use %.
Since the whole problem is similar with the function for the temperature I will skip that one..

Below is the function, below the function I continue explaining what is not working with me..

NAME: RH #1
TYPE: FUNCTION
AGENT: DEFAULT

AVAILABLE: if(oid(“1.3.6.1.4.1.3854.1.2.2.1.17.1.3.0”)>0,1,-1)

ERROR: if(or(oid(“1.3.6.1.4.1.3854.1.2.2.1.17.1.3.0”)<30,oid(“1.3.6.1.4.1.3854.1.2.2.1.17.1.3.0”)>70),concatenate(“Relative Humidity out of range. Value = “,oid(“1.3.6.1.4.1.3854.1.2.2.1.17.1.3.0”)),””)

VALUE: oid(“1.3.6.1.4.1.3854.1.2.2.1.17.1.3.0”)

UNIT: %

RATE: none

Whenever the returned value is within the threshold everything does what it is supposed to do..
The value is in OK state, nothing wrong there. The function graphs the value as expected and colourstate is green.

But.. when the returned value is below or above the configured threshold the function does enter error state, but the values don’t get graphed any more, colourstate changes to something not green.. Since I’m a disaster in coding functions I’m begging for help here.. :wink:

My request/question is..
Is it possible to make sure the value gets graphed even when it is in error state which ofcourse should be propogated within the Dude for further processing like alerts/changes in colourstate etc?

I think it is better to see a value drop or spike outside the threshold than ignoring it at all when in error-state.
Maybe it is possible to create the threshold within the Dude in another way, eg entering OID and min/max values?
Maybe the coding for function could/should have functionality to create graphs even when values are in error-state by ticking a box?

Personally, I wouldn’t be surprised if this behavior is partly responsible for the gaps in the graphs within the Dude.
It could explain the empty places within graphs when the graph depends on (builtin) functions which return a value in error-state. (imagine ping to time-out in 3 sec, this function/probe to return frequently > 3sec would give gaps in the graph).

I hope to hear from you guys!

Best regards,
Minollie

I was able to do this with two probes, be careful if you copy and paste a probe. It will put it on every device the original probe is already on. If you decide not to graph with the 2nd probe changing it will break the first probe and you will have to go into every device, turn off and back on graphing for the first probe. You will lose graph history as well. You would be better off creating the probe from scratch if you are going to use 2 probes.

In my setup I graph Cisco cpu with the first probe and and the second probe complains if high cpu.

There must be a way to do both with a function. It would be nice if they had a check box that just graphed while in error. Along those lines it would be nice if they stuck the last value read into the text on the bottom of the graph.

When you create a probe it is better to use a function to check if the OID is available, this will cause the probe to only install on devices that actually have the OID. Check out the probe thread on page 2 near the bottom.

If you decide to try to build a function to do both be sure to let us know, that would very nice and it would cut down on redundant probes.

To solve gaps in the graphs in the dude (if you are running windows) download sysinternals process explorer and set the dude process to high. If possible reduce the number of probes you are running. I could not get good graphing with 1700 devices. At ~150 devices graphing works great.

@ Sweetdude:

Hi again, I’m afraid that using 2 different probes is not such a good solution but maybe I’m wrong about that.
I now have one probe trying to figure out if the value is within the thresholds of 30-70% and graphing values when they’re within the threshold.
This probe is not graphing when returned values are outside the threshold.

I fear that when you create one more probe graphing every value above or equal to 0 it gets returned you never have a device fully down anymore..
If I understand you correctly you suggest me creating a probe that graphs any value above or equal to 0, but since it should trigger an alert when it’s in error-state how can I achieve this (remember me being a disaster in coding? :wink:)

Can you help me a hand so I can try something here?

Thanks in advance!

Regards,
Minollie

Oh yeah I should have spelled it out more fully…

You will be modifying your old probe at a later stage by changing it so that the only time it is in error is when it can’t read the oid but first lets setup the new probe.

Create a new probe and give it a name like temp-notification. Build it exactly like the old probe but DO NOT use copy/paste to create the new probe.

Install the new probe on one device and on the history tab uncheck graph history for the new probe “temp-notification”. Verify that the new probe works by putting the device in an error state. You should see an error for both probes.

Now if both probe are in error, things look good, You can now modify the original probe so that it doesn’t show errors, instead of >30<70 on the error line just put (if blabla,“”,error). The new probe will keep complaining that there is a temp-notification. The old probe will return to normal and start graphing again. This is exactly how I am using two probes.

Let that run for a few minutes you should see that the new probe is complaining that things are out of spec and the old probe is still graping just like you want it to. Now install the new probe on each device one at a time and uncheck graph history for “temp-notification” each time you add it. That way it doesn’t graph, it just complains and the other one graphs but doesn’t complain.

Just to be clear if you copy and paste the old probe you will lose your graphing when you try to correct it, you will still have to visit each device and disable/enable graphing. SO do not copy and paste the old probe create it by clicking NEW!!!

I hope that helps and I am glad to help where I can for such a kick ass tool even if it has a few short comings.

AND were you able to clean up the gaps in your graphs?

My original suggestion is to try to create a function that complains based on the existing probe. The method above doubles the number of probes but doesn’t graph for the duplicated probe and is the easy way to do what you want.

If I get some time I will try to create that probe that graphs and gives notification but continues to graph. Don’t hold me to it though since the simple solution works and I know how to do that :slight_smile:.

The part I was refering to about graphing when a value is 0 is completely seperate but all probes should be build with a function that looks at the OID. Like the CiscoCPU probe in the probe thread. This is more of a technicality due to the issue when using the discover button on the services tab of a device. If you notice when you click “discover” the probes built without a function to check if the oid exists tend to get added even when the oid doesn’t exist (Specifically WHEN the error line has “>=0” ). Also these types of probes will not show down when they are actually not even able to read the oid.

Sorry that is so hard to explain but damn easy to understand once you fight it for a couple months. So if you have a probe that doesn’t work correctly (specifically when the value returned is zero) just use the CiscoCPU probe as a template.

Hi guys…

Status update… Well, everything still not as I want it to be..

Whatever I try results in gaps within the graph when values enter error-state..
I tried to do it with one/two/three services/functions to determine whether or not the state is OK, I tried it with a logic probe.. but nothing does what I want.. :frowning:

Now I wonder if it is a Dude thing not to be able to do this..(yet)
I still have another option, but I need to know if this possible before I try it..

I could design SNMP charts for the given OID’s and make these a generic data-source for multiple devices.
I think when I design them they always graph returned values (except when the device is no longer reachable).
Now all I want to know if it’s possible to let these graphs show up when you hover over a device instead of the need to go to them separately.

Regards,
Minollie

Bummer Minollie, I thought you would have it working with no trouble.

Here are my two probes, one to graph all the time and one to complain when the cpu is high. The first one graphs even when the cpu is high, The second one is set to not graph at all(on each device in the history tab).
cpu1.PNG
cpu2.PNG
And the function they both use to read the oid…
avail.PNG
Maybe that makes sense? Sorry if I confused you.
SD

Hi Sweetdude,

I’ll try to do something with the probes the way you made them for CiscoCPU, don’t know when because my schedule is almost entirely full and my (well deserved?) vacation is (finally) closing in (starts next week.. :wink:)..

Anyway, I’ve attached a little document with this post what I (and probably other here too) would like to be able to do..

Simply put..
Create a service (T) which monitors if temperature is between 20 and 25 degrees Celsius (or Fahrenheit), sending alerts if below 20 or above 25, switches to appropiate colourstate per service. Create a service (RH) which monitors if humidity is between 35 and 65 percent (%), sending alerts if below 35 or above 65, switches to appropiate colourstate for the service depending on status etc.. All services are expected to graph the returned value whether the returned value is with the assigned threshold or not. Then we assign these service if needed to a device (ping should not be in use then..) and when one of the service goes down, the entire device state should change into orange, when all of these assigned services go down, the entire device should go down and change into red.

I don’t have much trouble designing probes or something which monitor the values, but I just seem to be unable (to stupid if you like.. :wink:) to create one single probe able to do what I explained above or join several probes to get the thing done..
In case of one probe: I can’t get it to graph when it’s out of bandwidth, that is my original problem..
In case of several probes: I can’t get it to work since you have to design it in a way that is logic..
Eg: Probe 1: checks if T >= 20 C, Probe 2: checks if T <= 25
Using logic and: one of them is in error, device turns orange (not red, don’t know why..)
Using logic or: one of them is always OK since they’ve values in common between 20-25 C.
Using logic not: not going to work since values should never been < 20 or > 25 C, so it’s Ok when it’s actually not..

Eg: Probe 1: checks if T < 20 C, Probe 2: checks if T > 25
Using logic and: is impossible.. value can never be less than 20 and higher than 25 in the same time to give probe OK-state, device always partially down
Using logic or: not going to work, if the value is < 20 or > 25 to say OK to probe, the value is out of thresholds and in error.. device should be (partially) down
Using logic not: could/should work but didn’t in my case..

The biggest problem is that whenever I create something that monitors a certain value The Dude stops graphing returned values when they are in error, I think this is an unwanted behaviour (or it shouldn’t be by default..)

I can create graphs using probes that monitor a SNMP OID and keep graphing, but these I can’t use for error states (not single, not joined with other SNMP probes).
Another disadvantage of these graphs is that they don’t automatically show up when you hover over a device.

Maybe there is a way to combine probes/functions/graphs in a nice and beautiful way to accompish my goal, but I seem to be unable to find it right now.
Any help is greatly appreciated (as usual guys..).

The attached document shows even more tuning for the thresholds, I could live perfectly with just green for ok, red for out of threshold.
If functionality could be designed with more tuning that is fine by me, but I won’t argue when it’s not..

Regards,
Minollie
Thresholds_new.doc (30 KB)

Agreed we just need that fixed instead of finding a work around, They should seperate the graph value from the error value or something :slight_smile:

When I get some time I will try to solve it with a function but I don’t know if it is possible…

Have a great vacation.
SD