Good day.
Tell me please, how i can see uptime of the ethernet port in RouterOS?
(Whithout searching in log)
Good day.
Tell me please, how i can see uptime of the ethernet port in RouterOS?
(Whithout searching in log)
:put [/system resource get uptime]
I need uptime of the physical link ether1. No system uptime.
check logs there is time stamp when ether port status change
He wrote: without searching in log
here it is ,
I hope to find more easy way than parsing log, but thank you for answer. (This level of scripting too difficult for me)
I need it in winbox. Very useful information - if port flapping.
Thanks
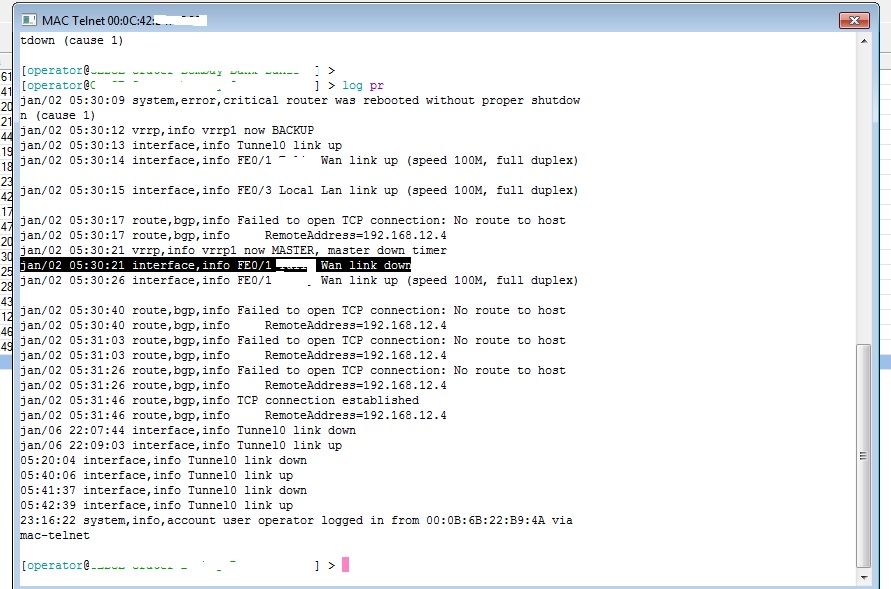
you just need to open new terminal in winbox & type " log pr" it will show you log informations
Log have few lines. I do not see a few days back. This is useless
set up remote logging, keep log in database, and have separate section that filters out ethernet status
Yes, it is possible. But have you plans show Ethernet uptime in winbox or in terminal? Thanks
to implement this, we would basically have to do the same as I suggested to you ![]() We will see, maybe there is another way
We will see, maybe there is another way
hi normis,
thanks for trying anotherway to include that, in ether–>status mentioning last three
like
honzam
you can also try to run script for the same , when status change
i second honzam and samir94 request.
Normis it helps a lot to check port flapping or power issues at client sites.
I have a RB1100AHX2 up for over 80 days but I am not sure if ethernets have been up for so long.
Logs often show ether link down and up.
Any news?
It would be great if Mikrotik include PORT uptime that can be viewed with comamnd/gui or pulled via snmp query too ![]()
Currently I am monitoring Cisco Switch/ASA and Mikrotik Port status using Mikrotik ‘DUDE’. I have customized it according to my need like if main feed link is down, it sends sms and email alert to concern area engineer. Using it you can create scripts to perform according to requirements.
You can also use MRTG or SMOKEPING to keep a detailed usage/quality of transmission. Specially smokeping is great
/interface print detail
look for
last-link-up-time
(see also last-link-down-time)
There are a number of additional columns (in addition to the defaults) that can be selected for display through winbox. For example, in the PPP | Interface screen, columns may be selected to display TxBytes, RxBytes, TxPackets, RxPackets, RemoteAddress, etc.
The command
/interface sstp-server print detail terse file=xyz
does print out a few of the available columns, but not all that are selectable through winbox.
How is it possible to select all of the available columns for printing (or writing to a file using the file=xxx print parameter)?
The last-link-up-time/last-link-down-time was introduced by RouterOS 6.22 nov/11/2014 (was not present in 6.20).
To see these values from the command-line, use
/interface print detail terse
This information is not present under the “/interface TYPE print detail” command, only the top-level “/interface print detail”. Use “where type=FOO” to limit to a particular type. “terse” is required, otherwise the display will be shortened to fit your terminal width and the fields you want will probably be omitted.
E.g.
/interface print detail terse where type=eoip