Hello,
Have a RB1100 \w RoS V5.7, the problem is, mostly time, my CPU tends to reach 100%.
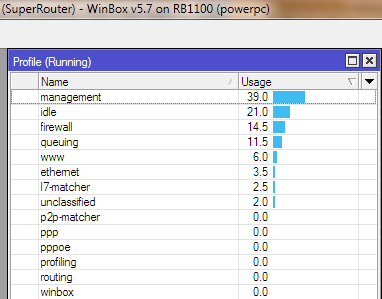
from /system profile, the most used process (above 40%) is named “management”.
My question is, what is that process and what its functionnalities ?
Thanks.
Hello,
Have a RB1100 \w RoS V5.7, the problem is, mostly time, my CPU tends to reach 100%.
from /system profile, the most used process (above 40%) is named “management”.
My question is, what is that process and what its functionnalities ?
Thanks.
Our RB1100 was doing the same thing on v5.5. I upgraded it to v5.7 and it seems to have stopped for now. I hope it doesn’t come back.
I am having the same problem with 5.7 on x86. Management uses all the cpu and it constantly runs into 100%. I have an Intel 2.4Ghz CPU with 756MB Ram and 80GB Hdd.
Send a supout when it is happening.
Read in another post about someone who had a similar problem so i changed my dude settings on the specific device and unchecked the Router OS checkbox in the general tab in the dude. It seems to have solved the problem. ![]()
[quote=“st3ph4n3”]Hello,
Have a RB1100 \w RoS V5.7, the problem is, mostly time, my CPU tends to reach 100%.
from /system profile, the most used process (above 40%) is named “management”.
My question is, what is that process and what its functionnalities ?
Thanks.[/quote
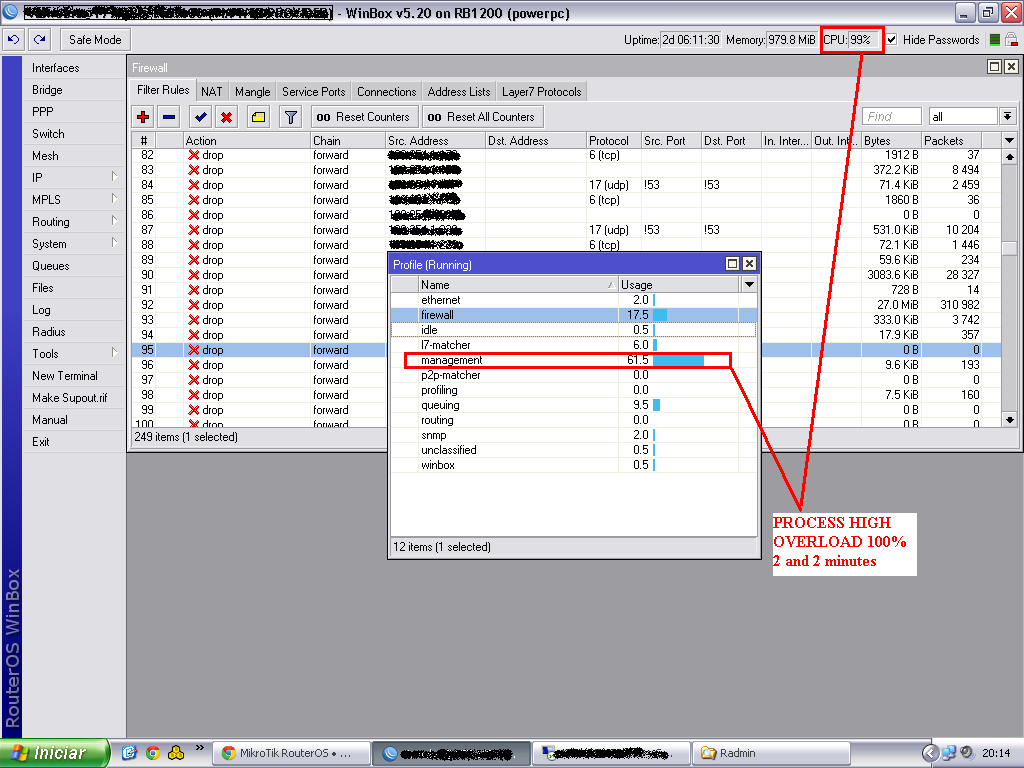
I have a RouterBoard RB1200 with the same problem.
And uitlizo version router O.S. 5.20
She is in the processing overload on 2 times in 2 minutes in the 5 on 5 in management.
This is a abusurdo … View Screen.
I hope that staff correct it as soon as possible, because it is a mistake without stand or head.
I had the same issue but was because of the snmp in the mikrotik
Thanks m2806
It was the SNMP the culprit, on an RB1100AHx2
My problem started to happen when I disabled dude, for many problems was causing with the Radius…
Once SNMP was disabled, management went to 0
Right after I re enabled SNMP and management stayed 0
Weĺl see next reboot
Today for the first time in 3-4 years of using this router, I encountered this problem on my RB2011UAS-2HnD ROS 6.34.2.
webfig was unreponsive returning “internal server error” after a few mins.
winbox showed “logging in” and then nothing.
Managed to SSH in. CPU was at 100%. Profiler showed Management process as the culprit.
I use an SNMP client for Mac OS X called Peakhour which monitors just 2 interfaces (wlan1 and pppoe1) at 1 sec intervals.
Kicking myself for not making supout when it happened but will definitely do so if it happens again.
Hi, on my RB1100 I constantly have the CPU on 100% load. Profile says Management 80%, unclassified 20%. Tried turning off scheduler (1 script), turning off SNMP, turning of “Router OS” in Dude, but nothing helps, right after reboot the CPU goes back to 100%.
I tried making supout.rif multiple times, it goes thru but doesn’t show under files ![]()
Any ideas?
thanks
Mike
OK I seem to have resolved the issue - I think the NAND was somehow corrupted, as I couldn’t see any files, nor in winbox or cli. So I connected to the router using RS232 + netinstall, formatted the NAND, uploaded the latest .npk and since then everything seems to be alright.
The same problem HAP AC, 6.48.1
Disabling SNMP didn’t help, Dude not use, Radius not in use.
Disabling KID in KID CONTROL - solve problem.
NAME CPU USAGE
l2tp 0%
snmp 0%
spi 0%
ethernet 3%
console 0.5%
ssh 0%
dns 0.5%
firewall 7.5%
networking 10%
winbox 0.5%
logging 0.5%
management 27.5%
encrypting 0%
routing 0.5%
queuing 0.5%
bridging 0.5%
unclassified 6.5%
total 58%
Hi, I have a ssl process in profiler taking up 80% of CPU, and together with other lower processes the CPU gets 100% after every 3 days, so need to reboot my router and then it goes again to 100% after 3 days. www-ssl is turned off. So what is that ssl procees, any idea?
Same problem on RB4011iGS+ 7.6 (stable):

Plz help, how can i fix it?
Most often the management process services winbox connection(s). Depending on number of open windows in winbox and the type of data it can cause considerable load on ROS device. To find out if it’s indeed winbox that’s hogging CPU close winbix connection(s) and connect via CLI (ssh). Then run /tool profile cpu=all to see what uses CPU cycles.
No, it does not help:
[admin@] > /tool profile cpu=all
Columns: NAME, CPU, USAGE
NAME CPU USAGE
ovpn 0 0%
ethernet 0 0.5%
firewall 0 3%
networking 0 5.5%
management 0 89%
routing 0 1%
bridging 0 0%
unclassified 0 1%
cpu0 100%
ethernet 1 0.5%
firewall 1 3.5%
networking 1 2.5%
management 1 7.5%
routing 1 1%
bridging 1 0%
unclassified 1 1%
cpu1 16%
ovpn 2 0%
ethernet 2 2%
console 2 0.5%
ssh 2 0%
firewall 2 1.5%
networking 2 2%
management 2 1%
routing 2 1%
unclassified 2 2%
cpu2 10%
ovpn 3 1%
ethernet 3 0%
firewall 3 2.5%
networking 3 1%
management 3 86.5%
routing 3 0.5%
Connection Tracker shows no 8291 port connections.
Any other options?
Ok, I think this it the RoS 7.6 bug. I’ve rebooted the router and the problem gone.