I have multiple aggregated links that I need to monitor in the Dude. Each link is 1GB individually (2GB total in aggregate). SNMP is setup and working correctly. However, when I select the appropriate Bridge Aggregation group under SNMP, there is no traffice data, just zero’s.
I appreciate any and all assistance in resolving this. Thanks.
Jerry Blades
Hi jerryeblades,
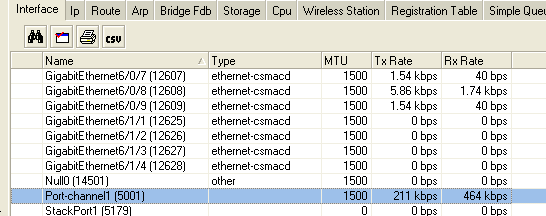
We are monitoring aggregated links on Cisco Catalyst switches via The Dude. The ports are configured as etherchannel or LACP depending on the device on the other end of the link, and then we monitor the allocated channel number in The Dude.
Here is an example of the Cisco port configs:
interface GigabitEthernet0/43
 description --- Channel, Agg Link to HOB-WLC1 ---
 switchport
 switchport trunk encapsulation dot1q
 switchport trunk native vlan 10
 switchport mode trunk
 channel-group 20 mode on
 speed auto
 duplex auto
 no shutdown
!
interface GigabitEthernet0/44
 description --- Channel, Agg Link to HOB-WLC1 ---
 switchport
 switchport trunk encapsulation dot1q
 switchport trunk native vlan 10
 switchport mode trunk
 channel-group 20 mode on
 speed auto
 duplex auto
 no shutdown
!
--- trimmed ---
!
interface Port-Channel20
 description --- Agg Link to HOB-WLC1 ---
 switchport trunk encapsulation dot1q
 switchport trunk native vlan 10
 switchport mode trunk
!
Then in The Dude, the interface we monitor is called “Port-channel20”.
Of course, different brand switches have different configs and interfaces - if you can elaborate on what equipment you are using, we can be more helpful 
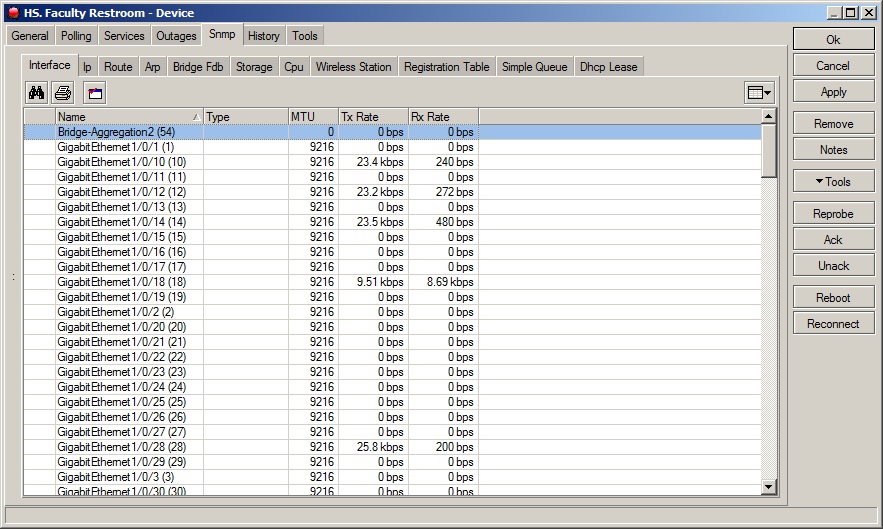
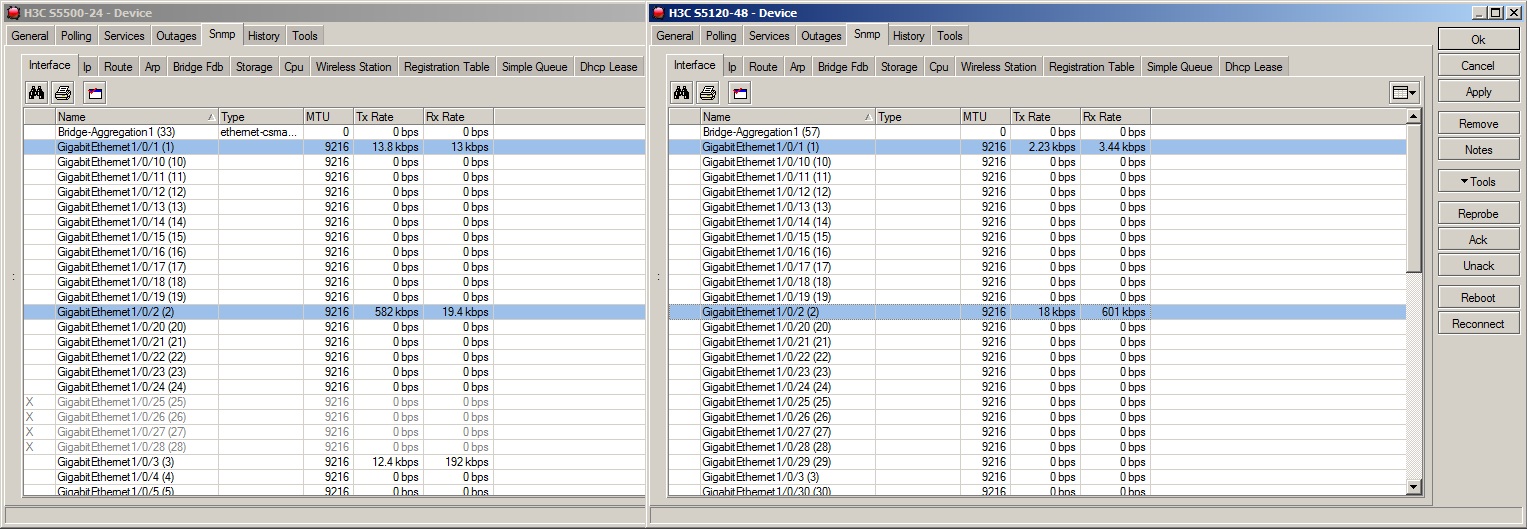
We are using H3C S5120 and S5500 series switches. I have setup the Bridge Aggregation group successfully. See attached pic.
http://www.h3c.com/portal/Technical_Support___Documents/Technical_Documents/Switches/H3C_S5120_Series_Switches/Command/Command/H3C_S5120-SI_CR-Release_1101-6W105/201108/723555_1285_0.htm Is a link to the SNMP configuration guide for this line of switches that used to setup SNMP.
Thanks so much for the assitance.
I learnt a bit about the H3C stuff just yesterday… I had no idea how impressive the devices were! I’d love to have a play with some of them, but not sure I will have the chance any time soon. Unfortunately this means I’m not familiar enough with the device to be of much specific technical help, but I can hopefully guide you a bit with some basic troubleshooting.
You are getting some SNMP data, so your community strings etc are obviously ok. Logically, one of two things are happening:
- The link aggregation is not set up or working correctly, therefore the aggregated port actually has no data and the information shown is correct; or
- The link aggregation is working as you want, but is not reporting aggregated speed.
Can you try view speed stats on the aggregated link without using SNMP, eg via telnet/ssh/console or web-management? Also, do the individual ports that form the aggregated link report any speeds themselves?
Yes, I am very happy with the H3C line so far. S5500 can run OSPF, which is very useful for us.
I am polling SNMP data from each switch successfully. I dont see an option to specifically allow SNMP data at the interface level. Do I need to configure the switch to allow more MIB information to be polled?
This is from top switch…
[JerryTest-top-S5500]display brief interface Bridge-Aggregation 1
The brief information of interface(s) under bridge mode:
Interface Link Speed Duplex Link-type PVID
BAGG1 UP 2G(a) full(a) trunk 1
This is from bottom switch
[JerryTestBottom-S5120-48]display brief interface Bridge-Aggregation 1
The brief information of interface(s) under bridge mode:
Interface Link Speed Duplex Link-type PVID
BAGG1 UP 2G(a) full(a) trunk 1
I would also be open to writing a function to sum the total of the two links to get the total TX / RX for the Bridge Aggregatioin link.
Thanks again for everything.
Jerry
As you mentioned you could manually build a function/probe that adds the individual links together but it will be hard coded to that pair of interfaces. So you would want to make sure that you always channeled the same two links between devices.
To me that looks like a bug in the device since the dude shows that the counters are 0 for the aggregate link. I would double check that the counters are not being updated with SNMPwalk and then ask the vendor if they could reproduce your error. I would imagine that they would fix this.
Aussiewan and I are both monitoring ether-channels with no issues so it unfortunately points to the vendor…
Start an snmp walk at oid 1.3.6.1.2.1.2.2.1 that will give you all the interface stuff then search for your port channel by name then find the counter. It will most likely be 0.
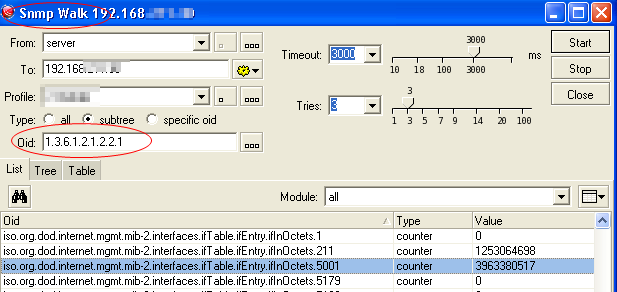
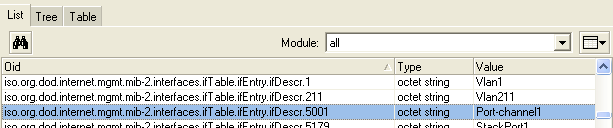
It was zero. I walked all OID’s and all references to the Bridge Aggregation interface were zero.
I will submit a Support ticket to HP. If this is resolved, I will update this post with the resolution. Thanks again for GOOD suggestions. All is not lost, I learned some things on this issue, and that is moving in a positive direction in my book.