Hello,
I am using the Dude in order to sample Dozens of APC PDUswith snmp
I have successfully monitoring the Amp parameter using specific Oid,and it great
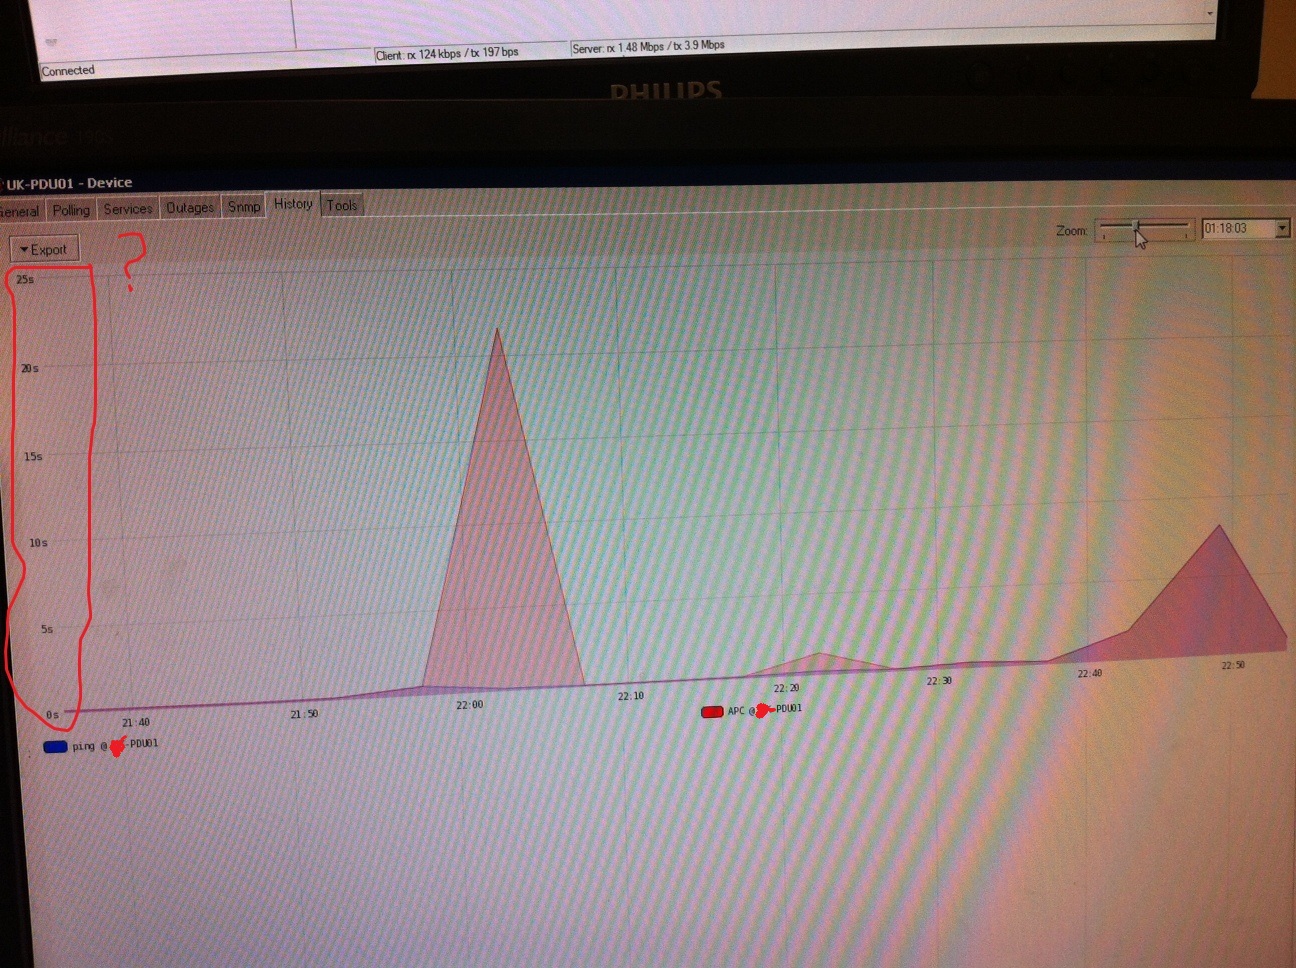
The problem is that I cannot check the history, because the history graph showing seconds on the ‘Y axis’ instead the Amper values
I don’t have a clue what whats wrong…
just to be cleared, the Amp that is see are the right one so I have only the graph issue…
The graph is showing the response time for the snmp query by the look of it. In your probe definition you need to specify what it is that you want to graph for that probe. Put the OID of the counter that you want to graph in the “value” of the probe. Check the probes thread http://forum.mikrotik.com/t/probe-thread/10321/1 there is heaps of good information there.