The next what I found is this:

Look at the chart, where the ping and ping2 graphs are. Why is the difference?
The ping2 shows the correct values!
The next what I found is this:
Look at the chart, where the ping and ping2 graphs are. Why is the difference?
The ping2 shows the correct values!
And after some time the second probe is showing wrong values.

The first comments are on a windows based dude server. Yesterday I installed ROS on a PC with dude package, migrated the config, and noticed the same error.
Has anyone any idea, or had anyone problem like this before?
I am so sad ![]()
Yesterday I installed the rc2 on an x86 with ros 3.13. A began to redraw our maps, because we are making a new look to the maps thanks for the new features.This ping graph error went away, everything was fine. At end of work I shut down our new dude server (it is in development status).
Today I came to work, turn in the new server, and the ping graphs has the same errors as in the pictures.
I have no more ideas, where to find the problem.
Please help us, this is the last bug which sets us back in switching to the new version!!
EDIT: Some interesting thing: I gave 2 new devices to the map, on their graphs the values are OK.
So this graph error occurs on the devices, which are present on the map at reboot/start time…
UP
I can’t believe this error is only on my dude server…
still wrong in rc3 ![]()
Hello again MIkrotik guys (and forum users)!
First please forgive me for my bad english!
After spendig very-very lot time with testing I’ve find the next:
I connected a device direct to my dude server, there are no switches, routers, wireless links etc. between them, and added this device to a map.
I tried Dude (RC3) on all OS (Linux, Windows, ROS), 2 platform (x86 and Routerboard) as Dude server.
All on this tests the error is still there. Who can help me to find a solution?
Guys at Mikrotik, help us!
after reading your post i can’t figure out what your problem exactly is?
is ping return to high value? or what?
Look at the picture in the first post, there are two ping services with the same settings. On the graph, the blue one shows the correct values (<1ms-10ms) the red one shows incorrect values.
After a reboot (on the dude server) the blue one is showing the wrong values too, but when I make Tools-Ping it is still <1ms.
I have seen this problem too.
In my case it was not with the ping service, but a probe that just used a oid value.
The graphs displayed in the “history” tab of the device were incorrect, but if I created a Chart with the same the values it was 100% correct.
Could you create a Chart of ping and ping2 and see if the same problem exists there too?
http://dufmil2005.hu/rumli/link/chart.jpg
As you see there is the chart and the history of ping and ping 2 on the same device.
I think, its because of diferent times, those probes are called. when you ping something, it returns different values, every time, like 0.5 ms, 0.3 ms, 1.2 ms. So it is random everytime.
I dont think its a bug.
Why do you need 2 probes that do the same thing?
Okay than again:
My problem is: when I ping something it replies with 0,1-10ms, but on the graph there are values between 0-150 ms, with ca. 40ms average. THESE ARE NOT THE REAL VALUES.
I might have found a possible reason for the ping graph trouble. I have some ups probes I was testing and Clicking the reprobe button generates some crazy numbers… Maybe you are pinging too often. What maybe happening is the previous counter is not cleared before the next read of the counter and they are being added together.
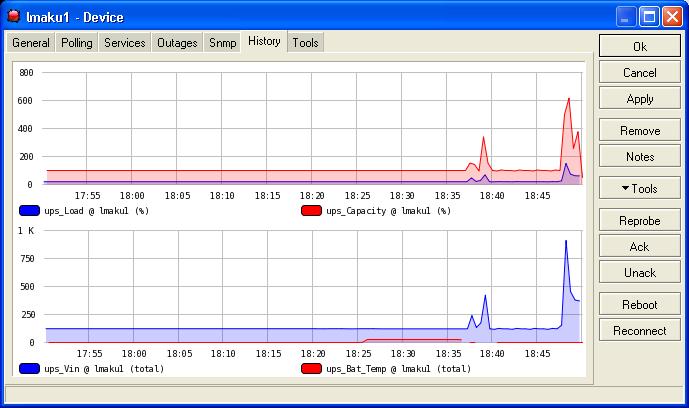
Now all these are just probes are just oid(blabla)… How could capacity ever read more than 100?
I was clicking the reprobe button often and the graphs went haywire…
How could V_in ever read more than ~120?
You can find the ups probes in the probe thread.
Maybe scale your ping back so it happens less often and the counters will be cleared out before the next ping occurs?
That also explains why a new ping graph works for a little while then gets worse.
LMK
SD!
Thanks for your answer. We use default intervals, but I’ll try what you said.
Changing the probe interval did not help…
Well it was worth a shot… So now it sounds like the issue is two problems?
Somewhat like your trouble but different, I would like to know how can reprobes create higher graph values when the OID contains a constant value. The oid for UPS capacity “1.3.6.1.4.1.318.1.1.1.2.2.1” = 100 no mater how many times I Snmpwalk it but if I reprobe the UPS capacity the value skyrockets on the graph.
I took a look around at some of my devices all in the same computer room conected at a minimum of 1gbps and some of them show high ping values >120 ms while others are never above 1ms… So i’d say I have your issue also.
Hi all,
About reprobes resulting in spikes..
Actually, that’s quite logic.. ![]()
In most cases The Dude uses a certain interval for the probe, let’s say every 15 seconds.
When you reprobe the device you’re very likely to do so somewhere in between two polls.., the returned value seems to be stored somewhere and when the regular poll is there it’s added to that one.
E.g.:
I’ve lots of AKCP SensorProbes here, monitoring temperature and relative humidity.
When I already have a returned value of 65% RH, then reprobe between 2 polls and the device returns 66% RH, the next poll is again 65%, then I’m very likely to run into a spike of 131% RH (or even 196% RH in worst case scenario’s), which is obviously not likely to be for real or my device would be swimming..
Hope this helps (or better, it doesn’t really help.. ![]() )
)
Regards,
Minollie
Hi again Minollie,
I agree but why not just clear the current value of the probe just before trying to read it? or replace the current value of the probe with the new value of the probe instead of sum them together? It is probably more complex than I am thinking…
Thanks,
Joe
Okay, but: today I set my global polling intervall to 1 minute !!! and the ping fails, I did not press the Reprobe button or anything. Just set the Intervall, waited 2-3 hours and looked the graphs. And still error.
We have a device which pings 100-200 ms (by the graph), in the same dude, where these wrong graphs are, i make a right click, tool, ping: there it pings >1ms, on the graph there is still the 100-200ms.
Here are some very interesting examples, does someone think that, these are phisicaly possible on a very well working network???


