I am trying to use the API to get the speed of the ethernet interfaces. I am running the monitor command once for each interface because I don’t think there’s an easier way (easier being less requests). When I try to use find to get ether1, I get this:
‘Error “no such item” executing command b'/interface/ethernet/monitor =numbers=[find where name=“ether1”] .tag=3'’, b’no such item’
If I just put in 0 instead of using the find function then that works, but I’d rather ask for the interface I care about. Otherwise I need to run interface/print first to get the interface numbers.
Also, is there a better way to get the interface speed? This would be 48 separate requests for a 48 port switch.
this
/interface/ethernet/monitor =numbers=[find where name=“ether1”] .tag=3
is equivalent to
/interface/ethernet/monitor =numbers=[/interface/ethernet/monitor/find where name=“ether1”] .tag=3
and /interface/ethernet/monitor/find etc. do not exist
“probably” must be
/interface/ethernet/monitor =numbers=[/interface/ethernet find where name=“ether1”] .tag=3
Thank you for this. It looks like I can run ifDescr to find out which interface I’m looking at and then I can make sense of ifSpeed. Do you know if I should check to make sure that ifDescr.3 is always ether1, for example, or should that always stay the same after I figure out what it is for that router?
I mean the interface speed and not the rate. I do need the rate also but I am getting that in the way you mentioned already. 1 interface at a time unfortunately. If I was really cool I’d probably print the traffic that’s gone through the interface, get it again a couple seconds later, and then do math or something like that. I’d have to be sure the time was correct though.
/interface/ethernet/print does not give speed for me. It looks like it did back in ROS6 but not in ROS7.
On a slightly related note, I’m assuming you’re using proplist because it helps performance in some way? I’ve just been getting all the results back and then getting the information I need.
With API… I think the idea is each interface monitor using a different =tag=, and the stream of tags is processed into your own data struct from the !re based on tags provided back from router.
Why SNMP seems like a better way if at all possible…
The OID does not change unless the the interface is removed and re-added. So for ether1…X, they won’t change. At least on the same router… Between routers, however, it would be possible the OID for ether1 is not same as another, or especially SFP ports – since the OID depends on the order added. But once added, the OID is stable for a router.
Ah, I could see “find” not existing for the API making find not work. Thank you. I originally wrote an application that used SSH for everything so I’m in the process of rewriting it using the API.
I’ll just use snmp for this. I’ll run ifDescr.3 to map interfaces to the correct numbers once per router and then just get the speed after that. It’s unfortunate that it looks like /interface/ethernet/print use to work for this.
I plan on using the API and SNMP for everything I need from the routers depending on what responds faster and what takes less resources.
Well yes, that is unfortunately always an issue with SNMP…
“in practice” the ifDescr table will remain the same in RouterOS until you re-install (even when you load the same config afterwards it can be different). Usually for fixed interfaces like the ports of a switch, the numbering will remain the same. But when you have added more dynamic interfaces like a PPPoE or some tunnel, it will change.
In some other devices the table can change even after a reboot (with same version and config), but in RouterOS I have never seen that happen.
Depending on your programming environment and -experience, you can decide if you want to query ifDescr every time you want to query ifSpeed (and then build some mapping table from ifDescr to number which you use when interpreting ifSpeed), or if you trust that for the 48 switchports it will remain the same.
I’m working on a project that configures home routers (at least at first) and makes it so the support staff can change wireless settings, port forwarding, dhcp reservations, etc from a dashboard. The idea is that no one has to really know all the details of Mikrotik configuration because the program takes care of that for them. It will also give information and alert to possible problems (why I’m getting interface speed and rate and such).
I say all of that to say I’ll be querying thousands of devices at a time and testing out different polling intervals/api vs snmp, etc. If I can avoid asking for ifDescr as much then that should help with the scalability (just a tiny bit but whatever). I’ll plan on just doing it for each router once it’s on-boarded and then test from there.
I should be able to get a good amount a data to let you know what performs better and responds faster. For interface speed specifically though, it looks like the only way to do it with 1 command is SNMP so I’ll be using that.
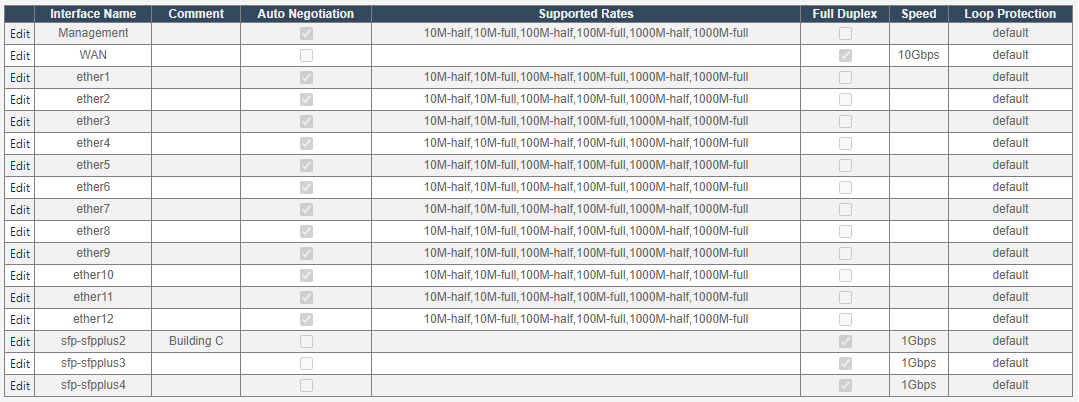
The screenshot I posted of my implementation using that data is a 7.10.2 router, and it does show speed, but only when the interface has auto-negotiation disabled. /interface/ethernet/monitor does give the current rate.
As for using the proplist, It definitely makes a difference on the router CPU vs when you are returning really large results, but also to a lessor degree on the bandwidth used and the time the API call takes to complete. For a small result set there’s not much benefit, but I’m in the habit of doing it almost all the time now and I find it’s also just easier to deal with when you’re only retrieving the data you need, particularly if you’ve got to troubleshoot something and debug the results manually.