Could you comment a little more on this case? I am interested in sending the metrics of my router directly to grafana, but I always find that I have to install an intermediary software. I understand that you have done it without this problem.
Yeah I think how you set up Grafana would be of interest to the forum. Mikrotik has dropped Dude for V7 & there aren’t a lot of “free” data/graphing tools. I know Grafana has it’s own timeseries database it could use, however in my look at a few months back that looked rather complex to setup.
In terms of what to graph, the “accounting data” is likely generically useful, e.g. https://wiki.mikrotik.com/wiki/Manual:IP/Accounting - n.b. that this does not work on V7. @Jonte solve the missing data collection via enabling /ip/kid-control – why I suggest taking a look at his work since there are some subtleties in how to collect the right data, and what data you have drives what’s possible to graph.
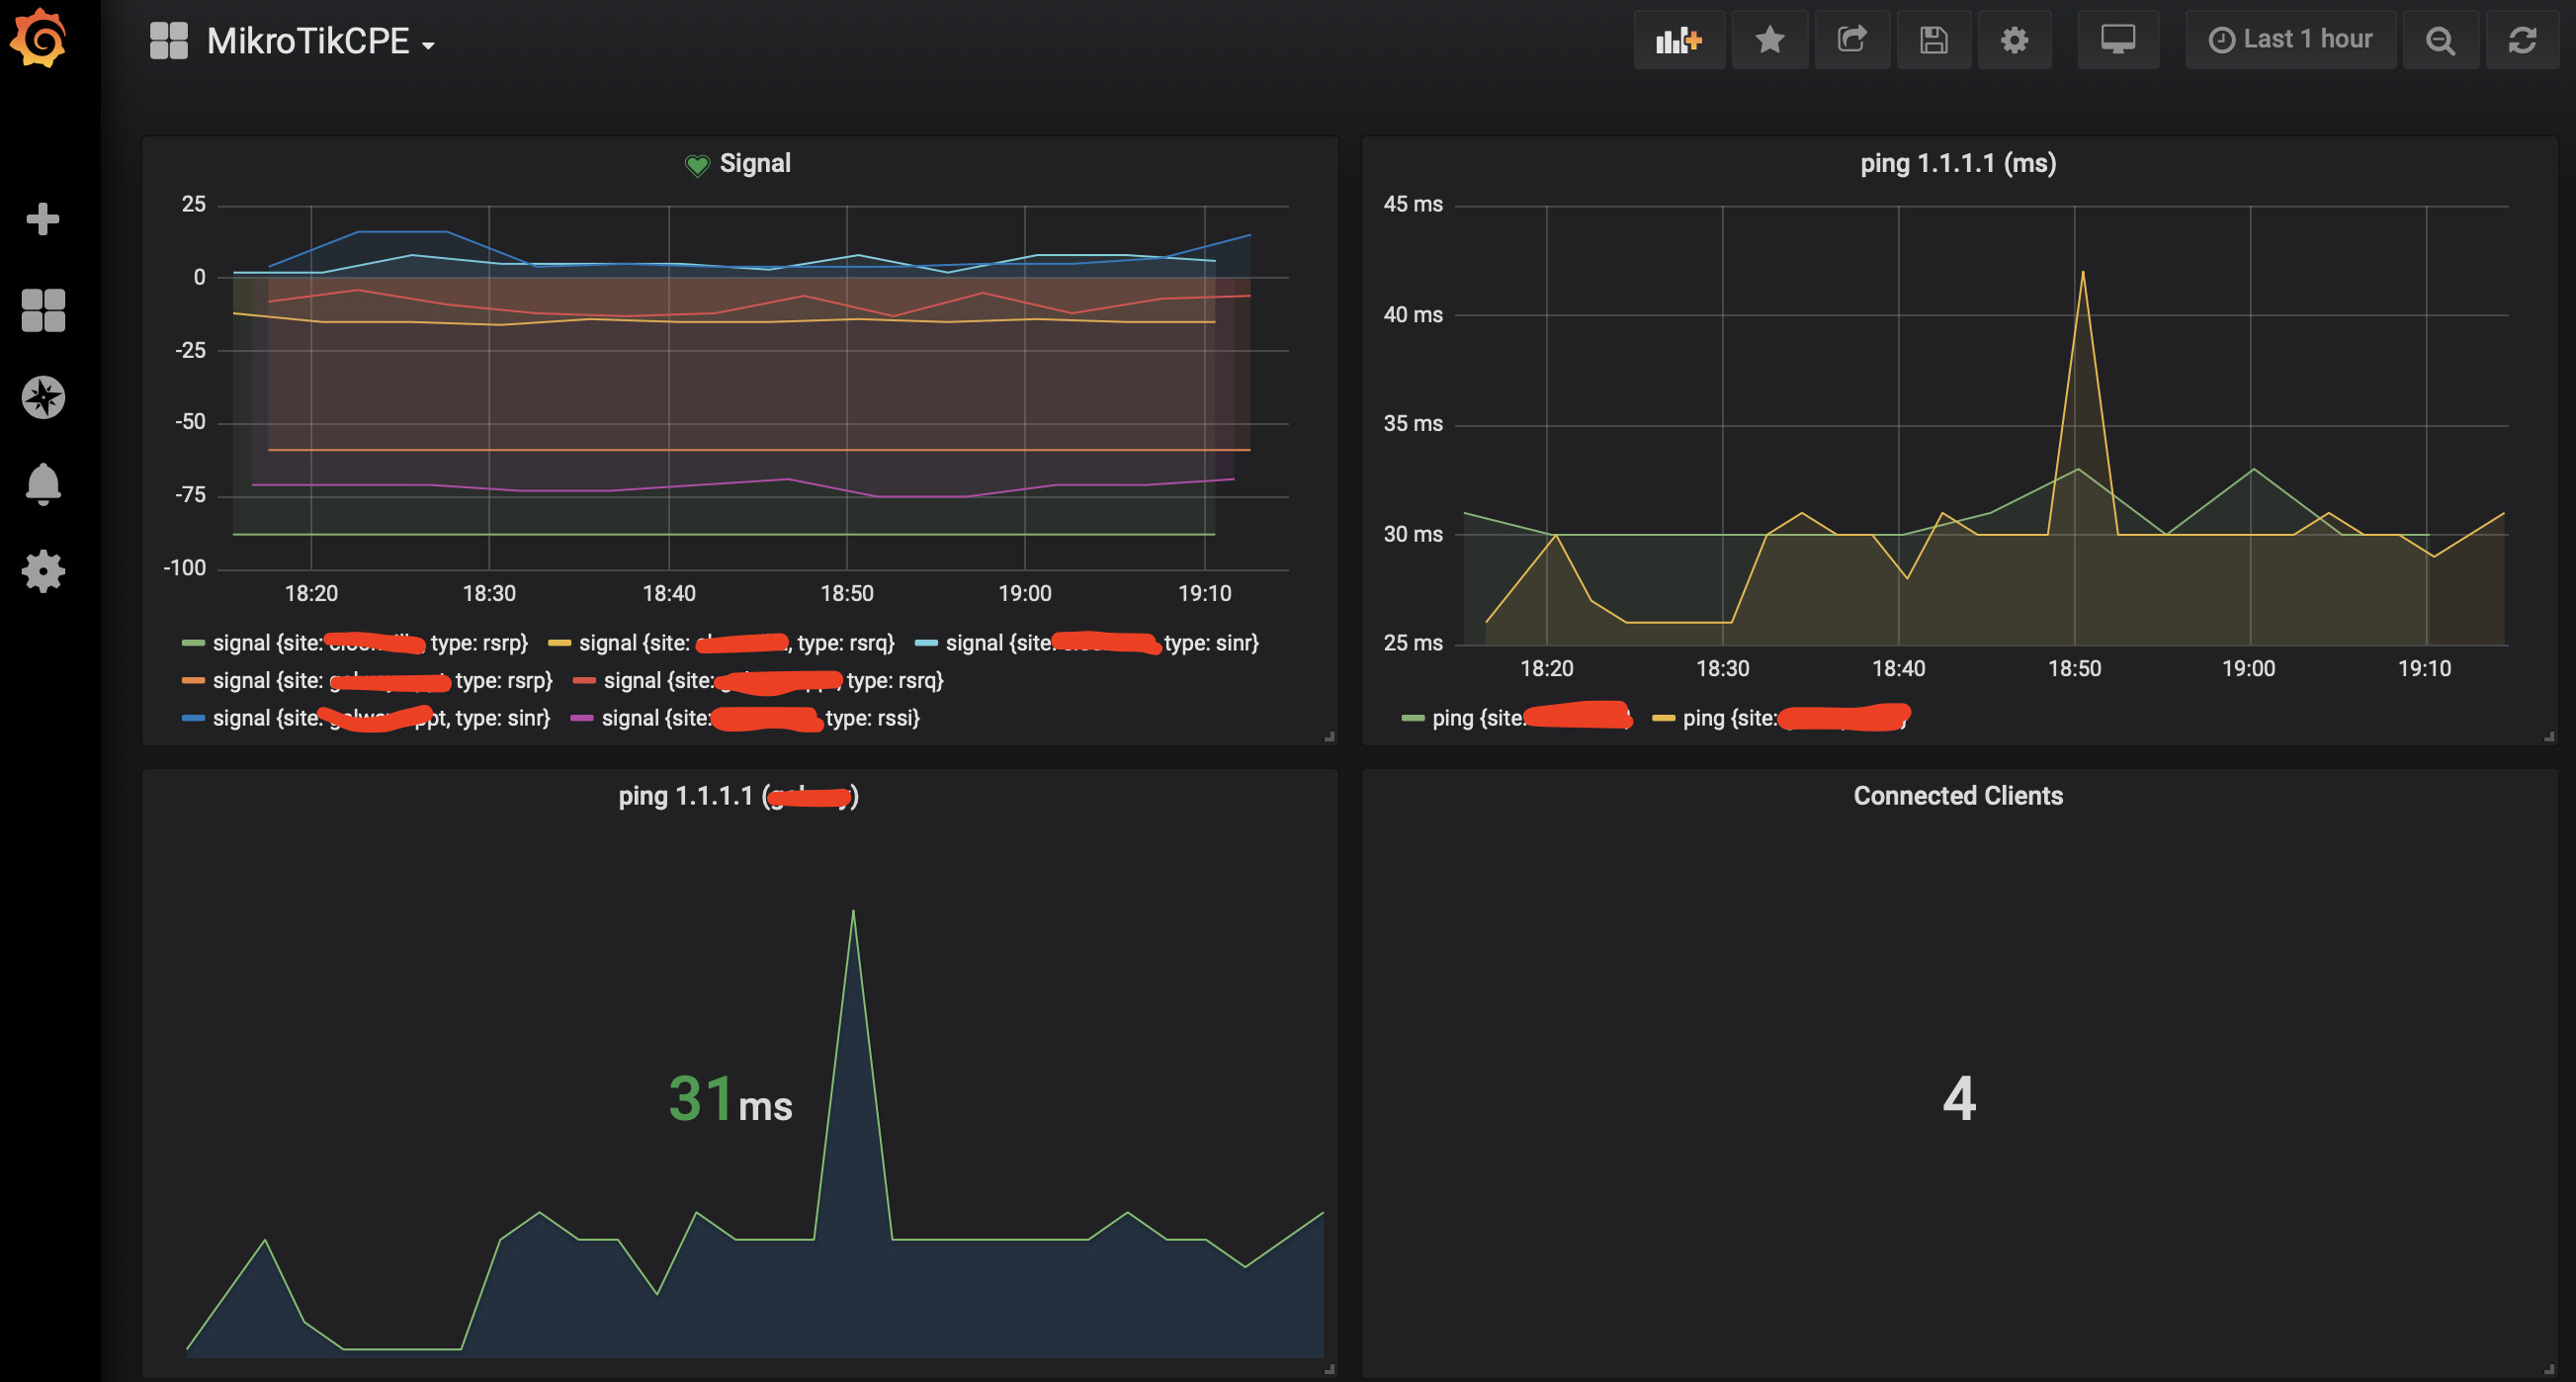
My only problem with @Jonte’s work is it requires the rather expensive Splunk (which is free, but no alerting in free version). So we’ve been testing this via the IoT package with to AWS Timestream, which then include a Grafana interface. So know Grafana works. But the AWS way isn’t cheap, nor “free”, so we limit our data collection to manage the costs. Why I’m also interested in how you setup Grafana locally