Interface/CPU graphs not showing correct data

I’m using hEX S with 7.20.6 (stable), but I'm experiencing some performance issues.

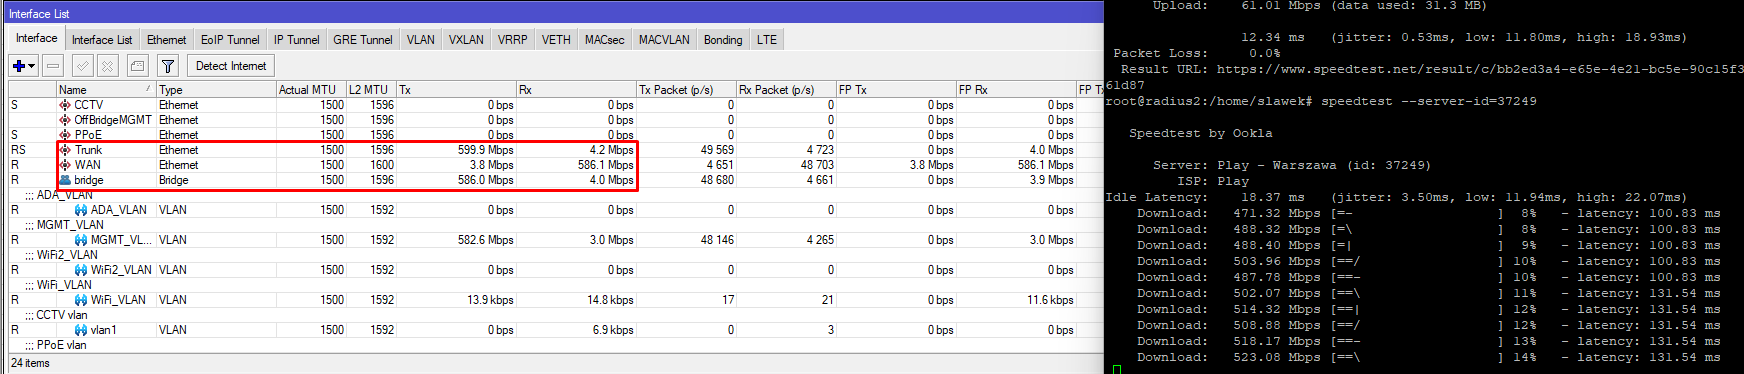
The router is connected to a DOCSIS modem, which should give me 1 Gb/60 Mbit throughput, but it does not, and I am working remotely, so I have limited ability to perform tests. I have a wired laptop connected to the router. I have Ubuntu Linux on it and I'm running continuous speed tests to grab results, which are:
Download: 493.40 Mbps / Upload: 61.48 Mbps

I'm not even close to achieving a 1 GB download speed, and I suspect this is because I'm not using FastTrack. I will open a separate topic to discuss the FastTrack problem.

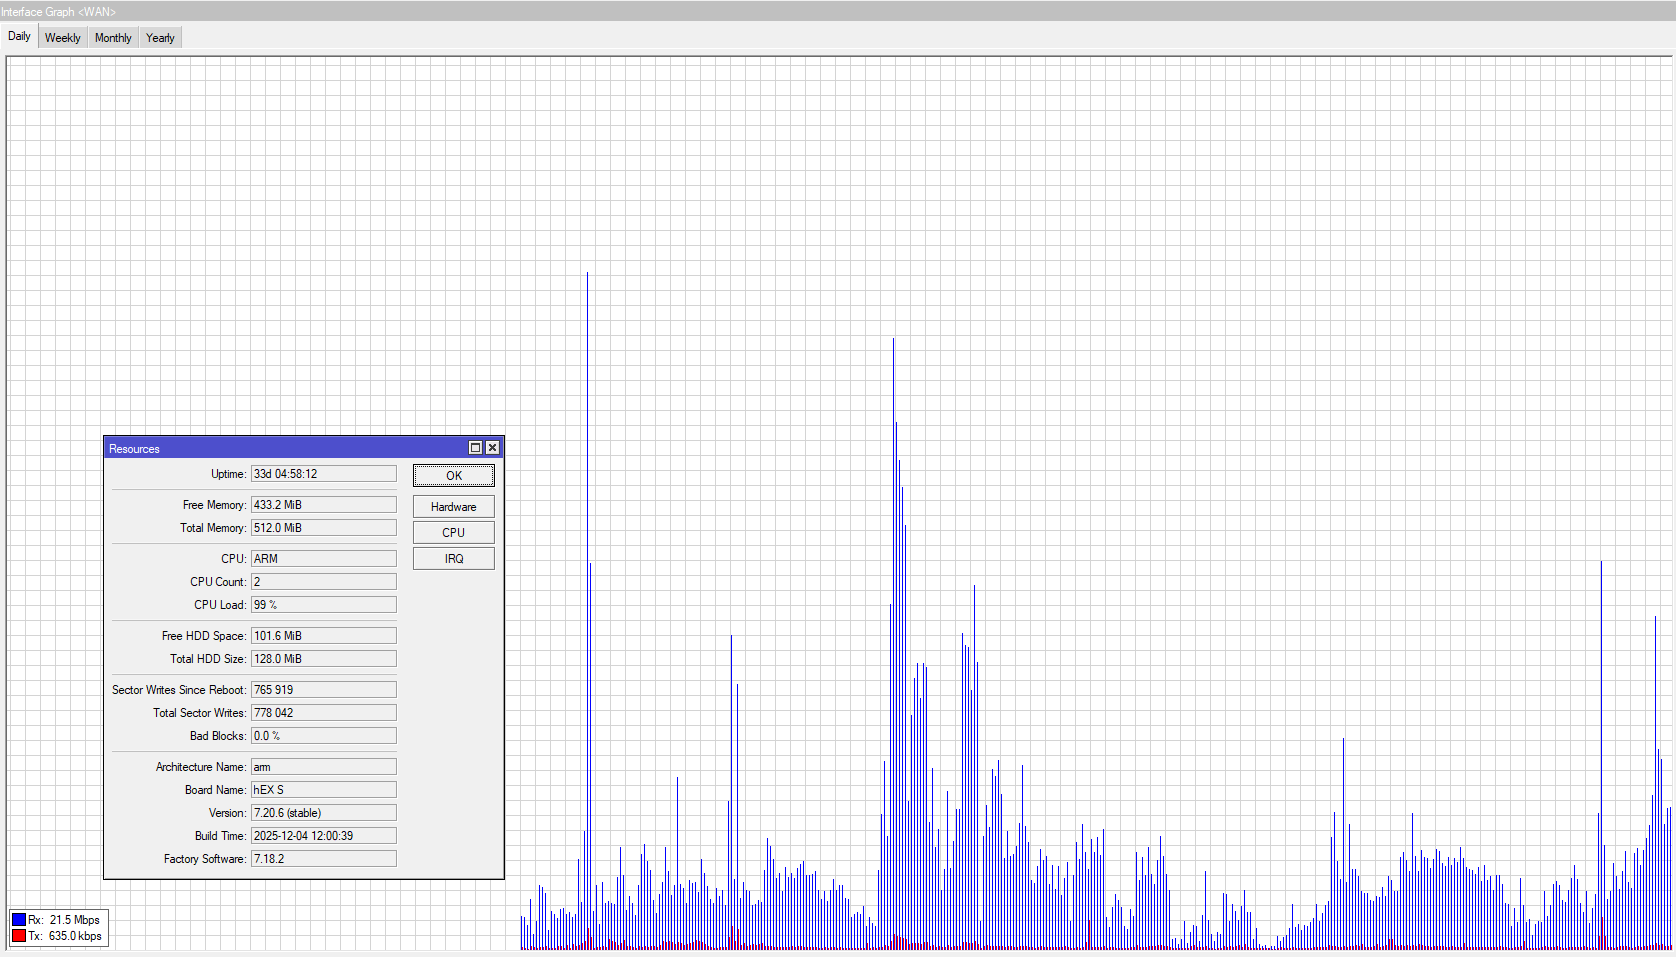
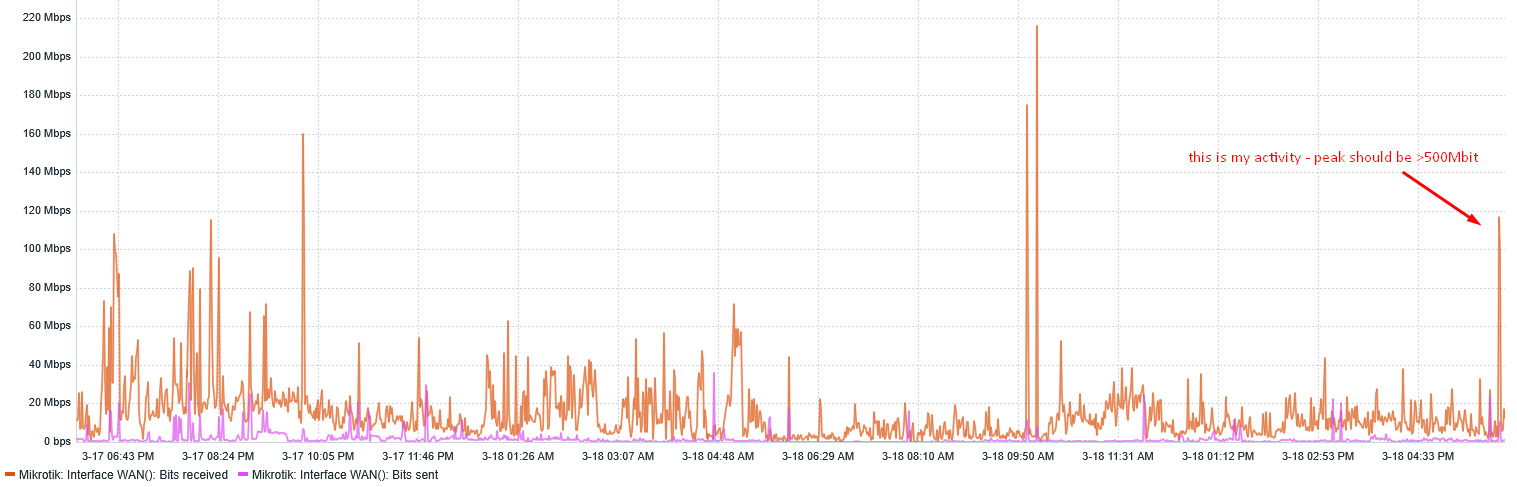
I would like to inquire about the graphs from Tools > Graphing > Interface Graphs > WAN. Why are the values not close to 490 Mbit/s download? The highest peak on the graph is 100 Mbit/s. Where are the 500 Mbit/s peaks?

The CPU usage on the system is usually around 75%, but during tests it can reach 100%.

Is this normal? How can the average utilisation of the WAN interface be measured more precisely?

New Terminal

/export file=configname

Edit the contents of this file to remove sensitive data, post the contents here.

Think on upgrade for latest stable version.

Check for current version number at System→RouterBOARD.

What I've learned during my life is one rule of thumb: don't touch version 0.0 at the end. Never!

The 7.22 change log is pretty long and 7.20.8 doesn't show anything related to my problems.

Any other ideas?

If the Mikrotik graphs are unreliable, I’m considering a small SNMP monitoring instance, as I have a Linux computer with some free resources. What do you think?

Regards
Slawek

Regarding CPU load: when using winbox for monitoring, that by itself causes quite a lot of load (when running CPU profiler it shows a lot of CPU cycles used by "management"), so this method of observing CPU load is not showing load on device while there's no management connection active. You can verify that by connecting to router via SSH ...

And built-in graphing shows averages (e.g. 1 minute average), not peaks. Only real-time traffic display will show peaks. And in my experience, shown values are more or less correct (after considering that they are averages).

As to speeds: according to official test results and applying a few grains of wisdom, hEX S (the original one) can route at speeds around 300Mbps give or take. Specially so if fasttrack is disabled (for any reason).

Yes, without fasttrack, don't expect routing with FW/NAT to achieve more than about 500Mbps with the new hEX S (2025) and not more than 300Mbps with the old hEX S when running RouterOS 7.x.

You need fasttrack for 1Gbps routing with firewall on those devices (old hEX S slighly lower than 1Gbps).

OK, I’m using the new Hex (2025), let me configure PRTG so save some Hex resources for other then monitoring purposes (routing/fw)
I will let you know what I can see over SNMP from the same box soon.

Hi guys

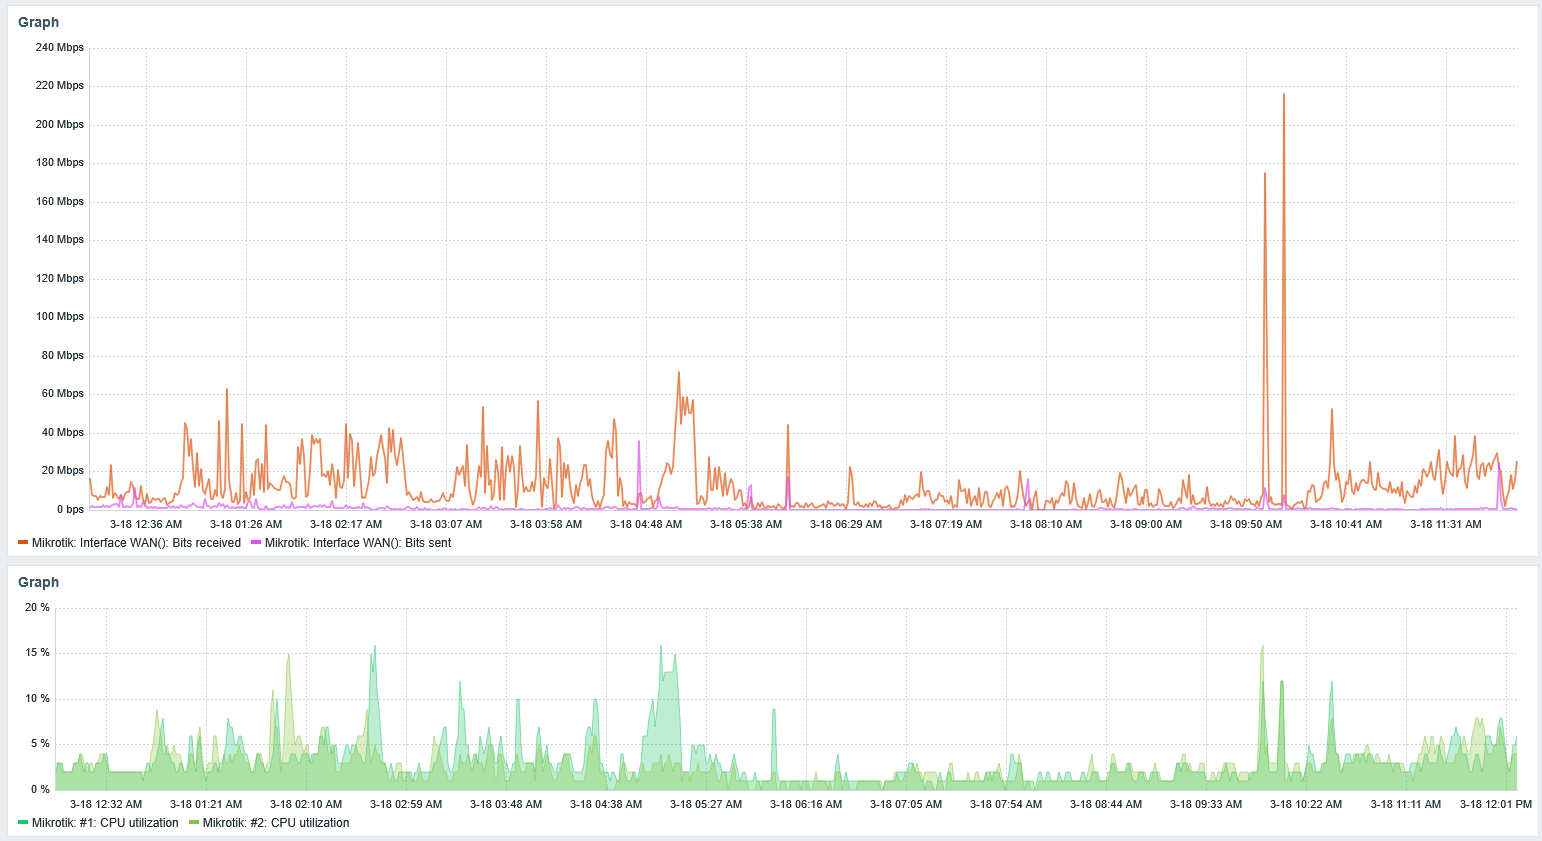
As promised, here are some freshly taken screenshots from the router and Zabbix to show the difference.

The graphs still do not show the situation when I ran a speed test (with traffic hitting 500 Mbit for ~10 seconds, even when I repeated the test a few times). The two peaks on the right of the graphs below represent the speed test being run a few times.

I’m still looking to get more precise graphs – any ideas are most welcome!

We're still waiting to see the actual config of your device. As already written, device should be able to route at around 500Mbps or there around ... and it seems you're getting that. Sometimes the performance ceiling is not due to missing raw CPU power (i.e. PCU load hits 100%), could be also latency of interrupt processing, latency of RAM access (CPU needs to read firewall rules from RAM as it evaluates them), etc.

But if you show the config, somebody might catch something non-optimum there.

Here you can find my config

RouterOS 7.20.6

model = E60iUGS

/interface bridge
add admin-mac=D4:01:C3:64:94:BB auto-mac=no name=bridge vlan-filtering=yes
/interface ethernet
set [ find default-name=ether3 ] name=CCTV
set [ find default-name=ether2 ] name=OffBridgeMGMT
set [ find default-name=ether4 ] name=PPoE
set [ find default-name=ether5 ] name=Trunk
set [ find default-name=ether1 ] name=WAN
/interface vlan
add comment=ADA_VLAN interface=bridge name=ADA_VLAN vlan-id=120
add comment=MGMT_VLAN interface=bridge name=MGMT_VLAN vlan-id=99
add comment=WiFi2_VLAN interface=bridge name=WiFi2_VLAN vlan-id=110
add comment=WiFi_VLAN interface=bridge name=WiFi_VLAN vlan-id=100
add comment="CCTV vlan" interface=bridge name=vlan1 vlan-id=1
add comment="PPoE vlan" interface=bridge name=vlan88 vlan-id=88
/interface list
add name=MGMT
add include=none name=VLAN
/ip ipsec policy group
add name=vpn
/ip ipsec profile
add dh-group=modp1024 enc-algorithm=aes-256 hash-algorithm=sha256 name=vpn
/ip ipsec peer
add exchange-mode=ike2 name=vpn passive=yes profile=vpn
/ip ipsec proposal
add enc-algorithms=aes-256-cbc name=vpn pfs-group=none
/ip pool
add name=dhcp_CCTV ranges=192.168.0.10-192.168.0.254
add name=dhcp_PPoE ranges=192.168.88.10-192.168.88.254
add name=vpn ranges=10.22.22.10-10.22.22.20
add name=ADA_POOL ranges=192.168.120.100-192.168.120.254
add name=WiFi2_POOL ranges=192.168.110.100-192.168.110.254
add name=WiFi_POOL ranges=192.168.100.100-192.168.100.254
add name=MGMT_POOL ranges=192.168.99.100-192.168.99.254
/ip dhcp-server
add address-pool=dhcp_CCTV disabled=yes interface=vlan1 lease-time=1d name=
dhcp_CCTV
add address-pool=dhcp_PPoE disabled=yes interface=vlan88 lease-time=1d name=
dhcp_PPoE
add address-pool=WiFi_POOL interface=WiFi_VLAN lease-time=6h name=WiFi_DHCP
add address-pool=ADA_POOL interface=ADA_VLAN lease-time=6h name=ADA_DHCP
add address-pool=WiFi2_POOL interface=WiFi2_VLAN lease-time=6h name=
WiFi2_DHCP
add address-pool=MGMT_POOL interface=MGMT_VLAN lease-time=6h name=MGMT_DHCP
/ip ipsec mode-config
add address-pool=vpn name=vpn
/ppp profile
set *0 use-encryption=no
add change-tcp-mss=yes local-address=192.168.88.1 name=5Mbps rate-limit=1M/5M 
remote-address=dhcp_PPoE
add change-tcp-mss=yes local-address=192.168.88.1 name=30Mbps rate-limit=
5.1M/35M remote-address=dhcp_PPoE
add change-tcp-mss=yes local-address=192.168.88.1 name=15Mbps rate-limit=
2M/15M remote-address=dhcp_PPoE
add change-tcp-mss=yes local-address=192.168.88.1 name=10Mbps rate-limit=
2M/10M remote-address=dhcp_PPoE
add change-tcp-mss=yes local-address=192.168.88.1 name=20Mbps rate-limit=
5M/20M remote-address=dhcp_PPoE
add change-tcp-mss=yes local-address=192.168.88.1 name=Unlimited 
remote-address=dhcp_PPoE session-timeout=0s
add change-tcp-mss=yes local-address=192.168.88.1 name=60Mbps rate-limit=
10M/60M remote-address=dhcp_PPoE
set *FFFFFFFE use-encryption=no
/interface bridge port
add bridge=bridge comment=CCTV interface=CCTV
add bridge=bridge comment=PPoE interface=PPoE pvid=88
add bridge=bridge comment=Trunk ingress-filtering=no interface=Trunk
/ip neighbor discovery-settings
set discover-interface-list=MGMT
/ip settings
set rp-filter=strict
/interface bridge vlan
add bridge=bridge comment="CCTV VLAN" tagged=Trunk,bridge untagged=CCTV 
vlan-ids=1
add bridge=bridge comment="PPoE VLAN" tagged=Trunk,bridge untagged=PPoE 
vlan-ids=88
add bridge=bridge comment=WiFi_VLAN tagged=bridge,Trunk vlan-ids=100
add bridge=bridge comment=WiFi2_VLAN tagged=Trunk,bridge vlan-ids=110
add bridge=bridge comment=ADA_VLAN tagged=Trunk,bridge vlan-ids=120
add bridge=bridge comment=MGMT tagged=Trunk,bridge vlan-ids=99
/interface list member
add interface=vlan1 list=MGMT
add interface=OffBridgeMGMT list=MGMT
add interface=MGMT_VLAN list=MGMT
add interface=ADA_VLAN list=MGMT
add interface=ADA_VLAN list=VLAN
add interface=MGMT_VLAN list=VLAN
add interface=WiFi2_VLAN list=VLAN
add interface=WiFi_VLAN list=VLAN
/interface pppoe-server server
add default-profile=30Mbps disabled=no interface=vlan88 max-mru=1480 max-mtu=
1480 service-name=PPoE_server
/ip address
add address=192.168.77.1/24 interface=OffBridgeMGMT network=192.168.77.0
add address=192.168.0.1/24 comment=CCTV interface=vlan1 network=192.168.0.0
add address=192.168.88.1/24 comment=PPoE interface=vlan88 network=
192.168.88.0
add address=192.168.188.222 comment="WAN Gateway" interface=WAN network=
192.168.188.1
add address=x.x.x.x/30 comment="WAN Gateway" interface=WAN network=
x.x.x.x
add address=192.168.110.1/24 interface=WiFi2_VLAN network=192.168.110.0
add address=192.168.120.1/24 interface=ADA_VLAN network=192.168.120.0
add address=192.168.100.1/24 interface=WiFi_VLAN network=192.168.100.0
add address=192.168.99.1/24 interface=MGMT_VLAN network=192.168.99.0
/ip dhcp-server network
add address=192.168.0.0/24 dns-server=8.8.8.8,8.8.4.4 gateway=192.168.0.1
add address=192.168.88.0/24 dns-server=8.8.8.8,8.8.4.4 gateway=192.168.88.1
add address=192.168.99.0/24 dns-server=8.8.8.8 gateway=192.168.99.1
add address=192.168.100.0/24 dns-server=8.8.8.8 gateway=192.168.100.1
add address=192.168.110.0/24 dns-server=8.8.8.8 gateway=192.168.110.1
add address=192.168.120.0/24 dns-server=8.8.8.8 gateway=192.168.120.1
/ip dns
set allow-remote-requests=yes servers=8.8.8.8,8.8.4.4
/ip firewall address-list
add address=xxxxxxx.ddns.net list=slv_ddns
/ip firewall filter
add action=drop chain=input comment="Drop Invalid connections" 
connection-state=invalid
add action=accept chain=input comment="Allow Established connections" 
connection-state=established,related
add action=accept chain=input comment="Allow VLAN to router services" 
in-interface-list=VLAN
add action=accept chain=input comment="Allow Base_Vlan Full Access" 
in-interface=MGMT_VLAN
add action=accept chain=input dst-port=8291 protocol=tcp src-address=
192.168.0.0/24
add action=accept chain=input dst-port=8291 in-interface=WAN protocol=tcp 
src-address-list=slv_ddns
add action=drop chain=input dst-port=8291 protocol=tcp
add action=accept chain=input comment=
"Allow access to router from known network" src-address=192.168.0.0/24
add action=accept chain=input comment="Allow IPSEC/IKE2 connections" 
dst-port=500,4500 log=yes protocol=udp
add action=drop chain=input comment="Drop anything else"
add action=accept chain=forward connection-state=new dst-address=
192.168.0.251 dst-port=443 protocol=tcp src-address-list=slv_ddns
add action=accept chain=forward comment=
"Allow already established connections" connection-state=
established,related
add action=accept chain=forward comment="VLAN Internet Access only" 
connection-state=new in-interface-list=VLAN out-interface=WAN
add action=accept chain=forward connection-nat-state=dstnat connection-state=
established,related in-interface=WAN
add action=drop chain=forward comment="Drop to bogon list" dst-address-list=
bogons
add action=drop chain=forward disabled=yes in-interface=WAN
add action=accept chain=forward out-interface=WAN
add action=accept chain=forward comment="Accept in ipsec policy" 
ipsec-policy=in,ipsec
add action=accept chain=forward comment="Accept out ipsec policy" 
ipsec-policy=out,ipsec
add action=drop chain=forward comment="Drop invalid connections" 
connection-state=invalid protocol=tcp
add action=drop chain=forward
/ip firewall nat
add action=masquerade chain=srcnat out-interface=WAN
add action=dst-nat chain=dstnat dst-port=8038 in-interface=WAN protocol=tcp 
to-addresses=192.168.0.251 to-ports=443
/ip ipsec identity
add auth-method=digital-signature certificate="Home server" comment=
"Home client1" generate-policy=port-strict match-by=certificate 
mode-config=vpn peer=vpn policy-template-group=vpn remote-certificate=
"Home client1"
/ip ipsec policy
add dst-address=0.0.0.0/0 group=vpn proposal=vpn src-address=0.0.0.0/0 
template=yes
/ip route
add distance=1 gateway=x.x.x.x
/ip service
set ftp disabled=yes
set ssh disabled=yes
set telnet disabled=yes
set www disabled=yes
set api disabled=yes
/ppp secret
add name=m05 profile=60Mbps service=pppoe
[....]

/system clock
set time-zone-name=Europe/Warsaw
/system identity
set name=Router
/system logging
add disabled=yes topics=pppoe
add disabled=yes topics=ipsec,!packet
/system note
set note=">>>> Authorized administrator only. Access to this device is monitor
ed <<<<"
/system ntp client
set enabled=yes
/system ntp client servers
add address=3.pl.pool.ntp.org
add address=0.pl.pool.ntp.org
/system package update
set channel=long-term
/tool bandwidth-server
set enabled=no
/tool graphing interface
add allow-address=192.168.0.0/24 interface=WAN
/tool graphing resource
add allow-address=192.168.0.0/24
/tool mac-server
set allowed-interface-list=MGMT
/tool mac-server mac-winbox
set allowed-interface-list=MGMT
/tool traffic-monitor
add interface=WAN name=tmon1

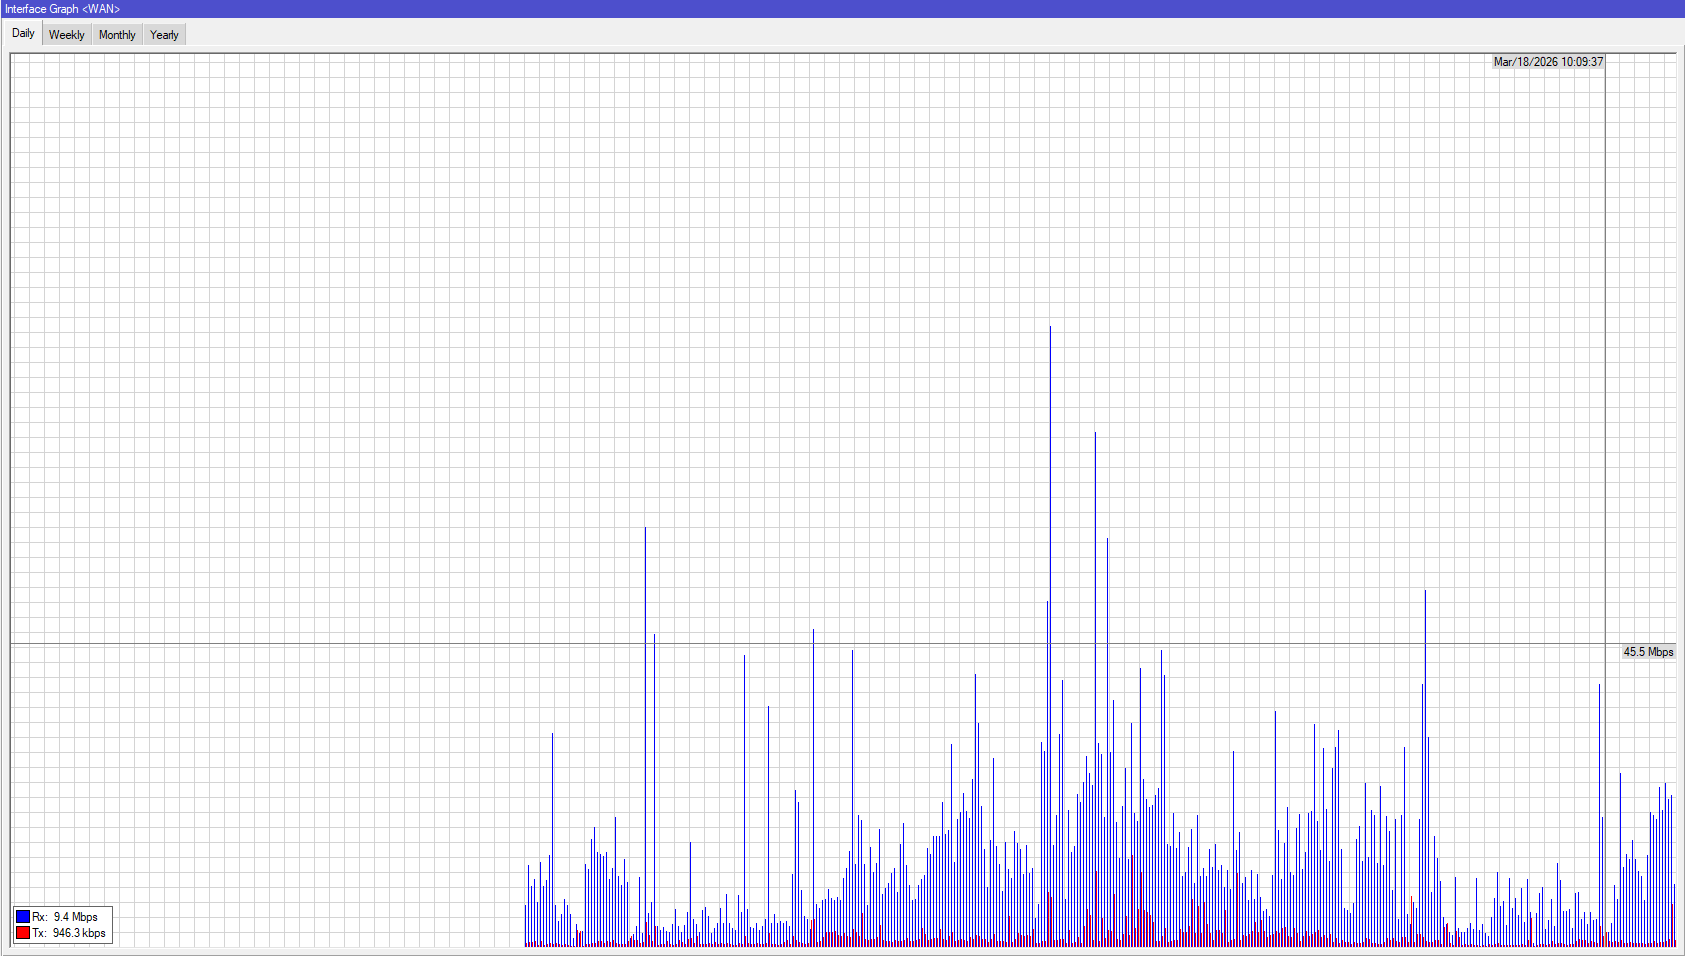
If you suspect that the measurements themselves (not just the stats you collect) are off, you should definitely take a look at the interface->traffic tab in winbox or webfig. Those have a fairly real-time graph by default.

BTW, I've never seen the sort of mismatch you insinuate on a Mikrotik outside of some more peculiar offloaded configurations.

I don’t have expirience to comment the resoults.

Take a look here:

Interfaces graph showing correct data, however over SNMP it showing different values.

I haven’t had a time to dig into and check what OID Zabbix template is checking, hope someone who knows Mikrotik hardware built the template.

What I’m missing here is to see number of estabilished connections. Do you guys know the OID vaule for that?

Does anyone have correct values from speed test seeing on monitoring tools over SNMP?

Maybe I have bad luck only :wink:

p.s. What Zaabbix recorded:

Regards

Slawek

Probably Zabbix is also showing average between SNMP polling intervals…

Could it be … How to check it?
My graph looks like below:

Not sure, not using Zabbix, but I see on you screenshot Approximation setting with avg value, see how it behaves with different setting values (all or max…) - see https://www.zabbix.com/documentation/current/en/manual/web_interface/frontend_sections/dashboards/widgets/graph

thx for this tip, Approximation is:

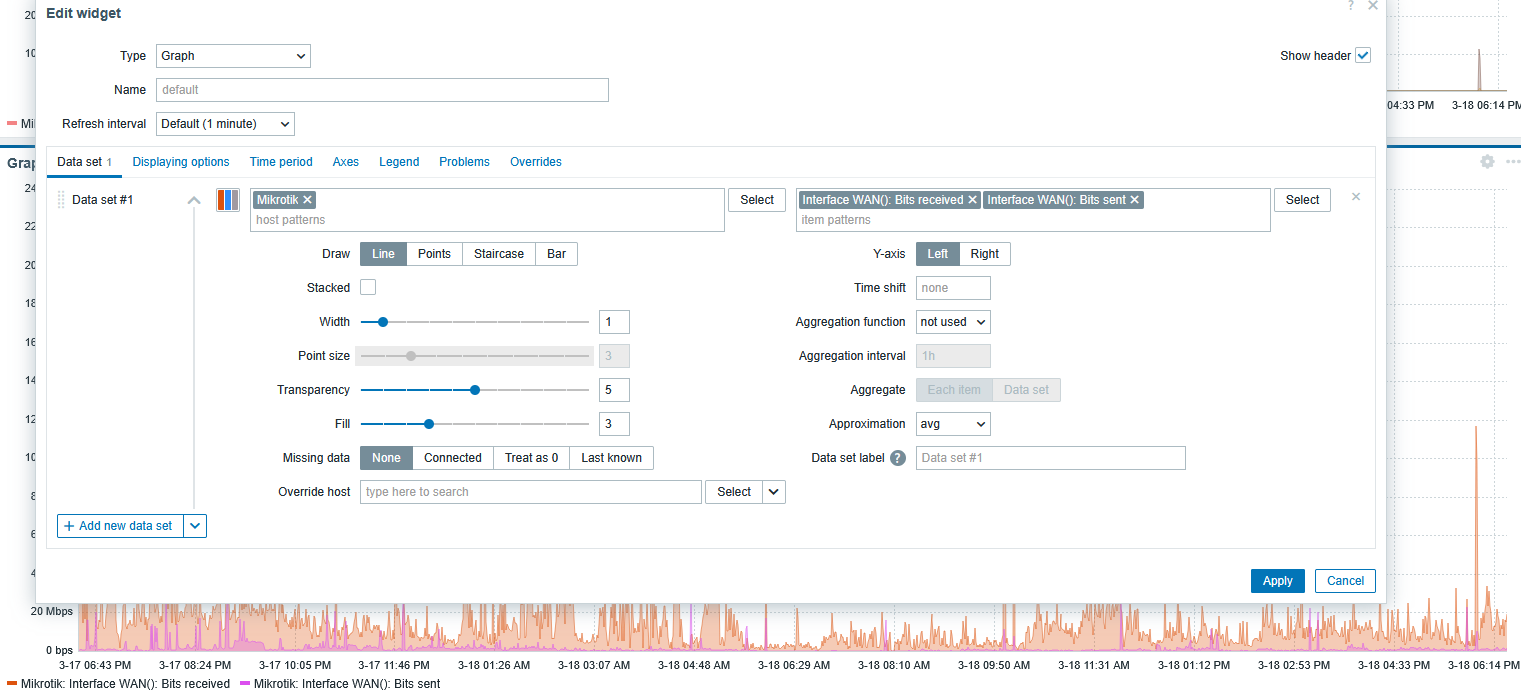
| Approximation | Specify what value to display when more than one value exists per vertical graph pixel:
all - display the smallest, the largest and the average values;
min - display the smallest value;
max - display the largest value;
avg - display the average value.

This setting is useful when displaying a graph for a large time period with frequent update interval (such as one year of values collected every 10 minutes). |
|----|----|

Even when I’ve changed to max, there was no significant change to graph. For every setting graph is the same….

Let’s wait, mybe someone who is using Zabbix can comment here.

Consider that short peaks between polling intervals will not be shown, snmp will not return history between two fetches only current value at time when requested. Only with shorter polling interval there is more chance that short peak will be recorded, but very short intervals can stress resources on devices (router and Zabbix server) and cause network congestion.

I believe SNMP pooling every five minutes is standard for any vendor, including Mikrotik. You are right that any test running for less than 5 minutes could be missed.

In any case, there is still a significant discrepancy between the Zabbix (SNMP) graphs and the /Tools > Graphing graphs.

5min polling interval seems to be a bit too high for accurate monitoring, it’s possible to be more like 1min, but even that interaval is not very precise, try to lower that to 30s or 15s (depending how much your infrastucture allows to run without issues) and monitor behavior.

Regarding the "slow" throughputs:

  1. fasttrack is not enabled which means severe throughput reduction ... on any MT device but those with faster CPUs are mostly still capable of wanted throughputs (at cost of increased CPU loads) while hEX S 2025 is not one of them
  2. I don't think that VLAN-enabled bridge gets offloaded to switch chip on hEX S 2025 ... which means that all traffic, which would be otherwise switched (between different devices in same VLAN, connected to different ports of your device), has to be handled by CPU ... which takes away CPU cycles from routing
  3. your setup is way more complex than typical SoHo config, which is used when taking official test results. Which means that realistically you can't expect to reach test results (even if the rest of stars align)

So basically, what you're getting (500Mbps) is what device, configured the way it is, can deliver. If you require better performance, then you'll have to buy a way more powerful device ... a device whose offcial test results indicate more than Gbps of throughput when looking at ethernet test results -> routing -> 25 ip filter rules -> 512 byte packet sizes (hEX S 2025 has 498.1 Mbps there), published in official product page e.g. for hEX S 2025.

I’m working on the implementation of FastTrack under this topic – could you please review my configuration and suggest any modifications that could help?

Yes, this configuration is not easy, but most of the data flows over one VLAN. The rest of the VLANs are there to separate the traffic from a security perspective.

What model would you recommend for my setup with a throughput of 2.5 Gb/s rather than 1 Gb/s? Are we expecting any new router models soon? With hardware acceleration for VLANs on the switch. I think that this could be a bottle neck here (of course after FastTrack will be enabled)