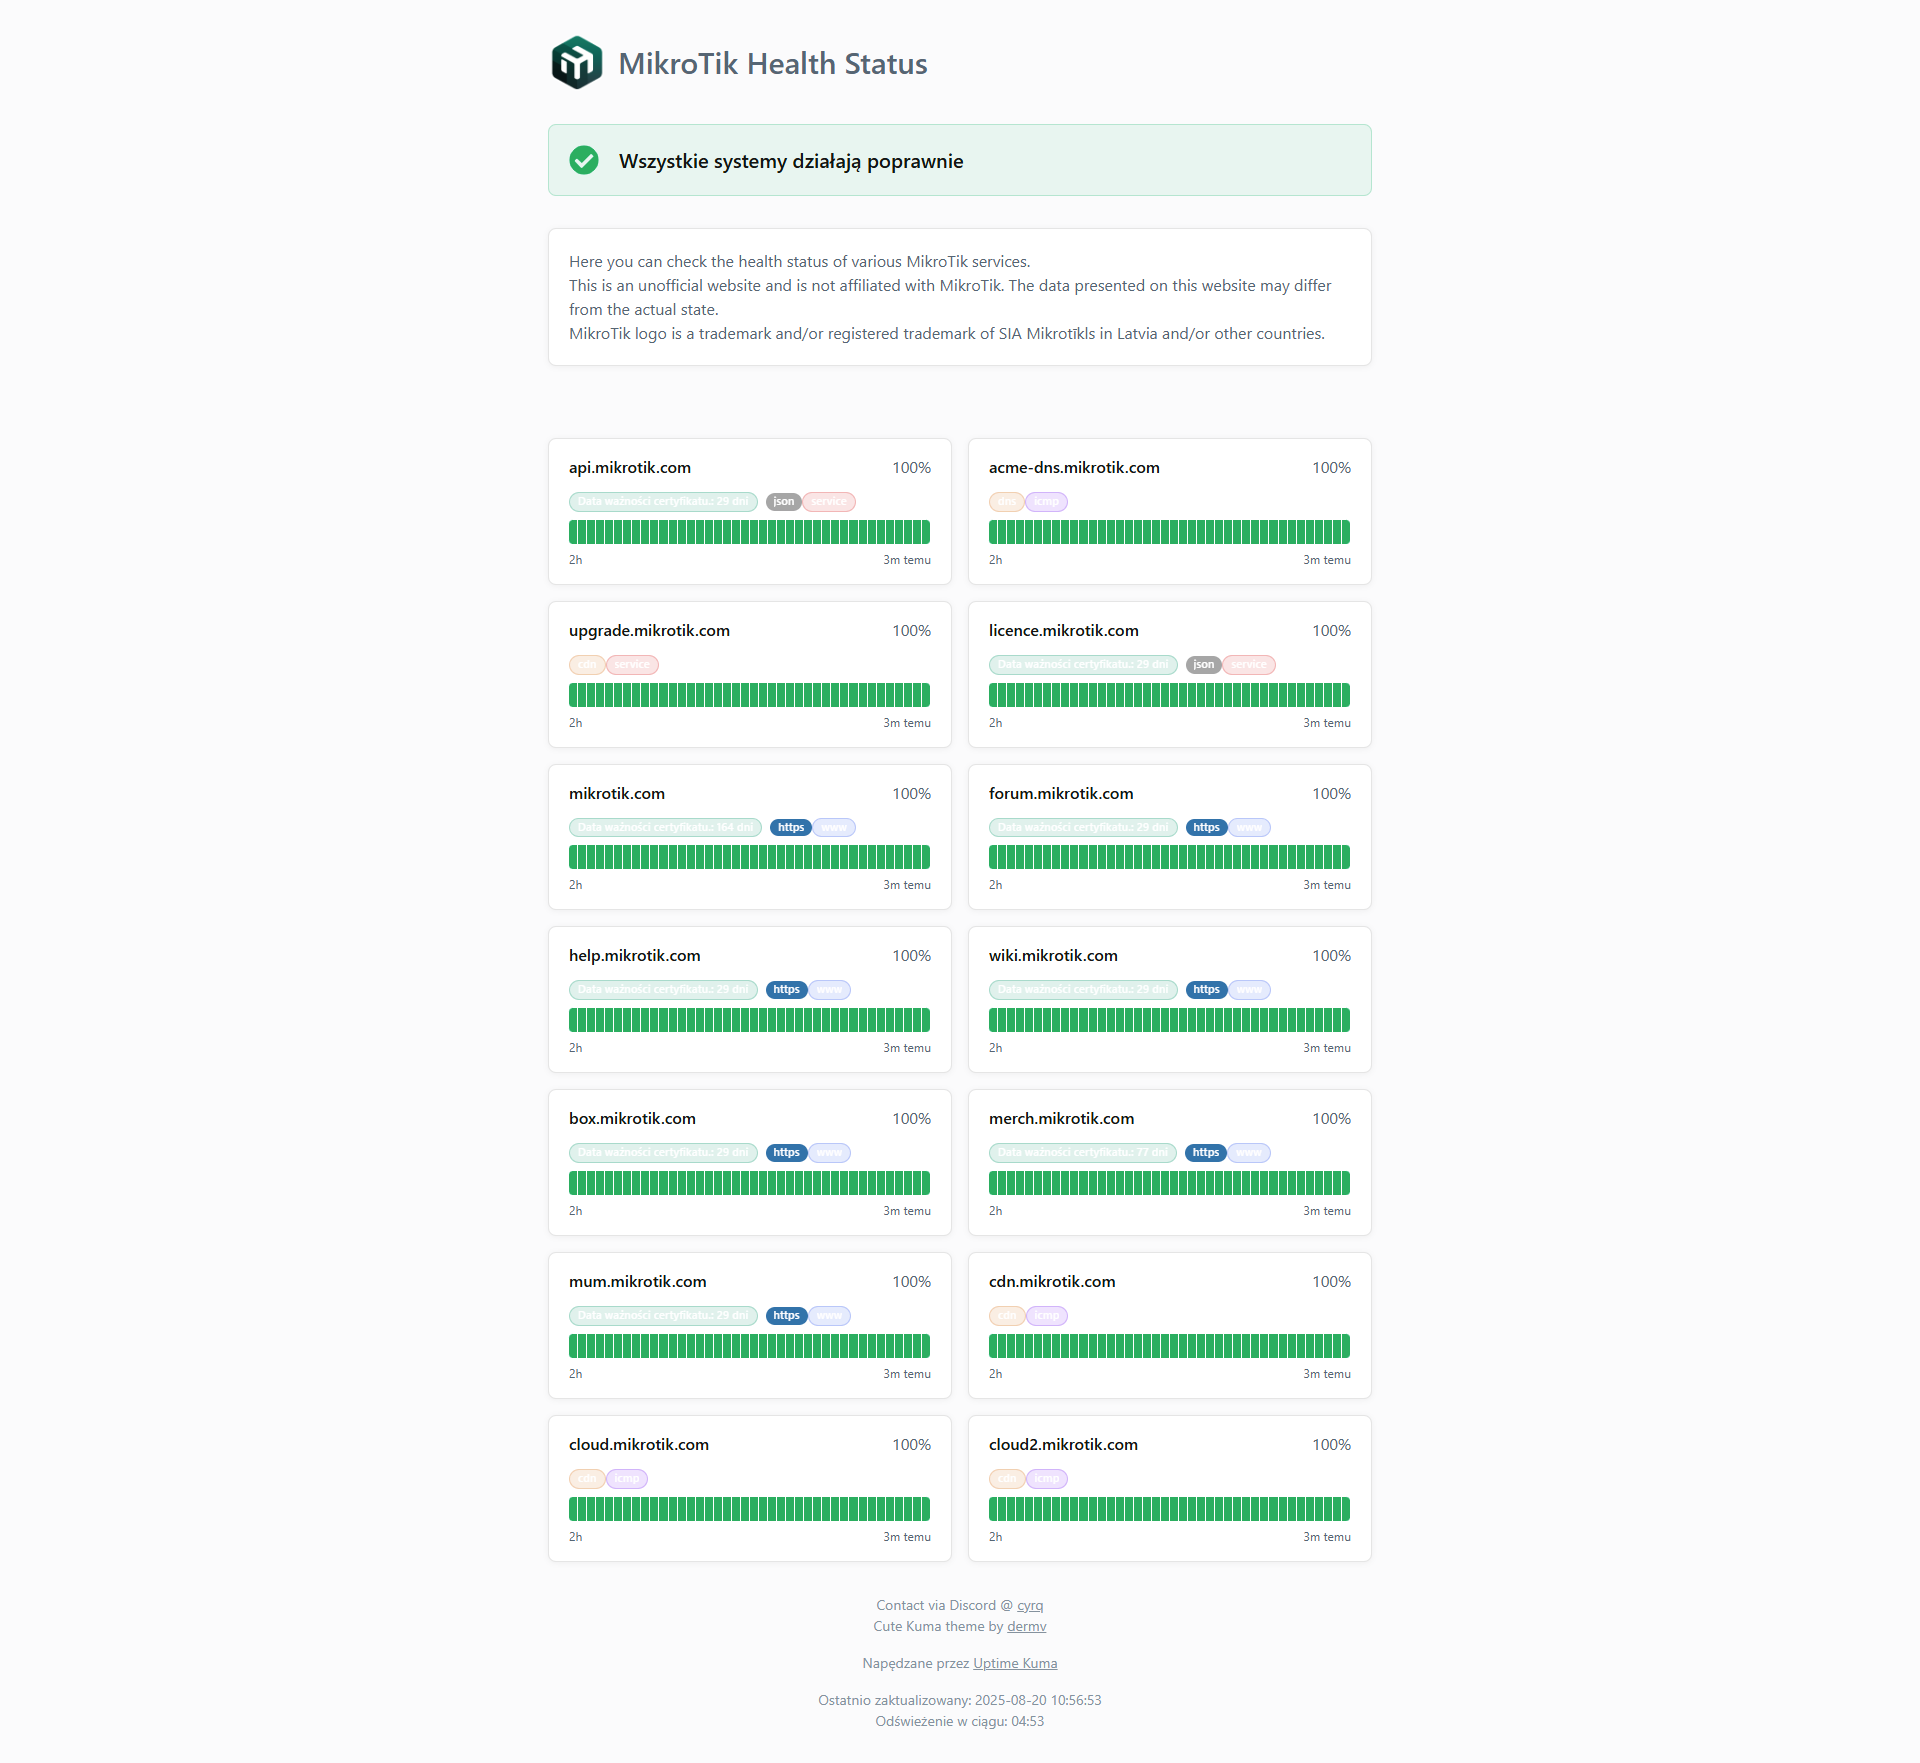
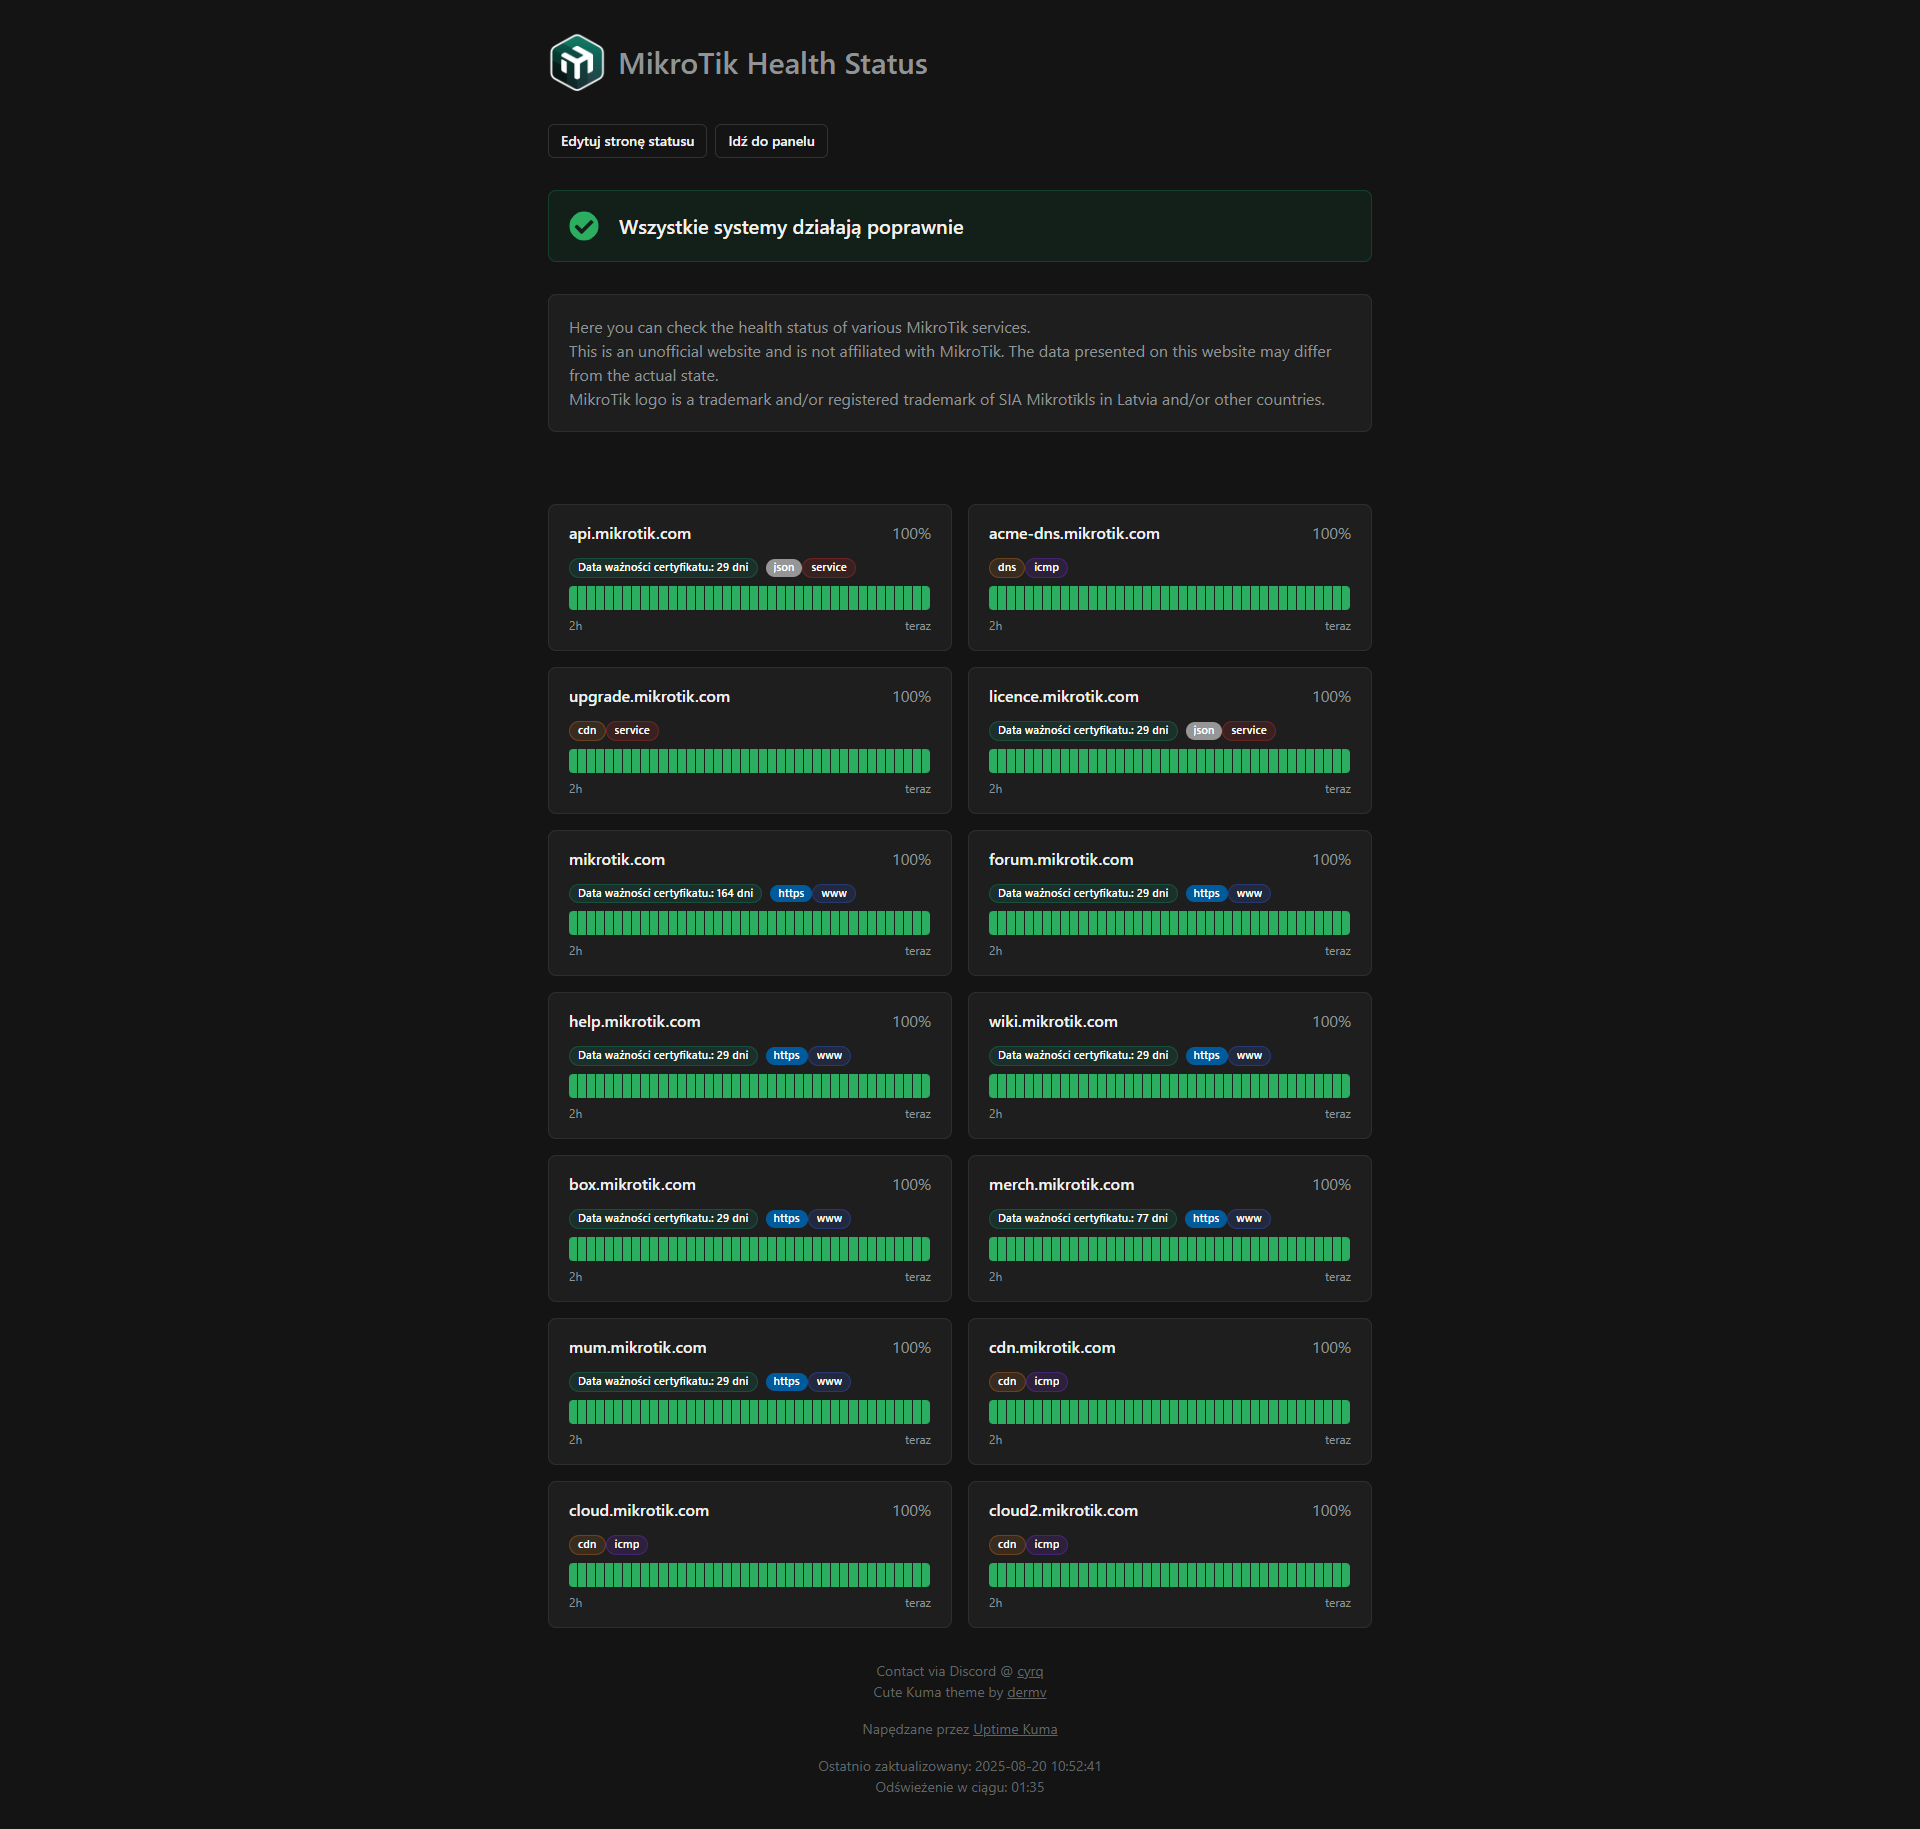
Some time, during a downtime of the old forum or the CHR licence activation server (can't remember exactly) someone on Discord mentioned that MikroTik lacks a status/ health page of it's services, similar to ex. Google, CloudFlare or FortiNet.
So I've spun up a quick instance of Uptime Kuma, tweaked some stuff, bought a "catchy" domain and it's been running for a couple of months now.
I've linked it previously on Discord/ Reddit but not on this forum.
If someone thinks that there's something that should be added or removed from the page (ex. I'm not sure that there's much sense of monitoring cloud*.mikrotik.com) then feel free to leave a comment.
UDP is stateless, so I don’t understand how any such monitoring is possible. Only if the application-level protocol specifically supports some kind of health checks, but then it won’t be UDP monitoring anymore but the application monitoring.
Well, there is still a ping-pong with UDP… So you send something and look for response. The possible part does seem a bit too optimistic. While not sure Uptime Karma support doing anything with UDP, which was my first thought.
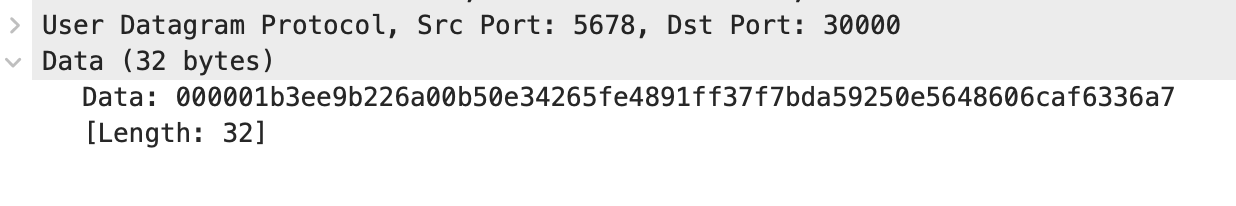
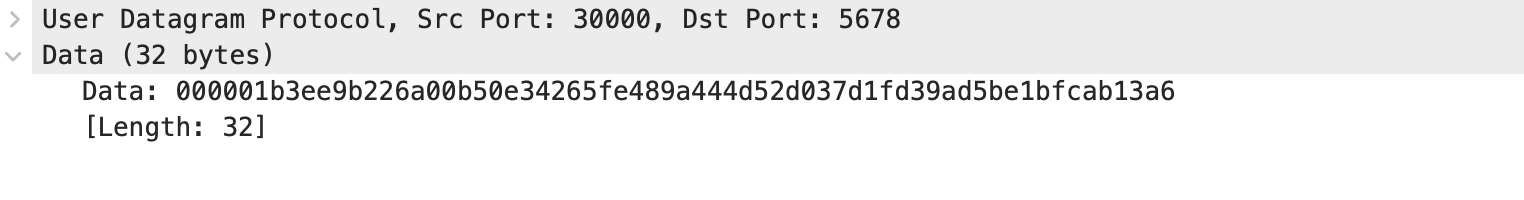
But there is secondary problem is format MikroTik is some 32byte value that changes, presumable it has the DDNS name/serial number/software-id or multiple — but obviously it is documented. I did a quick Wireshark since I wasn’t sure of what it send/got.
Side-note, it uses the MNDP port 5678 (“winbox’s neighbors”) as source port, which is curious since it have to allow that back… I’m not sure it a good idea to overlap the two port usages, different topic.
Indeed, if a higher-level protocol supports this. The Dude probe is either based on proprietary MikroTik discovery protocol MNDP (as you pointed out) or uses some other proprietary protocol. It is this data that is being exchanged, riding on top of UDP.
While this is not a UDP check per se, I agree it is technically possible for third-party tools to support MikroTik proprietary protocol checks if its details are published.
Yeah everyone’s favorite “detect-internet” is documented to use it that port. What it does using it, isn’t. Now looks similar to “packed”/TLV format used elsewhere like in MNDP
But I actually think port 30000 is used in /ip/cloud/ddns and ip/cloud/back-to-home-* - which are more widely used features. My suggestion wasn’t because of detect-internet’s problems - which are more likely local, or design issue since it’s config is error-prone and limited.
Now… AFAIK most of the /ip/cloud outages we’ve seen were network routing failures (so ping would catch). I’m not sure there been a case where some sub-service, like whatever port 30000 does, didn’t work.
I don’t get It, here Is one, It Is evidently NOT “local”.
There are reports from several EU countries and one from Brazil that since a few days:
cloud.mikrotik.com seems functional, responds to pings and the present dashboard reports It as FULLY operations.
yet detect-internet has stopped working
And there are reports of what seems like a similar case in 2023, and you took part in that thread :
I understand how It might not be possible to check if the port/service Is working, but the dashboard should then (IMHO) have a static text to the effect of “detect-internet status:unknown”.
UDP „monitoring” is not possible in Uptime Kuma.
If there’s something that can respond to TCP packets that can confirm the service is properly working, I’m happy to add this to the dashboard.
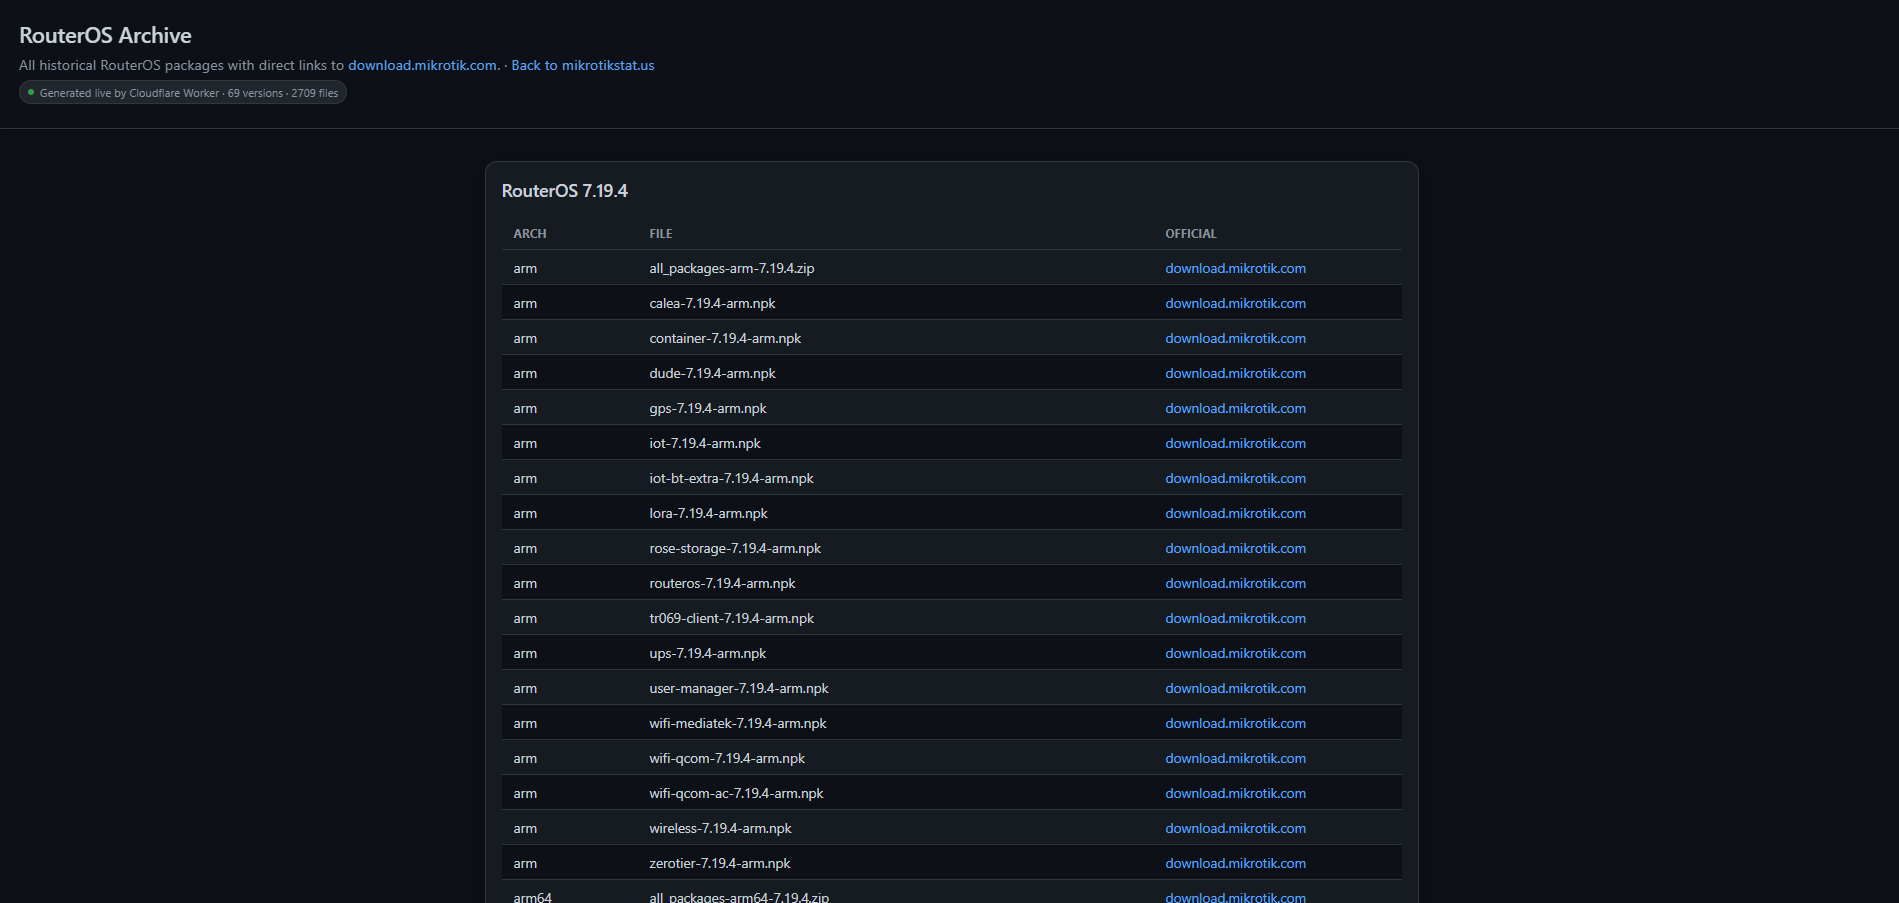
The links are dynamically generated, didn't test them all but they all should work (I hope so).
Sorry, no fancy search bars, filters or cute CSS -maybe in the future.