Some time ago we had a thread where the various possible settings for the Netwatch ICMP probe (which are largely un- and mis- documented on Mikrotik help documentation) were discussed and partially tested, here:
I tried to put together all the info found by the forum members on that thread in a single spreadsheet, adding a couple of (needed) formulas to provide a tool to better find suitable values for the settings.
For my purpose of minimizing positive results (i.e., minimizing a “down” determination to those times when the problem is more than a moment’s loss or flap or “hiccup”), I use:
But, I think (and I certainly could be wrong) that what it does is creates a netwatch that will only have a positive (down) condition when a link is what I would call “truly” down – i.e., something I might want to consider possibly doing something about.
There is certainly no deep analysis that went into choosing these specific numbers.
And @Josephny provides the example of why @jaclaz created a spreadsheet. @Josephny’s settings are not doing what he thinks they are. This was all discussed in the thread that @jaclaz links and his spreadsheet would allow @Josephny to set this better.
What @Josephny doing above is running an intensive ping for ~24 seconds, then waiting 4min36sec, then running again for 24 sec. Sending 2400 pings in each those 24 seconds. And assuming average latency is 400ms is pretty high. So, yes, you may not get a false positives… but what your monitoring is does a ping flood only create extremely high latency.
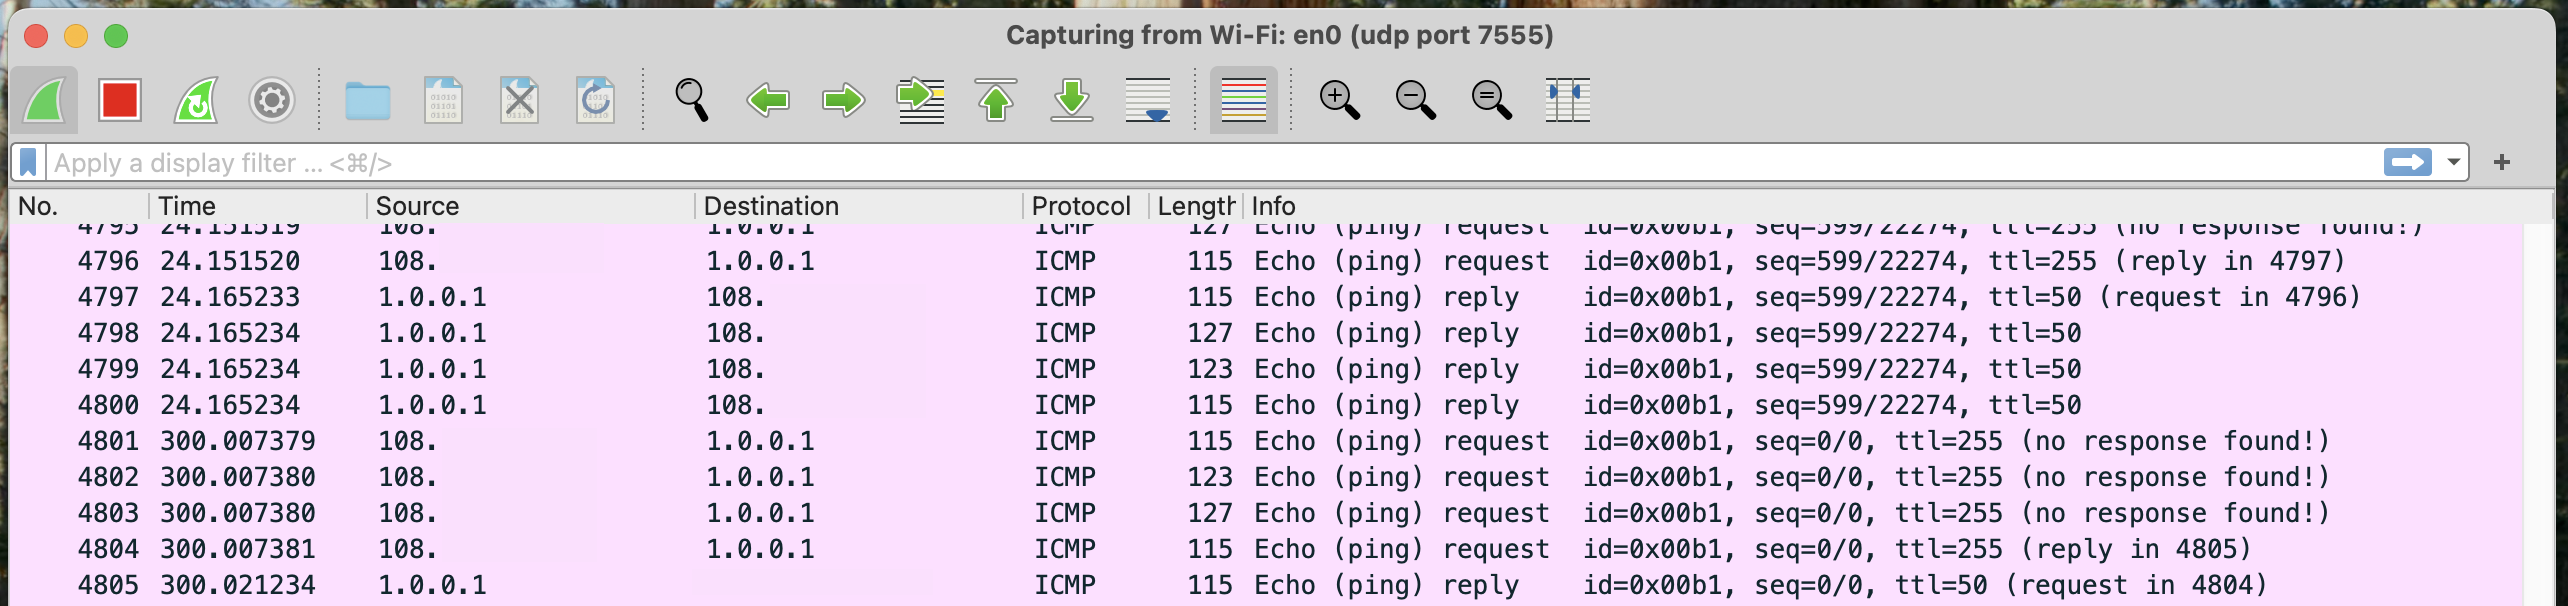
Since TZSP makes this easy, here is a Wireshark of @Josephny netwatch configuration, adjusted to use 1.0.0.1 (so I didn’t have to filter 8.8.8.8):
Notice the Time column above goes from 24 to 300 with the No. column changing time at 4800 (since capture only shows 1.1 traffic, 2400 pings + return is 4800 – apparently didn’t lose any, also matching WinBox that showed no loss)
Basically @Josephny is a counter-counter example of what goes wrong with guessing with ICMP netwatch values.
@Jaclaz, netwatch simple ping often easier if one does not want to understand how to tweak these setting. That’s worth mention. Also default ICMP netwatch settings kinda assume you have a pretty decent wired connection. But in most wireless cases or with janky ISPs, the threshold value almost certainly need to be adjusted.
The two main points I tried to make with the spreadsheet are:
it makes little sense to ping at very short intervals, a tiny fraction of the minimum the two main Operating Systems in the world allow, as I see it may actually create false positives due to flooding
it is pointless to have a very large script interval when all the action is concentrated into an initial burst and then nothing happens for minutes, the spreadsheet suggests 85% to 95% “occupation”
In other words, when monitoring something, “slow, steady, continuous” is better than “fast, wobbly, intermittent”.
@Josephny’s settings are almost exactly the opposite of what they should be according to the previous discussion, but if he is happy with them, it is just fine .
The “simple” netwatch could be considered as !ICMP, and as such does not belong to this topic (which is about ICMP probe and not anything else), but sure, nomen est omen, “simple” is (much) simpler.
Seriously now, maybe a “plain” (ICMP) netwatch is not suitable for your requirements.
Let’s put aside, for the moment, #3 (that could be obtained by fine tuning other settings), and let’s see how #1, #2 and #4 can be reached with the “main” settings.
You can have settings like:
S=300
T=4
pc=270
pi=1000
that give a ratio of 91%.
The settings will ping, one per second, for the first (roughly) 4.5 minutes, and then have some 30 seconds for timeout and threshold comparison.
Now, which loss- percent threshold are you going to set?
If you use the default 85%, it should mean that out of the total 270 packets you send at each run, 0.85*270=229 lost packets won’t trigger the down status, 230 will.
BUT the 270-230=40 packets that can go through will take 40 seconds.
These can be either “sparsely distributed” or concentrated at the beginning or end of the run, let’s see what could happen in these two extreme cases.
If we use | for a successful ping and . for a failed one, you can have:
-|-|-|-.-.-.-.-.-.-
or
-.-.-.-.-.-.–|-|-|-
in BOTH cases the netwatch will go down if the total of | is less than 40 or so.
BUT in the first case the down will be “true”, as the down is triggered after some 4 minutes with no replies to ping and currently there is no connection, in the second it will be “false”, the connection is good when the netwatch takes its decision which is reflecting the state of the connection of the 4 minutes preceding the last minute.
And since the next run will take 5 minutes, this “false” down won’t be corrected for five (long) minutes.
What you probably need - instead - is a sort of netwatch that runs every (say) 1 minute for 30-45 seconds or so and has a mechanism (needs to be scripted) to create a counter with these characteristics:
each fail increases the counter by one
each success resets the counter to 0
when (if) the counter reaches 5, then (and only then) it is a “true” down
That is a great explanation. I’m starting to get it ( – I think.
If we raise the loss-percent to 98, then 264 packets (which would take a minimum of 264 seconds) would need to fail in order for netwatch to determine a DOWN condition.
Or, extending the logic:
S=600
T=4
pc=570
pi=1000
THR-loss-percentage=98
I think that would be that a packet would be transmitted every second for 570 seconds and 559 of them would have to fail for netwatch to declare a DOWN connection.
Or, why not use a thr-loss-percentage of 100 across an S of 300 or 600 to determine what I’m calling a true-non-momentary down connection?
1	thr-max 	fail threshold for round trip time-max (a value above thr-max is a probe fail)	1 s
2	thr-avg 	fail threshold for round trip time-avg	100 ms
3	thr-stdev 	fail threshold for round trip time-stdev	250 ms
4	thr-jitter	fail threshold for round trip time-jitter	1 s
5	thr-loss-percent	fail threshold for loss-percent	85,0%
6	thr-loss-count	fail threshold for loss-count	4294967295	(max)
#5 you set to 95%, #6 won’t be triggered ever. #1 to #4 may well be too low for your connection, but you need to try and see.
I have no idea how the round trip time (common to all 4) is calculated when the ping fails (and - additionally - how it may affect thr-avg and thr-stdev).
There are 9properties (or results) of the ICMP probe (that in the help doc are incorrectly called with prefix thr- instead of rtt- or none prefix and given in a jumbled up order), here (hopefully) corrected and re-ordered:
I did open a doc bug on it, SUP-187116. MikroTik somehow thinks they’re right in docs, or they don’t understand I’m referring the 2nd section perhaps… IDK, but been open 2 months and tried to clarify several times when they closed it (and I reopened by commenting)
Easy to cut-and-paste. Normally MT does just fix the doc when you file an issue about it… IDK what’s going on with this one, so they did get a snarky “perhaps visual aid would help”.
The ICMP variables to use in a on-up=/on-down=/on-test= are still wrong under Netwatch | RouterOS Manual.
See SUP-187116, last update was:
As the documentation is written about probe options NOT script-specific names, I have added script names in description for options - if they are different.
But there are two parts, one with “Type-specific options”, and another with the “Probe statistics/variables”. The first one is correct. But the ICMP probe variables are still not the variable names you need in a on-up=/on-down=/on-test=.
More broadly some example on-up/on-down script likely help more. The "Quick Example" shows the easy case of simple ping, not the more rich ICMP. Similar with DNS and HTTP since there are subtleties that be helpful to see.
has still the mess with thr- vs. rtt- prefix (or no prefix)
Property
Description
Notes
Column 4
sent-count
ICMP packets sent out
OK
response-count
Matching/valid ICMP packet responses received
OK
thr-loss-count
number of lost packets
NO, this is loss-count
thr-loss-percent
number of lost packets in percent
NO, this is loss-percent
thr-avg
mean value of round trip time (rtt-avg)
NO, this is rtt-avg
thr-max
max round trip time (rtt-max)
NO, this is rtt-max
thr-jitter
jitter ( = max - min) of round trip time (rtt-jitter)
NO, this is rtt-jitter
thr-stdev
standard deviation of round trip time (rtt-stdev)
NO, this is rtt-stdev
<-MISSING->
min round trip time
this is rtt-min
AND the ORDER of the properties is mixed up
Please refer to this:
for the order they are listed that should be kept the same for both the thr- and the rtt- ones (and IMHO since ALL thresholds have the thr- prefix, ALL the corresponding "response" items should have the rtt- one, excluding sent-count and response-count, but this is marginal)
i.e.
loss-percent -> rtt-loss-percent (because it corresponds to thr-loss-percent)
loss-count -> rtt-loss-count (because it corresponds to thr-loss-count)
sent-count -> OK as is (because there is no corresponding thr- item)
response-count ->OK as is (because there is no corresponding thr- item)
 .
.

