From the logs of your router, I do see there are some serious error in DHCP request dashboard that I need to look inn to.
It seems to join many request together.
Problem are that one DHCP request are made up of many log messages. No one of these message do contain any unique ID, so it becomes hard to see what belongs together. So if MT reads this message please add ID to all DHCP message where each message that belongs together have same ID.
Thank you for discovering the problem. After I enabled system/package/wireless, the problem was solved. Since I use the router as a hardrouter, there is a separate unifi control to take over the ap device, so the wireless module is naturally disabled. It should be the problem. As for the dhcp problem you mentioned, I don’t think it affects anything. It should be that I didn’t find the problem.
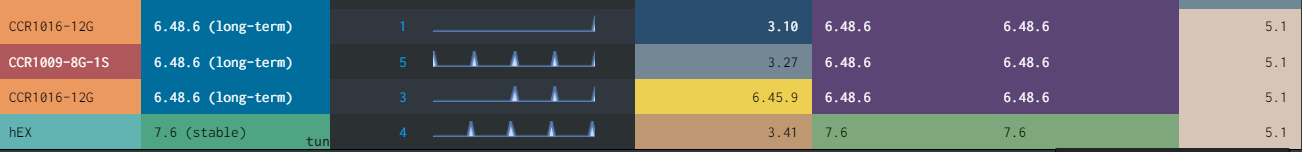
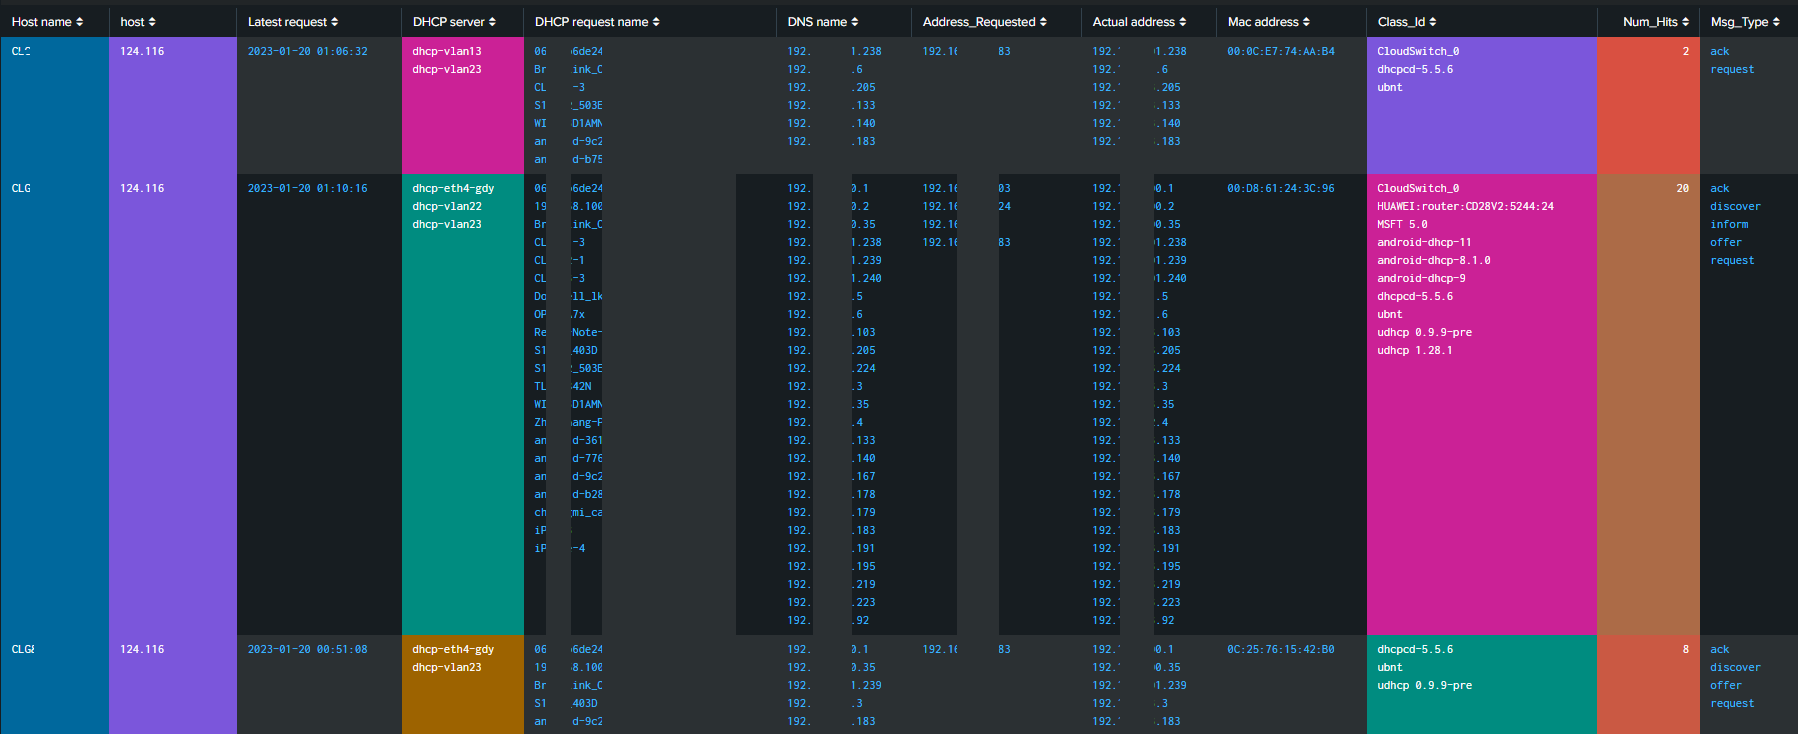
Look at DHCP-> MikroTik DHCP Request.
There should only be one line for each request, not multiline with many different IP and different MAC.
This is due to many DHCP request more or less at the same time, so Debug message are clogged togeather.
It can be solved by only looking at Info message, but then we do loose DHCP Request Name, Class_Id etc.
Until MikroTik does add ID for each DHCP request, I will change the view to a simple default view, that only shows VlAN, IP and MAC, with an option to show more details (if server are not heavy loaded)
For the error in CapsMan part of the script, I am not sure if I will fix it, since 6.x are going away and it works on 6.49 and later (7.x)
It may be enough to post a not about removing that section for older OS or upgrade the OS
Hi problem with “script error: error - contact MikroTik support and send a supout file (10)” in “#Get detailed command history RouterOS” is probalby related to number of enrities in /system history - if there are too many entries, an error message appears (even executing “/system history print”). Rebooting router clears this history and temporaily solving problem.
However logs with “caps,info” with frequency appear very rarely.
So, I added an additional script to log it:
:foreach i in=[/caps-man interface find where master-interface="none"] do={
  :local name [/caps-man interface get $i name]
  :local channel [/caps-man interface get $i current-channel]
  :log info "$name: selected channel $channel"
}
but I have no idea how to properly add information from “script,info” to module=caps eventtype=capsman_channel
I would like to help out, but since I do not use capsmann, its not easy to see what is going on.
But If you like, I can have a look at your logs and try to enhance the capsmann logs.
You can send me an email on hison88097@fectode.com
capsman_channel in eventtypes.conf to:
[capsman_channel]
search = “*,info *: selected channel”
Base search in “Mikrotik CAPsMAN Channel Usage” (i leave both options - generated by caps and by script)
<search id="base_search">
    <query>
      `index`
      sourcetype=mikrotik
      module="script" OR "caps"
      eventtype=capsman_channel
      host="$Host$"
      ap="$AP$"
      | eval host_name=coalesce(identity,host)
      | fields _time host_name host ap channel frequency
      | sort 0 -_time
    </query>
  </search>
i’ve also modified script (Capsmann) to log every hour frequency & channel :
# Test if CAPsMANN is installed.
# ----------------------------------
:if ( ([:len [/interface find where type="cap"]] > 0) and $CAPsMANN) do={
	:local capsregistered ([/caps-man registration-table print count-only])

	/caps-man interface
	:local name
	:local mac

	# ignore all master interfaces
	:foreach i in=[find where master-interface="none"] do={
		:set name [get $i name]
		:set mac [get $i radio-mac]
		:local counter ([/caps-man registration-table print count-only  where interface=$name])
		:log info message="script=caps-man name=$name counter=$counter"
	}
	:log info message="script=caps-man capsregistered=$capsregistered"
#added to log frequency&chennel
:if  ($CAPsMANN and $run) do={
	:foreach i in=[/caps-man interface find where master-interface="none"] do={
		:local name [/caps-man interface get $i name]
		:local channel [/caps-man interface get $i current-channel]
		:log info "$name: selected channel $channel"
		}
	}
}
Thanks. I have never use github for anything other than one project that I beta which test uses github for bug reports - just writing comments.
I’m doing this on a Windows server, so I assume the extract from the zip should go into C:\Program Files\Splunk. The root of the zip is MikroTik-main with the directories you mention below that. Does the MikroTik-main and it sub-folders go into the Splunk directory, or skip the MikroTik-main and just put the sub-folders into the Splunk directory?
I followed the directions in the first post in this thread which says to extract the zip and copy that all to the Splunk directory (MikroTik-mail and it’s sub-folders), but I get absolutely no indication in Splunk that I accomplished anything by doing so (yes, restarted Splunk several times). But I also really have no idea what I am expecting to see…
You can use Mikrotik-main, but I do suggest you remove the main, so the folder should be
C:\Program Files\Splunk\etc\apps\MikroTik\default
C:\Program Files\Splunk\etc\apps\MikroTik\metadata
C:\Program Files\Splunk\etc\apps\MikroTik<+ the rest of folders>
PS restart Splunk after adding the files.
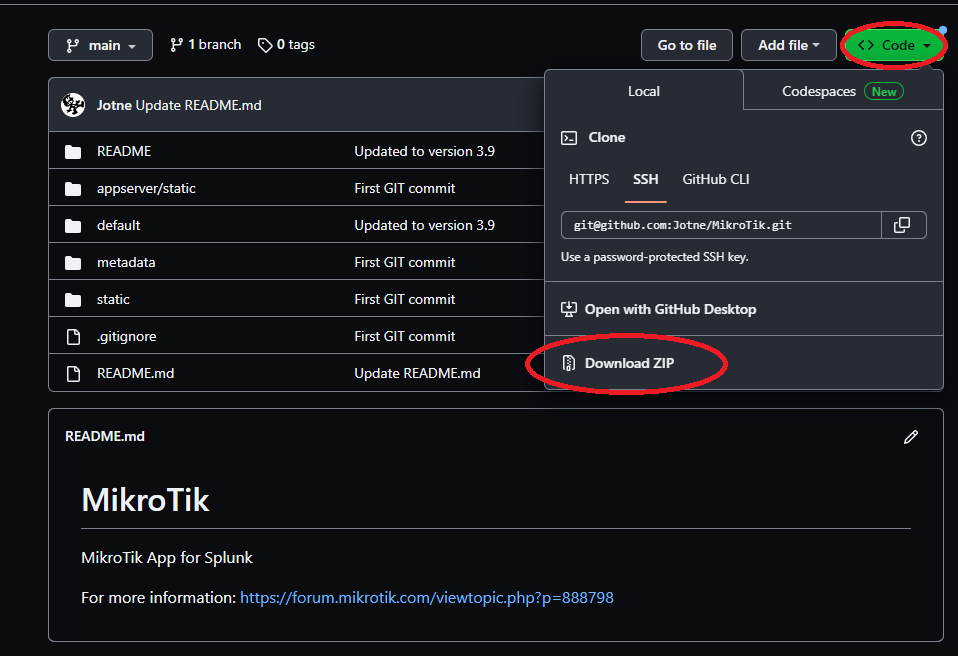
I did added splunk to git so if other like to help out or add stuff it would simpler to do so.
You can also download the rar file in first post under section 1g.
The unpack the file and you get a Mikrotik.spl
Go then to you Splunk->Apps-Manage apps->Install app from file
Splunk will then install the app for you.
I used to download the .spl and load it thru the splunk interface …
Last week I downloaded the git stuff and tried to upload it manually into the directory inside the splunk docker that I run.
I noticed that I needed to correct the user/group manually to get things working again …
Normally splunk did that but by uploading the files it has to be done by hand to match the system …