Version 4.0 21.03.2024
.
NB, there seems to be an error with script running in routerOS 7.13.3, so upgrade to 7.13.4 or later if you have 7.13.3
4.0 important Information:
- All routers needs serial number in their logging tags (section 2a). If not you will not get any dashboard to work. To add serial, run the script in section 2a on all routers. (cut and past to a terminal windows.
- If you for some reason has an other system logging action other than logserver, you need to edit the serial update script in 2a to use your action name
.

Using Splunk to monitor and graph various data from our MikroTik Routers is a nice and free way to help you showing what is going on in your network.
Splunk is free to use for logging up to 500MB pr day.
You can request a 10GB/day developer license here: https://dev.splunk.com/enterprise/dev_license/
NB logging large amount of Accouning, DNS or firewall rules quickly eats up license, so I do recommend to turn off Accouning/DNS logging to start with.
Splunk can be used to monitor multiple devices. No ports needs to be opened (like with SNMP monitoring). All data are sent from the device to the Splunk monitor (using sctipt and syslog). Devices could be all around the world.
PS:
Traffic monitoring does not work correctly while fast track is enabled (and its removed in v7.x of RouterOS. Changed to Kid control). Turn fast track off and you may loose throughput, so its something you should consider when using this type of monitoring. How to disable fast track: https://www.youtube.com/watch?v=6LaqhDm6PHI
latest changes
Added to GIT
4.0 (21.03.2024)
Changed to use serial in all dashboard
Changed many regex due to added serial
Changed to use MikroTik index directly without macro
Removed host_name and use identity in all dashboard
Change device_table script to update every hour, not every day
Fixed form version. Should always be 1.1
Added DHCP lookup of client name in mikrotik_accounting_traffic
Fixed romon info extraction. Use host_name in graphs in mikrotik_admin_user_login
Joined multipe IP for the same host, Fixed list for multiple firmware, fixed errors in varios dashboards in mikrotik_device_list
Added Time Span and separated IP address from name with - in mikrotik_dns_request.
Rewritten calcualtion to give correctly bps and now works with multiple hosts, Added graph to show total bytex tx/rx in mikrotik_interface_traffic
Installation
On your PC
1) Works on Windows and Linux, but use Linux (clearly the best choice and also used in all post here)
1a) Download and install Splunk (Windows or Linux(Ubuntu recommended))
PS you need an account to download. It’s free to create.
https://www.splunk.com/en_us/download/splunk-enterprise.html
PS you need to create an account to download the file. Free to download and use (up to 500MB/day)
PS remember to set timezone on Windows/Linux, or else logging time will be wrong.
1b) PS: To install Splunk as a non root user, recommended. (needs an external syslog reciver)
Splunk setup:
https://forum.mikrotik.com/viewtopic.php?t=179960#p888802
rsyslog setup
https://forum.mikrotik.com/viewtopic.php?t=179960#p888803
Splunk can run as root user, but not recommended.
1c) Change to free license group. Very important to do before 30 day of use. !!!
Web gui:
1d) Settings->licensing->Change license group->Free licnse->Save
1e) Open Windows Firewall for UDP on Windows (On linux its not blocked)
Web gui:
Start->type “adv”->Select:Widows Firewall with Advanced Security->Sect Inbound rules->Right Click “Inbound Rules”>New Rule-Port-Next->UDP->Specific local ports->514->Next->Next->Next->Name “syslog”
1f) Allow UDP 514 (syslog), only if you run Splunk as root and not using rsyslog server. (rsyslog can be used when splunk runs as root or as non-root user.)
If running Splunk as non ROOT user or like to use external syslog reciever, see 1b for non-root)
Web gui:
Setting->Datainputs->Add new (behind the UDP)->Port 514->Next->Sourcetype type syslog and select syslog->Next-Submit
1g) Get the Splunk
You can use one of the two option
…1. Download the file from the forum here:
MikroTik4.0.rar (73.2 KB)
.
…2 Get the GIT repository
https://github.com/Jotne/MikroTik
1h)Installing the Splunk
…1 If you get the file form the from the forum, extract the compressed file to get the Mikrotik.spl file and install it using Splunk Gui:.
From Start page in Splunk, click the gear behind Apps or
from top meny click Apps->Manage Apps
Then select Install app from file and select the spl file
…2 Download it from GIT.
If you download it from GIT copy folder with all content to %Splunk%/etc/apps. so it becomes:
%Splunk%/etc/apps/MikroTik/default/…
%Splunk%/etc/apps/MikroTik/metadata/…
%Splunk%/etc/apps/MikroTik/README
…
1i) A restart of Splunk may be needed.
Web gui:
Settings->Server controls->Restart Splunk
1j) Upgrade form previous version.
Some time files are renamed, so if you have not change any original files, just delete the MikroTik folder.
No logged data will be deleted.
If you have custom dashboards, menus, saved search (reports) etc, you need to merge the configuration files.
They are normal stored in “local” folder.
2a) Syslog
You need to make your Router able to send Syslog messages.
Cut and past the following to a terminal window.
Set the log server: (change IP to your log server)
/system logging action add name=logserver target=remote remote=192.168.1.50 remote-port=514
Sets the correct tag MikroTik so data can be picked up. It also set the RouterBoard serial to all packet so multiple routers behind nat can be identified. If its not a routerBard and do not have a serial, a random hex number of 12 digits are set,
{
:local serial na
:foreach id in=[/system/logging/find action prefix~"MikroTik"] do={
/system logging remove numbers=$id
}
:local boardName [/system resource get board-name]

:if ($boardName = "CHR") do={
	:set serial [/system license get system-id]
} else= {
	:local arch [/system resource get architecture-name]

	:if ($arch = "x86_64") do={
		:set serial [/system license get software-id]
	} else={
		:set serial ([/system routerboard get serial-number])
	}
}
# Log hotspot at debug level
/system logging add action=logserver prefix="serial=$serial MikroTik" topics=hotspot

# Do not log debug, packet nor snmp, but all other will be logged.
/system logging add action=logserver prefix="serial=$serial MikroTik" topics=!debug,!packet,!snmp

# Do not log info internal logs, only warning and error logs
/system/logging/disable numbers=[/system logging/find where topics~"info"]
}
PS Do NOT select BSD Syslog. It will mess up the logging format. BSD adds date and severity, but in the same time remove the prefix that tells what modules that do send logs to syslog.
2b) Select what rules to log
NB Do not use more than 20 charters, or else it start to clip other part of the log!!!
To log the Firewall and Nat rules, you need to turn on logging and add Log Prefix (under action).
Do not log more than needed. Logging rules like defconf: accept established,related rules will flod your log,
Below is a sample on how to name the log rules. You do not need to follow this rule, but it makes it more uniform.
Rule name logging
==================

Format:
x_y_z

x=<where and direction>
y=<what to do>
z=<name/info>

Example
-------
Filter Rule Forard allow HTTP
FF_A_Http

Filter Route Input Drop ICMP
FI_D_Icmp

Nat HTTP
ND_DE_Http

Mangle Mark HTTP packets
MF_MP_Http


Filter Rule
------------------
x=
FF Filter Forward
FI Filter Input
FO Filter Output
FX Filter Custom list

y=
A  Accept
AD Add to dst address list
AS Add to src address list
D  Dropp
F  Fast track
J  Jump
L  Log
P  Passthrough
RJ Reject
RT Return
T  Tarpit

Nat Rule
------------------
x=
ND Dest nat
NS Source nat

y=
A  Accept
AD Add to dst address list
AS Add to src address list
DE Dst-nat
J  Jump
L  Log
M  Masquerade
N  Netmap
P  Passthrough
RE Redirect
RT Return
SA same
S  Src-nat

Raw
------------------
x=
RP Filter Raw Prerouting
RO Filter Raw Output

y=
A  Accept
AD Add to dst address list
AS Add to src address list
F  Fast track
D  Dropp
J  Jump
L  Log
N  No track
P  Passthrough
RT Return

Mangle
------------------
x=
MF Mangle Forward
MI Mangle Input
MP Mangle Postrouing
MR Mangle Prerouting

y=
A  Accept
AD Add to address list
AS Add to dst address list
CD Change DSCP
CM Change MSS
CT Change TTL
CL Clear DF
F  Fast track
J  Jump
L  Log
MC Marc connection
MP Mark packets
MR Mark routing
P  Passthrough
RT Return
RO Route
S  Set proirity
SP Sniff PC
ST Sniff TZSP
SI Strip IPv4 options
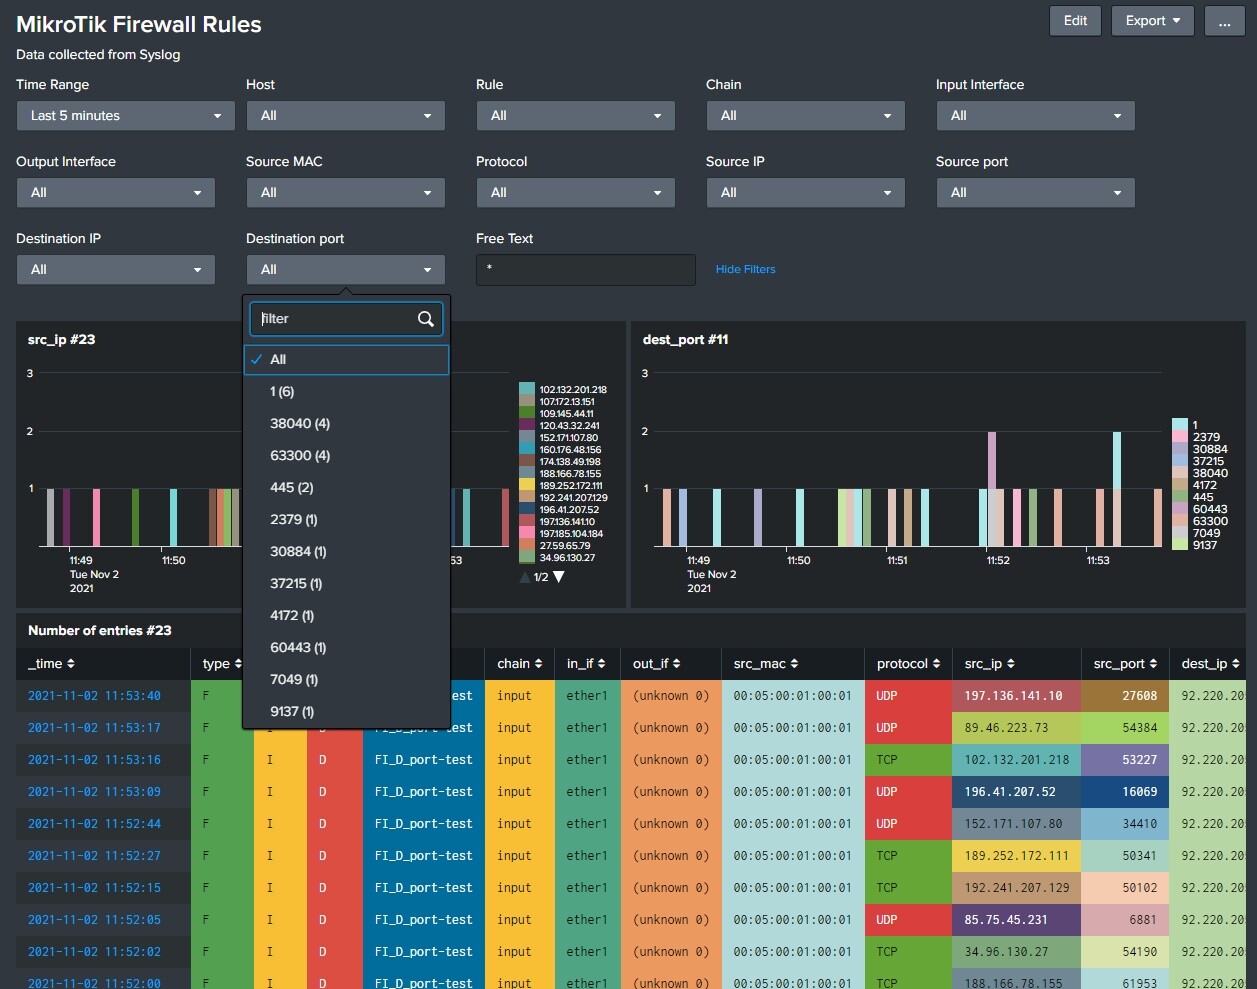
2d) You should at least log this rule “defconf: drop all not coming from LAN” with this prefix: FI_D_port-test
Web gui:
IP->Firewall->selec:defconf: drop all not coming from LAN->Log:v->Log Prefix:FI_D_port-test
This will populate the MikroTik Live attack view.
2e) Accounting (new version in 3.5)
To get accounting data, you need to turn on Kid Control on the MikroTik router. (MikroTik Traffic dashboard)
Cli:
/ip kid-control
add fri=0s-1d mon=0s-1d name=Monitor sat=0s-1d sun=0s-1d thu=0s-1d tue=0s-1d wed=0s-1d
2f) Scripts
Main Script:
To get all the other data like Traffic accounting, uPnP, System health, System resources and DHCP pool information you need this script on the MikroTik. Create this script with name Data_to_Splunk_using_Syslog and cut and past code using gui.
In the top of the script, you can set a module to true/false. If you do not use wifi, set :local Wireless false
You can from the main script adjust what it should collect or not collect by change between true and false in the first part of the script,
# Collect information from Mikrotik RouterOS
# Jotne 2025
# Script name=Data_to_Splunk_using_Syslog
:log info message="script=version ver=5.8"
# ----------------------------------

# Auto update syslog server. 5.3-5.4.
# Change <your syslog dns name> to the dns of your syslog server.
# The update is disabled by default.  Remove the # from the two next line to use it.

#:local mySyslog [resolve <your syslog dns name>]
#/system/logging/action/set [find where name="logserver"] remote=$mySyslog


# What data to collect.  Set to false to skip the section
# ----------------------------------
:local SystemResource true
:local SystemInformation true
:local SystemHealth true
:local TrafficData true
:local AccountData true
:local uPnP true
:local Wireless true
:local AddressLists true
:local DHCP true
:local Neighbor true
:local InterfaceData true
:local CmdHistory true
:local CAPsMANN false

:local Routing true
:local OSPF false
:local BGP false

:local PPP true
:local IPSEC true

# Get RouterOS main version (used to run different script on different version)
:local train [:tonum [:pick [/system resource get version] 0 1]]

# Collect system resource
# ----------------------------------
:if ($SystemResource) do={
	/system resource
	:local cpuload [get cpu-load]
	:local freemem ([get free-memory]/1048576)
	:local totmem ([get total-memory]/1048576)
	:local freehddspace ([get free-hdd-space]/1048576)
	:local totalhddspace ([get total-hdd-space]/1048576)
	:local up [get uptime]
	:local sector [get write-sect-total]
	:log info message="script=resource free_memory=$freemem MB total_memory=$totmem MB free_hdd_space=$freehddspace MB total_hdd_space=$totalhddspace MB cpu_load=$cpuload uptime=$up write-sect-total=$sector"
}


# Make some part only run every hours
# ----------------------------------
:global Hour
:local run false
:local hour [:pick [/system clock get time] 0 2]
:if ($Hour != $hour) do={
	:global Hour $hour
	:set run true
}


# Get NTP status
# ----------------------------------
:local ntpstatus ""
:if ([:len [/system package find where !disabled and name=ntp]] > 0 or [:tonum [:pick [/system resource get version] 0 1]] > 6) do={
    :set ntpstatus [/system ntp client get status]
} else={
    :if ([:typeof [/system ntp client get last-update-from]] = "nil") do={
        :set ntpstatus "using-local-clock"
    } else={
        :set ntpstatus "synchronized"
    }
}
:log info message="script=ntp status=$ntpstatus"


# Get interface traffic data for all interface
# ----------------------------------
:if ($TrafficData) do={
	:foreach id in=[/interface find] do={
		:local output "$[/interface print stats as-value where .id=$id]"
		:set ( "$output"->"script" ) "if_traffic"
		:log info message="$output"
	}
}


# Get traffic data v2 (Kid Control)
# ----------------------------------
:if ($AccountData) do={
	:foreach logline in=[/ip kid-control device find] do={
		:local output "$[/ip kid-control device get $logline]"
		:set ( "$output"->"script" ) "kids"
		:log info message="$output"
	}
}


# Finding dynmaic lines used in uPnP
# ----------------------------------
:if ($uPnP) do={
	:foreach logline in=[/ip firewall nat find where dynamic=yes and comment~"^upnp "] do={
		:local output "$[/ip firewall nat print as-value from=$logline]"
		:set ( "$output"->"script" ) "upnp"
		:log info message="$output"
	}
}


# Collect system information 5.5 added ID for non routerBoard 5.6 Remvoed serial
# ----------------------------------
:local model na
:local ffirmware na
:local cfirmware na
:local ufirmware na
:if ($SystemInformation and $run) do={
	:local version ([/system resource get version])
	:local board ([/system resource get board-name])
	:local identity ([/system identity get name])
	:do {
		:if ($board!="CHR" OR $board!="x86") do={
			/system routerboard
			:set model ([get model])
			:set ffirmware ([get factory-firmware])
			:set cfirmware ([get current-firmware])
			:set ufirmware ([get upgrade-firmware])
		}
	} on-error={}
	:log info message="script=sysinfo version=\"$version\" board-name=\"$board\" model=\"$model\" identity=\"$identity\" factory-firmware=\"$ffirmware\" current-firmware=\"$cfirmware\" upgrade-firmware=\"$ufirmware\""
}


# Collect system health (health removed from some routers 5.8)
# ----------------------------------
:do {
	:if ($train > 6 and $SystemHealth) do={
		# New version (RouterOS >6)
		:foreach id in=[/system health find] do={
			:local health "$[/system health get $id]"
			:set ( "$health"->"script" ) "health"
			:log info message="$health"
		}
	} else={
		# Old version (RouterOS 6 or older)
		:if (!([/system health get]~"(state=disabled|^\$)")) do={
			:local health "$[/system health get]"
			:set ( "$health"->"script" ) "health"
			:log info message="$health"
		}
	}
} on-error={}


# Sends wireless client data to log server
# ----------------------------------
:if ($Wireless && [:len [/int find where type=wlan]]>0) do={
	/interface wireless registration-table
	:foreach i in=[find] do={
		:log info message=".id=$i;ap=$([get $i ap]);interface=$([get $i interface]);mac-address=$([get $i mac-address]);signal-strength=$([get $i signal-strength]);tx-rate=$([get $i tx-rate]);uptime=$([get $i uptime]);script=wifi"
	}
}


# Count IP in address-lists
#----------------------------------
:if ($AddressLists) do={
	:local array [ :toarray "" ]
	:local addrcntdyn [:toarray ""]
	:local addrcntstat [:toarray ""]
	:local test
	:foreach id in=[/ip firewall address-list find] do={
		:local rec [/ip firewall address-list get $id]
		:local listname ($rec->"list")
		:local listdynamic ($rec->"dynamic")
		:if (!($array ~ $listname)) do={ :set array ($array , $listname) }
		:if ($listdynamic = true) do={
			:set ($addrcntdyn->$listname) ($addrcntdyn->$listname+1)
		} else={
			:set ($addrcntstat->$listname) ($addrcntstat->$listname+1)}
	}
	:foreach k in=$array do={
		:log info message=("script=address_lists list=$k dynamic=".(($addrcntdyn->$k)+0)." static=".(($addrcntstat->$k)+0))}
}


# Get MNDP (CDP) Neighbors
# ----------------------------------
:if ($Neighbor and $run) do={
	:foreach neighborID in=[/ip neighbor find] do={
		:local nb [/ip neighbor get $neighborID]
		:local id [:pick ("$nb"->".id") 1 99]
		:foreach key,value in=$nb do={
			:local newline [:find $value "\n"]
			:if ([$newline]>0) do={
				:set value [:pick $value 0 $newline]
			}
			:log info message="script=neighbor nid=$id $key=\"$value\""
		}
	}
}


# Collect DHCP Pool information
# ----------------------------------
:if ($DHCP and $run) do={
	/ip pool {
		:local poolname
		:local pooladdresses
		:local poolused
		:local minaddress
		:local maxaddress
		:local findindex

# Iterate through IP Pools
		:foreach pool in=[find] do={
			:set poolname [get $pool name]
			:set pooladdresses 0
			:set poolused 0

# Iterate through current pool's IP ranges
			:foreach range in=[:toarray [get $pool range]] do={

# Get min and max addresses
				:set findindex [:find [:tostr $range] "-"]
				:if ([:len $findindex] > 0) do={
					:set minaddress [:pick [:tostr $range] 0 $findindex]
					:set maxaddress [:pick [:tostr $range] ($findindex + 1) [:len [:tostr $range]]]
				} else={
					:set minaddress [:tostr $range]
					:set maxaddress [:tostr $range]
				}

# Calculate number of ip in one range
				:set pooladdresses ($maxaddress - $minaddress)

# /foreach range
			}

# Test if pools is used in DHCP or VPN and show leases used
			:local dname [/ip dhcp-server find where address-pool=$poolname]
			:if ([:len $dname] = 0) do={
# No DHCP server found, assume VPN
				:set poolused [:len [used find pool=[:tostr $poolname]]]
			} else={
# DHCP server found, count leases. 5.7 Fixed where a pool is used in multiple DHCP servers
				:local dname [/ip dhcp-server get [:pick [find where address-pool=$poolname] 0] name]
				:set poolused [:len [/ip dhcp-server lease find where server=$dname]]}

# Send data
			:log info message=("script=pool pool=$poolname used=$poolused total=$pooladdresses")

# /foreach pool
		}
# /ip pool
	}
}


# Get detailed command history RouterOS >= v7
# ----------------------------------
:if ($train > 6 and $CmdHistory) do={
	:global cmd
	:local f 0
	:foreach i in=[/system history find] do={
		:if ($i = $cmd) do={ :set f 1 }
		:if ($f != 1) do={
			:log info message="StartCMD"
			:log info message=[/system history get $i]
			:log info message="EndCMD"
		}
	}
	:global cmd  [:pick [/system history find] 0]
}


# Test if CAPsMANN is installed and run script 5.5
# ----------------------------------
:if ( ([:len [/interface find where type="cap"]] > 0) and $CAPsMANN) do={
	/system script run CAPsMANN
}


# Collect routing information
# ----------------------------------
:if ($Routing) do={
	/ip route
	:foreach id in=[find] do={
		:local route "$[get $id]"
		:set ( "$route"->"script" ) "route"
		:log info message="$route"
	}
}

:if ($OSPF) do={
	/routing ospf neighbor
	:foreach id in=[find] do={
		:local ospf "$[get $id]"
		:set ( "$ospf"->"script" ) "ospf"
		:log info message="$ospf"
	}
}

:if ($BGP) do={
	/routing bgp session
	:foreach id in=[find] do={
		:local bgp "$[get $id]"
		:set ( "$bgp"->"script" ) "bgp"
		:log info message="$bgp"
	}
}


# Collect PPP/IPSEC
# ----------------------------------
:if ($PPP) do={
	/ppp active
	:foreach id in=[find] do={
		:local ppp "$[get $id]"
		:set ( "$ppp"->"script" ) "ppp"
		:log info message="$ppp"
	}
}

:if ($IPSEC) do={
	/ip ipsec active-peers
	:foreach id in=[find] do={
		:local ipsec "$[get $id]"
		:set ( "$ipsec"->"script" ) "ipsec"
		:log info message="$ipsec"
	}
}

# End Script
CAPsMANN scrip. Only needed if you are using CAPsMANN
# CAPsMANN script

:local capsregistered ([/caps-man registration-table print count-only])

/caps-man interface
:local name
:local mac

# ignore all master interfaces
:foreach i in=[find where master-interface="none"] do={
	:set name [get $i name]
	:set mac [get $i radio-mac]
	:local counter ([/caps-man registration-table print count-only  where interface=$name])
	:log info message="script=caps-man name=$name counter=$counter"
}
:log info message="script=caps-man capsregistered=$capsregistered"
#added to log frequency&chennel
:if ( ([:len [/interface find where type="cap"]] > 0) and $CAPsMANN and $run) do={
:foreach i in=[/caps-man interface find where master-interface="none"] do={
	:local name [/caps-man interface get $i name]
	:local channel [/caps-man interface get $i current-channel]
	:log info "$name: selected channel $channel"
	}
}
2g) Then schedule the script to run every 5 minutes:
/system scheduler
add interval=5m name="Data_to_Splunk" on-event=Data_to_Splunk_using_Syslog
3) Starting up
3a) Startup information
Some parts of the scripts runs only every hour, and some jobs in Splunk runs once a day.
So it will take time before all devices er named correctly. To speed things up some, do this:
After running for some hour and you see that data are coming, in Splunk go to:
Apps->Mikrotik->Reports and run both Device table updater and DHCP table updater by clicking on Open In Search behind the app
4) Debugging
4a) See if any data are comming inn to splunk at all. Do a search in Splunk for:
index=*
4b). Test if data has correct tag “MikroTik” (Capital M & T) Do a search in Splunk for:
index=* | table _time sourcetype _raw
You should see correct time, sourcetype should show “mikrotik” and _raw should show data
4c). See that _raw does contain only data and not time and other info. Do a search in Splunk for:
index=* | table  _raw
dns MikroTik: done query: #640030 adservice.google.no 216.58.211.2
dhcp,debug,packet MikroTik:     Client-Id = 01-6C-3B-6B-88-34-3F
firewall,info MikroTik: FI_D_port-test input: in:ether1 out:(unknown 0), src-mac 00:05:00:01:00:01, proto TCP (SYN), 47.118.40.92:52503->92.220.205.91:2376, len 40
If you see date, format of packet from Mikrotik has BDS set or Rsyslog is not setup correctly.
4d). Verify that all files has same user:group (root:root or splunk:splunk if run as non-root user)
4e). Look for error written in file or error in file name. inputs.conf not input.conf
4f). Read trough all steps on how to install if some does not work
4g). License problems.
Not convert license to Free license before 30 days or indexing more than 500MB/day?
The Free license will prevent searching if there are 3 license warnings in a rolling 60 day window. If that happens, Splunk Free continues to index your data but disables search functionality. You will regain search when you are below 3 license violation warnings in a 60 day period. See About license violations.
How to solve this+
- Convert to free and wait 30 days if you did not convert it.
- Passing 3 times? Reduce license <500MB and wait 60 days.
- Reintall Splunk
- Get a Free 10GB/day developer license ( https://dev.splunk.com/enterprise/dev_license )
4h) Limit inout. Data comes from two sources in Splunk.
- The log setup. DNS and other stuff. To remove DNS change to
/system logging add action=logserver prefix=MikroTik topics=!debug,!packet,!snmp,!dns
- From the logging script: Data_to_Splunk_using_Syslog
Change true to false each block you like to stop.
4i) 1. You see you get Duplicate Values under host. This may be that you did change name on one device ore have multiple host with same name.
Install Lookup Editor (a Splunk addon app) in Splunk if you do not already have done. Got to Apps → Lookup Editor, select device_kvstore and open it. Remove the duplicate/old items.
4j) Make sure you not have setup BSD syslog. System->Logging->Action->Logserver->Make sure BSD are not selected.
4k) Make sure time are correct on the router. NTP running and connected to a server.
4x). Still problems: ask here ![]()