@jotne
on request ![]()
remove
@jotne
on request ![]()
remove
Everything looks correct.
Last test:
index=*
sourcetype=mikrotik
module=dhcp
host="*"
| rex "Parameter-List = (?<ParameterList>.*)"
| makemv delim="," ParameterList
| eval identity=coalesce(identity,host)
| transaction host startswith="eventtype=dhcp_received_request" endswith="eventtype=dhcp_domain_server" maxspan=1s
| stats  count as Num_Hits values(*) as * latest(_time) as last_time by chaddr
If possible, I can log inn to your Splunk and see directly. (post your email or another form for contact)
removed
@Jotne, I’ve updated to 7.4.1 and now indeed there is more information in each of the FW-logging lines.
Does you updated REGEX handles this? It seems to only handle “connection-state” ?
Looking at a typical firewall-log rule now :
IP4-FWD-SHELLY-DROP forward: in:Bridge-LAN out:ISP, connection-mark:ALL_UP_CONN connection-state:new src-mac 98:cd:ac:1f:36:3c, proto TCP (SYN), 172.29.45.25:18233->23.251.142.183:80, len 44
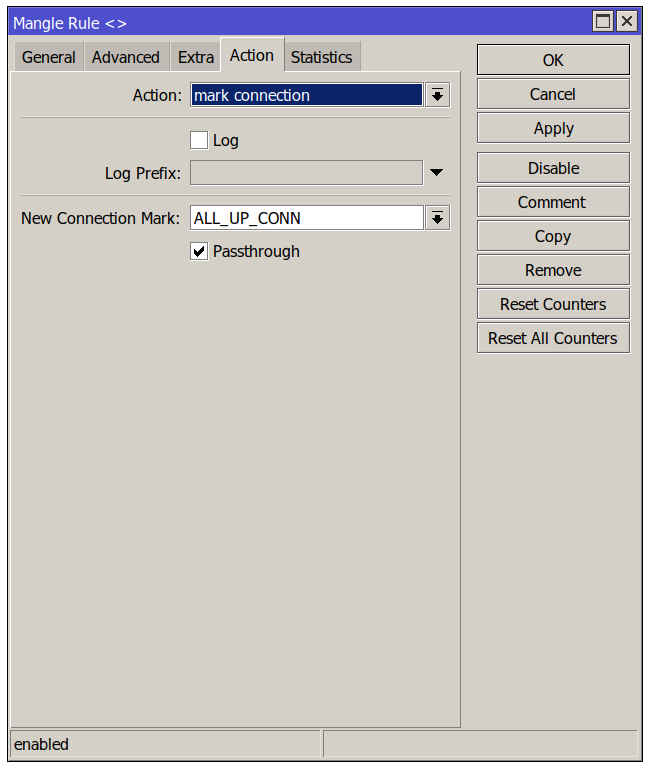
So now I’m getting a connection-mark and connection-state fields. I indeed apply this marker in traffic coming using a mangle-rule
The “connection-mark” is NOT present in each of the logging lines, ALL of them have the “connection-state” value
I need a lot of firewall logs to make sure script does not break. So will have a look at it.
@Mikrotik: Where in the change logs does it mention that the log format has changed?
@jvanhambelgium
Can you give me some example firewall logs? And how do you mark some packet?
In addition, I’ve checked both mangle-rules.
I do not have specific “logging” enabled on these rules btw.
17:12:34 firewall,info IP4-FWD-UNIFI-DROP forward: in:Bridge-LAN out:ISP, connection-mark:ALL_UP_CONN connection-state:new src-mac 80:2a:a8:50:b6:41, proto TCP (SYN), 172.29.45.247:38242->34.210.237.89:443, len 60
17:12:35 firewall,info IP4-FWD-UNIFI-DROP forward: in:Bridge-LAN out:ISP, connection-mark:ALL_UP_CONN connection-state:new src-mac 80:2a:a8:50:b6:41, proto TCP (SYN), 172.29.45.247:38242->34.210.237.89:443, len 60
17:12:37 firewall,info IP4-FWD-UNIFI-DROP forward: in:Bridge-LAN out:ISP, connection-mark:ALL_UP_CONN connection-state:new src-mac 80:2a:a8:50:b6:41, proto TCP (SYN), 172.29.45.247:42706->44.236.10.9:443, len 60
17:12:38 firewall,info IP4-FWD-UNIFI-DROP forward: in:Bridge-LAN out:ISP, connection-mark:ALL_UP_CONN connection-state:new src-mac 80:2a:a8:50:b6:41, proto TCP (SYN), 172.29.45.247:42706->44.236.10.9:443, len 60
17:12:38 firewall,info IP4-FWD-UNIFI-DROP forward: in:Bridge-LAN out:ISP, connection-mark:ALL_UP_CONN connection-state:new src-mac 80:2a:a8:50:b6:41, proto TCP (SYN), 172.29.45.247:56604->54.201.115.248:443, len 60
17:12:38 firewall,info IP4-FWD-UNIFI-DROP forward: in:Bridge-LAN out:ISP, connection-mark:ALL_UP_CONN connection-state:new src-mac 80:2a:a8:50:b6:41, proto TCP (SYN), 172.29.45.247:42932->44.241.83.169:443, len 60
18:12:34 firewall,info IP4-FWD-UNIFI-DROP forward: in:Bridge-LAN out:ISP, connection-mark:ALL_UP_CONN connection-state:new src-mac 80:2a:a8:50:b6:41, proto TCP (SYN), 172.29.45.247:43520->44.241.83.169:443, len 60
18:12:35 firewall,info IP4-FWD-UNIFI-DROP forward: in:Bridge-LAN out:ISP, connection-mark:ALL_UP_CONN connection-state:new src-mac 80:2a:a8:50:b6:41, proto TCP (SYN), 172.29.45.247:43520->44.241.83.169:443, len 60
18:12:37 firewall,info IP4-FWD-UNIFI-DROP forward: in:Bridge-LAN out:ISP, connection-mark:ALL_UP_CONN connection-state:new src-mac 80:2a:a8:50:b6:41, proto TCP (SYN), 172.29.45.247:57196->54.201.115.248:443, len 60
18:12:38 firewall,info IP4-FWD-UNIFI-DROP forward: in:Bridge-LAN out:ISP, connection-mark:ALL_UP_CONN connection-state:new src-mac 80:2a:a8:50:b6:41, proto TCP (SYN), 172.29.45.247:57196->54.201.115.248:443, len 60
18:12:38 firewall,info IP4-FWD-UNIFI-DROP forward: in:Bridge-LAN out:ISP, connection-mark:ALL_UP_CONN connection-state:new src-mac 80:2a:a8:50:b6:41, proto TCP (SYN), 172.29.45.247:43302->44.236.10.9:443, len 60
18:12:39 firewall,info IP4-FWD-UNIFI-DROP forward: in:Bridge-LAN out:ISP, connection-mark:ALL_UP_CONN connection-state:new src-mac 80:2a:a8:50:b6:41, proto TCP (SYN), 172.29.45.247:38842->34.210.237.89:443, len 60
19:12:34 firewall,info IP4-FWD-UNIFI-DROP forward: in:Bridge-LAN out:ISP, connection-mark:ALL_UP_CONN connection-state:new src-mac 80:2a:a8:50:b6:41, proto TCP (SYN), 172.29.45.247:57808->54.201.115.248:443, len 60
19:12:35 firewall,info IP4-FWD-UNIFI-DROP forward: in:Bridge-LAN out:ISP, connection-mark:ALL_UP_CONN connection-state:new src-mac 80:2a:a8:50:b6:41, proto TCP (SYN), 172.29.45.247:57808->54.201.115.248:443, len 60
19:12:37 firewall,info IP4-FWD-UNIFI-DROP forward: in:Bridge-LAN out:ISP, connection-mark:ALL_UP_CONN connection-state:new src-mac 80:2a:a8:50:b6:41, proto TCP (SYN), 172.29.45.247:44136->44.241.83.169:443, len 60
19:12:38 firewall,info IP4-FWD-UNIFI-DROP forward: in:Bridge-LAN out:ISP, connection-mark:ALL_UP_CONN connection-state:new src-mac 80:2a:a8:50:b6:41, proto TCP (SYN), 172.29.45.247:44136->44.241.83.169:443, len 60
19:12:38 firewall,info IP4-FWD-UNIFI-DROP forward: in:Bridge-LAN out:ISP, connection-mark:ALL_UP_CONN connection-state:new src-mac 80:2a:a8:50:b6:41, proto TCP (SYN), 172.29.45.247:43916->44.236.10.9:443, len 60
19:12:39 firewall,info IP4-FWD-UNIFI-DROP forward: in:Bridge-LAN out:ISP, connection-mark:ALL_UP_CONN connection-state:new src-mac 80:2a:a8:50:b6:41, proto TCP (SYN), 172.29.45.247:39456->34.210.237.89:443, len 60
20:12:34 firewall,info IP4-FWD-UNIFI-DROP forward: in:Bridge-LAN out:ISP, connection-mark:ALL_UP_CONN connection-state:new src-mac 80:2a:a8:50:b6:41, proto TCP (SYN), 172.29.45.247:58424->54.201.115.248:443, len 60
20:12:35 firewall,info IP4-FWD-UNIFI-DROP forward: in:Bridge-LAN out:ISP, connection-mark:ALL_UP_CONN connection-state:new src-mac 80:2a:a8:50:b6:41, proto TCP (SYN), 172.29.45.247:58424->54.201.115.248:443, len 60
20:12:37 firewall,info IP4-FWD-UNIFI-DROP forward: in:Bridge-LAN out:ISP, connection-mark:ALL_UP_CONN connection-state:new src-mac 80:2a:a8:50:b6:41, proto TCP (SYN), 172.29.45.247:44752->44.241.83.169:443, len 60
20:12:38 firewall,info IP4-FWD-UNIFI-DROP forward: in:Bridge-LAN out:ISP, connection-mark:ALL_UP_CONN connection-state:new src-mac 80:2a:a8:50:b6:41, proto TCP (SYN), 172.29.45.247:44752->44.241.83.169:443, len 60
20:12:38 firewall,info IP4-FWD-UNIFI-DROP forward: in:Bridge-LAN out:ISP, connection-mark:ALL_UP_CONN connection-state:new src-mac 80:2a:a8:50:b6:41, proto TCP (SYN), 172.29.45.247:40070->34.210.237.89:443, len 60
20:12:39 firewall,info IP4-FWD-UNIFI-DROP forward: in:Bridge-LAN out:ISP, connection-mark:ALL_UP_CONN connection-state:new src-mac 80:2a:a8:50:b6:41, proto TCP (SYN), 172.29.45.247:44534->44.236.10.9:443, len 60
20:20:27 firewall,info IP4-FWD-UNIFI-DROP forward: in:Bridge-LAN out:ISP, connection-mark:ALL_UP_CONN connection-state:new src-mac 02:11:32:25:51:92, proto TCP (SYN), 172.29.45.239:46828->54.171.230.55:443, len 60
20:20:28 firewall,info IP4-FWD-UNIFI-DROP forward: in:Bridge-LAN out:ISP, connection-mark:ALL_UP_CONN connection-state:new src-mac 02:11:32:25:51:92, proto TCP (SYN), 172.29.45.239:46828->54.171.230.55:443, len 60
20:20:30 firewall,info IP4-FWD-UNIFI-DROP forward: in:Bridge-LAN out:ISP, connection-mark:ALL_UP_CONN connection-state:new src-mac 02:11:32:25:51:92, proto TCP (SYN), 172.29.45.239:46828->54.171.230.55:443, len 60
20:20:35 firewall,info IP4-FWD-UNIFI-DROP forward: in:Bridge-LAN out:ISP, connection-mark:ALL_UP_CONN connection-state:new src-mac 02:11:32:25:51:92, proto TCP (SYN), 172.29.45.239:46828->54.171.230.55:443, len 60
20:20:43 firewall,info IP4-FWD-UNIFI-DROP forward: in:Bridge-LAN out:ISP, connection-mark:ALL_UP_CONN connection-state:new src-mac 02:11:32:25:51:92, proto TCP (SYN), 172.29.45.239:46828->54.171.230.55:443, len 60
20:20:59 firewall,info IP4-FWD-UNIFI-DROP forward: in:Bridge-LAN out:ISP, connection-mark:ALL_UP_CONN connection-state:new src-mac 02:11:32:25:51:92, proto TCP (SYN), 172.29.45.239:46828->54.171.230.55:443, len 60
20:21:27 firewall,info IP4-FWD-UNIFI-DROP forward: in:Bridge-LAN out:ISP, connection-mark:ALL_UP_CONN connection-state:new src-mac 02:11:32:25:51:92, proto TCP (SYN), 172.29.45.239:42310->34.254.182.186:443, len 60
20:21:28 firewall,info IP4-FWD-UNIFI-DROP forward: in:Bridge-LAN out:ISP, connection-mark:ALL_UP_CONN connection-state:new src-mac 02:11:32:25:51:92, proto TCP (SYN), 172.29.45.239:42310->34.254.182.186:443, len 60
20:21:30 firewall,info IP4-FWD-UNIFI-DROP forward: in:Bridge-LAN out:ISP, connection-mark:ALL_UP_CONN connection-state:new src-mac 02:11:32:25:51:92, proto TCP (SYN), 172.29.45.239:42310->34.254.182.186:443, len 60
20:21:34 firewall,info IP4-FWD-UNIFI-DROP forward: in:Bridge-LAN out:ISP, connection-mark:ALL_UP_CONN connection-state:new src-mac 02:11:32:25:51:92, proto TCP (SYN), 172.29.45.239:42310->34.254.182.186:443, len 60
20:21:43 firewall,info IP4-FWD-UNIFI-DROP forward: in:Bridge-LAN out:ISP, connection-mark:ALL_UP_CONN connection-state:new src-mac 02:11:32:25:51:92, proto TCP (SYN), 172.29.45.239:42310->34.254.182.186:443, len 60
20:21:59 firewall,info IP4-FWD-UNIFI-DROP forward: in:Bridge-LAN out:ISP, connection-mark:ALL_UP_CONN connection-state:new src-mac 02:11:32:25:51:92, proto TCP (SYN), 172.29.45.239:42310->34.254.182.186:443, len 60
20:22:27 firewall,info IP4-FWD-UNIFI-DROP forward: in:Bridge-LAN out:ISP, connection-mark:ALL_UP_CONN connection-state:new src-mac 02:11:32:25:51:92, proto TCP (SYN), 172.29.45.239:40986->54.247.62.1:443, len 60
20:22:28 firewall,info IP4-FWD-UNIFI-DROP forward: in:Bridge-LAN out:ISP, connection-mark:ALL_UP_CONN connection-state:new src-mac 02:11:32:25:51:92, proto TCP (SYN), 172.29.45.239:40986->54.247.62.1:443, len 60
20:22:30 firewall,info IP4-FWD-UNIFI-DROP forward: in:Bridge-LAN out:ISP, connection-mark:ALL_UP_CONN connection-state:new src-mac 02:11:32:25:51:92, proto TCP (SYN), 172.29.45.239:40986->54.247.62.1:443, len 60
20:22:35 firewall,info IP4-FWD-UNIFI-DROP forward: in:Bridge-LAN out:ISP, connection-mark:ALL_UP_CONN connection-state:new src-mac 02:11:32:25:51:92, proto TCP (SYN), 172.29.45.239:40986->54.247.62.1:443, len 60
20:22:43 firewall,info IP4-FWD-UNIFI-DROP forward: in:Bridge-LAN out:ISP, connection-mark:ALL_UP_CONN connection-state:new src-mac 02:11:32:25:51:92, proto TCP (SYN), 172.29.45.239:40986->54.247.62.1:443, len 60
20:22:59 firewall,info IP4-FWD-UNIFI-DROP forward: in:Bridge-LAN out:ISP, connection-mark:ALL_UP_CONN connection-state:new src-mac 02:11:32:25:51:92, proto TCP (SYN), 172.29.45.239:40986->54.247.62.1:443, len 60
20:23:27 firewall,info IP4-FWD-UNIFI-DROP forward: in:Bridge-LAN out:ISP, connection-mark:ALL_UP_CONN connection-state:new src-mac 02:11:32:25:51:92, proto TCP (SYN), 172.29.45.239:43302->34.243.160.129:443, len 60
20:23:28 firewall,info IP4-FWD-UNIFI-DROP forward: in:Bridge-LAN out:ISP, connection-mark:ALL_UP_CONN connection-state:new src-mac 02:11:32:25:51:92, proto TCP (SYN), 172.29.45.239:43302->34.243.160.129:443, len 60
20:23:30 firewall,info IP4-FWD-UNIFI-DROP forward: in:Bridge-LAN out:ISP, connection-mark:ALL_UP_CONN connection-state:new src-mac 02:11:32:25:51:92, proto TCP (SYN), 172.29.45.239:43302->34.243.160.129:443, len 60
20:23:34 firewall,info IP4-FWD-UNIFI-DROP forward: in:Bridge-LAN out:ISP, connection-mark:ALL_UP_CONN connection-state:new src-mac 02:11:32:25:51:92, proto TCP (SYN), 172.29.45.239:43302->34.243.160.129:443, len 60
20:23:43 firewall,info IP4-FWD-UNIFI-DROP forward: in:Bridge-LAN out:ISP, connection-mark:ALL_UP_CONN connection-state:new src-mac 02:11:32:25:51:92, proto TCP (SYN), 172.29.45.239:43302->34.243.160.129:443, len 60
20:23:59 firewall,info IP4-FWD-UNIFI-DROP forward: in:Bridge-LAN out:ISP, connection-mark:ALL_UP_CONN connection-state:new src-mac 02:11:32:25:51:92, proto TCP (SYN), 172.29.45.239:43302->34.243.160.129:443, len 60
20:24:27 firewall,info IP4-FWD-UNIFI-DROP forward: in:Bridge-LAN out:ISP, connection-mark:ALL_UP_CONN connection-state:new src-mac 02:11:32:25:51:92, proto TCP (SYN), 172.29.45.239:33074->54.217.10.153:443, len 60
20:24:28 firewall,info IP4-FWD-UNIFI-DROP forward: in:Bridge-LAN out:ISP, connection-mark:ALL_UP_CONN connection-state:new src-mac 02:11:32:25:51:92, proto TCP (SYN), 172.29.45.239:33074->54.217.10.153:443, len 60
20:24:30 firewall,info IP4-FWD-UNIFI-DROP forward: in:Bridge-LAN out:ISP, connection-mark:ALL_UP_CONN connection-state:new src-mac 02:11:32:25:51:92, proto TCP (SYN), 172.29.45.239:33074->54.217.10.153:443, len 60
20:24:34 firewall,info IP4-FWD-UNIFI-DROP forward: in:Bridge-LAN out:ISP, connection-mark:ALL_UP_CONN connection-state:new src-mac 02:11:32:25:51:92, proto TCP (SYN), 172.29.45.239:33074->54.217.10.153:443, len 60
20:24:43 firewall,info IP4-FWD-UNIFI-DROP forward: in:Bridge-LAN out:ISP, connection-mark:ALL_UP_CONN connection-state:new src-mac 02:11:32:25:51:92, proto TCP (SYN), 172.29.45.239:33074->54.217.10.153:443, len 60
20:24:59 firewall,info IP4-FWD-UNIFI-DROP forward: in:Bridge-LAN out:ISP, connection-mark:ALL_UP_CONN connection-state:new src-mac 02:11:32:25:51:92, proto TCP (SYN), 172.29.45.239:33074->54.217.10.153:443, len 60
This should do:
^firewall,info\s[Mm]ikro[Tt]ik:\s(?:(?<rule>[^:]+)\s)?(?<chain>.+?):\sin:(?<in_if>.*?)\sout:(?<out_if>[^,]+),(?:\sconnection-mark:(?<connection_mark>\S+))?(?:\sconnection-state:(?<connection_state>\S+))?(?:\ssrc-mac\s(?<src_mac>[^,]+),)?\sproto\s(?<protocol>\S+)(?:\s\((?<flag>[^\)]*)\))?,\s\[?(?<src_ip>(?:\d+\.\d+\.\d+\.\d+|[^\]]+))\]?(?::(?<src_port>[^-]+))?->\[?(?<dest_ip>(?:\d+\.\d+\.\d+\.\d+|[^\]]+))(?:\]?:(?<dest_port>[^,]+))?,\s(?:NAT[^,]+, )?(?:prio\s(?<prio>[^,]+),\s)?len\s(?<length>\d+)
I updated this one too, works fine on 7.4 logging
I confirm the new regex does its magic on 7.4.1 too.
Thanks!
You are welcome. It will be added to upcoming 3.7. You can just edit the firewall dashboard and cut/past and save with this, to get the new firewall fields shown:
<form version="3.7" theme="dark">
<label>MikroTik Firewall Rules</label>
<description>Data collected from Syslog</description>
<!--Version
2.4.1 Fixed error with src_port in dest_ip dropdown
2.5.1 Changed to "Coalesce"
2.6.1 Sourt by count
2.7.1 Cleaned searh
2.7.2 useother=false to remove base level
2.7.3 Added counters
2.8.1 Added "output" color
2.9.0 Added identity
3.0.0 Fixed missing identity
3.1.0 Added Free text search
3.2.0 Added source port
3.3.0 Fixed missing City
3.3.1 Change from table to fields
3.4.0 Fixed missing color
3.7.0 Added dashboard version
3.7.1 Added connection state/mark
######################################################
#
# Mikrotik Add-On for Splunk
#
# Copyright (C) 2022 Jotne
# All Rights Reserved
#
######################################################
-->
<search id="base_search">
<query>
`index`
sourcetype=mikrotik
module=firewall
$Free$
host="$host$"
rule="$rule$"
chain="$chain$"
in_if="$in_if$"
out_if="$out_if$"
src_mac="$src_mac$"
protocol="$protocol$"
src_ip="$src_ip$"
src_port="$src_port$"
dest_ip="$dest_ip$"
dest_port="$dest_port$"
| fillnull value="-"
| search
connection_state="$connection_state$"
connection_mark="$connection_mark$"
| eval host_name=coalesce(identity,host)
| fields _time host rule chain in_if out_if src_mac protocol src_ip dest_ip src_port dest_port host_name connection_state connection_mark
</query>
</search>
<search base="base_search">
<query>
| stats dc(dest_port) as count1 dc(src_ip) as count2 count as count3
</query>
<finalized>
<set token="DestPort_count">$result.count1$</set>
<set token="SrcIP_count">$result.count2$</set>
<set token="Total_count">$result.count3$</set>
</finalized>
</search>
<fieldset submitButton="false">
<input type="time">
<label>Time Range</label>
<default>
<earliest>-15m</earliest>
<latest>now</latest>
</default>
</input>
<input type="dropdown" token="host">
<label>Host</label>
<search base="base_search">
<query>
| eval data=host
| stats count by data host_name
| eval info=host_name."-".data." (".count.")"
| sort -count
</query>
</search>
<choice value="*">All</choice>
<default>*</default>
<fieldForLabel>info</fieldForLabel>
<fieldForValue>data</fieldForValue>
</input>
<input type="dropdown" token="rule">
<label>Rule</label>
<search base="base_search">
<query>
| eval data=rule
| stats count by data
| eval info=data." (".count.")"
| sort -count
</query>
</search>
<choice value="*">All</choice>
<default>*</default>
<fieldForLabel>info</fieldForLabel>
<fieldForValue>data</fieldForValue>
</input>
<input type="dropdown" token="chain">
<label>Chain</label>
<search base="base_search">
<query>
| eval data=chain
| stats count by data
| eval info=data." (".count.")"
| sort -count
</query>
</search>
<choice value="*">All</choice>
<default>*</default>
<fieldForLabel>info</fieldForLabel>
<fieldForValue>data</fieldForValue>
</input>
<input type="dropdown" token="in_if">
<label>Input Interface</label>
<search base="base_search">
<query>
| eval data=in_if
| stats count by data
| eval info=data." (".count.")"
| sort -count
</query>
</search>
<choice value="*">All</choice>
<default>*</default>
<fieldForLabel>info</fieldForLabel>
<fieldForValue>data</fieldForValue>
</input>
<input type="dropdown" token="out_if">
<label>Output Interface</label>
<search base="base_search">
<query>
| eval data=out_if
| stats count by data
| eval info=data." (".count.")"
| sort -count
</query>
</search>
<choice value="*">All</choice>
<default>*</default>
<fieldForLabel>info</fieldForLabel>
<fieldForValue>data</fieldForValue>
</input>
<input type="dropdown" token="src_mac">
<label>Source MAC</label>
<search base="base_search">
<query>
| eval data=src_mac
| stats count by data
| eval info=data." (".count.")"
| sort -count
</query>
</search>
<choice value="*">All</choice>
<default>*</default>
<fieldForLabel>info</fieldForLabel>
<fieldForValue>data</fieldForValue>
</input>
<input type="dropdown" token="protocol">
<label>Protocol</label>
<search base="base_search">
<query>
| eval data=protocol
| stats count by data
| eval info=data." (".count.")"
| sort -count
</query>
</search>
<choice value="*">All</choice>
<default>*</default>
<fieldForLabel>info</fieldForLabel>
<fieldForValue>data</fieldForValue>
</input>
<input type="dropdown" token="src_ip">
<label>Source IP</label>
<search base="base_search">
<query>
| eval data=src_ip
| stats count by data
| eval info=data." (".count.")"
| sort -count
</query>
</search>
<choice value="*">All</choice>
<default>*</default>
<fieldForLabel>info</fieldForLabel>
<fieldForValue>data</fieldForValue>
</input>
<input type="dropdown" token="src_port">
<label>Source port</label>
<search base="base_search">
<query>
| eval data=src_port
| stats count by data
| eval info=data." (".count.")"
| sort -count
</query>
</search>
<choice value="*">All</choice>
<default>*</default>
<fieldForLabel>info</fieldForLabel>
<fieldForValue>data</fieldForValue>
</input>
<input type="dropdown" token="dest_ip">
<label>Destination IP</label>
<search base="base_search">
<query>
| eval data=dest_ip
| stats count by data
| eval info=data." (".count.")"
| sort -count
</query>
</search>
<choice value="*">All</choice>
<default>*</default>
<fieldForLabel>info</fieldForLabel>
<fieldForValue>data</fieldForValue>
</input>
<input type="dropdown" token="dest_port">
<label>Destination port</label>
<search base="base_search">
<query>
| eval data=dest_port
| stats count by data
| eval info=data." (".count.")"
| sort -count
</query>
</search>
<choice value="*">All</choice>
<default>*</default>
<fieldForLabel>info</fieldForLabel>
<fieldForValue>data</fieldForValue>
</input>
<input type="dropdown" token="connection_state">
<label>Connection State</label>
<search base="base_search">
<query>
| eval data=connection_state
| stats count by data
| eval info=data." (".count.")"
| sort -count
</query>
</search>
<choice value="*">All</choice>
<default>*</default>
<fieldForLabel>info</fieldForLabel>
<fieldForValue>data</fieldForValue>
</input>
<input type="dropdown" token="connection_mark">
<label>Connection Mark</label>
<search base="base_search">
<query>
| eval data=connection_mark
| stats count by data
| eval info=data." (".count.")"
| sort -count
</query>
</search>
<choice value="*">All</choice>
<default>*</default>
<fieldForLabel>info</fieldForLabel>
<fieldForValue>data</fieldForValue>
</input>
<input type="text" token="Free">
<label>Free Text</label>
<default>*</default>
</input>
</fieldset>
<row>
<panel>
<chart>
<title>src_ip #$SrcIP_count$</title>
<search base="base_search">
<query>
| timechart count by src_ip limit=20 useother=false
</query>
</search>
<option name="charting.axisTitleX.visibility">collapsed</option>
<option name="charting.chart">column</option>
<option name="charting.chart.stackMode">stacked</option>
<option name="charting.drilldown">none</option>
</chart>
</panel>
<panel>
<chart>
<title>dest_port #$DestPort_count$</title>
<search base="base_search">
<query>
| timechart count by dest_port limit=20 useother=false
</query>
</search>
<option name="charting.axisTitleX.visibility">collapsed</option>
<option name="charting.chart">column</option>
<option name="charting.chart.stackMode">stacked</option>
<option name="charting.drilldown">none</option>
</chart>
</panel>
</row>
<row>
<panel>
<table>
<title>Number of entries #$Total_count$</title>
<search base="base_search">
<query>
| iplocation src_ip
| eval City=if(City="","Unknown",City)
| rex field=rule "^(?<type>.)(?<dir>.)_(?<act>.+?)_"
| table _time type dir act rule chain in_if out_if src_mac protocol src_ip src_port dest_ip dest_port connection_state connection_mark City Country
| sort -_time</query>
</search>
<option name="count">50</option>
<option name="wrap">false</option>
<format type="color" field="chain">
<colorPalette type="map">{"input":#F8BE34,"dstnat":#6DB7C6,"forward":#53A051,"output":#006D9C,"srcnat":#AF575A,"prerouting":#F1813F}</colorPalette>
</format>
<format type="color" field="protocol">
<colorPalette type="map">{"47":#006D9C,"TCP":#65A637,"UDP":#D93F3C,"ICMP":#F8BE34}</colorPalette>
</format>
<format type="color" field="rule">
<colorPalette type="sharedList"></colorPalette>
<scale type="sharedCategory"></scale>
</format>
<format type="color" field="in_if">
<colorPalette type="sharedList"></colorPalette>
<scale type="sharedCategory"></scale>
</format>
<format type="color" field="out_if">
<colorPalette type="sharedList"></colorPalette>
<scale type="sharedCategory"></scale>
</format>
<format type="color" field="src_ip">
<colorPalette type="sharedList"></colorPalette>
<scale type="sharedCategory"></scale>
</format>
<format type="color" field="src_port">
<colorPalette type="sharedList"></colorPalette>
<scale type="sharedCategory"></scale>
</format>
<format type="color" field="dest_ip">
<colorPalette type="sharedList"></colorPalette>
<scale type="sharedCategory"></scale>
</format>
<format type="color" field="dest_port">
<colorPalette type="sharedList"></colorPalette>
<scale type="sharedCategory"></scale>
</format>
<format type="color" field="City">
<colorPalette type="sharedList"></colorPalette>
<scale type="sharedCategory"></scale>
</format>
<format type="color" field="Country">
<colorPalette type="sharedList"></colorPalette>
<scale type="sharedCategory"></scale>
</format>
<format type="color" field="src_mac">
<colorPalette type="sharedList"></colorPalette>
<scale type="sharedCategory"></scale>
</format>
<format type="color" field="type">
<colorPalette type="map">{"F":#53A051,"R":#006D9C,"N":#F8BE34,"M":#AF575A}</colorPalette>
</format>
<format type="color" field="act">
<colorPalette type="map">{"D":#DC4E41,"RE":#DC4E41,"T":#DC4E41,"DE":#62B3B2,"M":#006D9C,"J":#F8BE34,"AS":#5A4575,"A":#53A051,"L":#FFFFFF}</colorPalette>
</format>
<format type="color" field="dir">
<colorPalette type="map">{"I":#F8BE34,"F":#53A051,"O":#B6C75A,"D":#53A051,"X":#006D9C,"S":#AF575A,"P":#F1813F}</colorPalette>
</format>
<format type="color" field="connection_state">
<colorPalette type="sharedList"></colorPalette>
<scale type="sharedCategory"></scale>
</format>
<format type="color" field="connection_mark">
<colorPalette type="sharedList"></colorPalette>
<scale type="sharedCategory"></scale>
</format>
</table>
</panel>
</row>
</form>
@Jotne: thank you very much for the good work.
In my installation everything works as described except the MirkoTik Wifi connection dashboard. I have 2 MikroTik systems with wireless interfaces (no CAPSMan). Further I activated “:local Wireless true” in the collection script. The dashboard Wifi Signal Strength is correctly filled but not the connection dashboard. Do you have an idea? Is the part of the script (registration-table etc.) just for the Signal Strength dashboard. Is the other dashboard filled based on syslog information (the association and connection attempts exists in my splunk installation)?
Regarding Splunk: do you have a good idea to handle authentication and event-messaging (are there good alternatives except buying a commercial license?)
Thanks in advance!
Do you see any line with run this search:
index=* connected signal strength
You should get some like this:
wireless,info MikroTik: 74:aa:09:53:A7:E9@wlan1: connected, signal strength -67
wireless,info MikroTik: 74:aa:09:53:A7:E9@wlan1: connected, signal strength -77
wireless,info MikroTik: 6C:aa:D6:C2:4E:03@wlan2: connected, signal strength -82
wireless,info MikroTik: 62:aa:61:F1:2E:9B@wlan1: connected, signal strength -76
Regarding Splunk: do you have a good idea to handle authentication and event-messaging (are there good alternatives except buying a commercial license?)
Do you mean how to add user/password login to Splunk, when you only have free license?
I solved this by using basic authentication function in HAProxy (a free reverse proxy)
Thanks.
Yes, I can see results based on this search. I also see the results in the “mikrotik_wifi_strength” dashboard, but I can not see data in the mikrotik_wifi_connection dashboard.
Example:
2022-08-22T18:07:11.648980+02:00 <13>wireless,info MikroTik: AA:BB:DE:AD:BE:EF@wlan4: connected, signal strength -79
The filter looks for:
eventtype=wifi_connected OR eventtype=wifi_disconnected_*
Strange.
Ok, I will also add a reverse proxy with a basic-auth - better than nothing.
Thanks for your support.
This is some that is fixed in upcoming 3.7
Fixed splunk read from rsyslog data
Replace props.conf with this:
[source::udp:514]
TRUNCATE = 10000
TRANSFORMS-dns = remove_dns_query,remove_dns_answer
TRANSFORMS-force_mikrotik = force_mikrotik_st,force_mikrotik_ix

[syslog]
TRUNCATE = 10000
TRANSFORMS-dns = remove_dns_query,remove_dns_answer
TRANSFORMS-force_mikrotik = force_mikrotik_st,force_mikrotik_ix

[rsyslog]
TRUNCATE = 10000
TRANSFORMS-dns = remove_dns_query,remove_dns_answer
TRANSFORMS-force_mikrotik = force_mikrotik_st,force_mikrotik_ix
SEDCMD-clean_header = s/\d{4}-\d\d-\d\d.*?<\d+>//
SEDCMD-clean_end = s/#015$//

[mikrotik]
MAX_TIMESTAMP_LOOKAHEAD = 23
SHOULD_LINEMERGE = false
DATETIME_CONFIG = CURRENT


EXTRACT-mikrotik_bridge = bridge,stp (?:\w+:\s)?(?<int>\S+)\s(?<status>\w+)

EXTRACT-mikrotik_caps-man1 = script=caps-man name=(?<ap>.*?) counter=(?<counter>\d+)
EXTRACT-mikrotik_caps-man2 = caps,(?:info|debug).*?(?<mac>(?:\w\w:){5}\w\w)@(?<ap>.*?) (?:(?:dis)?connected|rejected), (?<reason>.*?)(?:\(\d+\)| (?<strength>-\d+))?$
EXTRACT-mikrotik_caps-man_frequency = caps,(?:info|debug).*?: (?<ap>[^:]+): selected channel (?<frequency>\d+)\/(?<widt>\d+)?-?(?<extensionChannel>\w+)\/(?<standard>[^\/]+)\/\S+\((?<dBm>\d+)dBm

EXTRACT-mikrotik_dhcp_vlan = dhcp,debug.*: (?<dhcp_server>.*?) received request

EXTRACT-mikrotik_dns_src = dns,packet.*from\s(?<src_ip>[^:]+):(?<src_port>\d+)
EXTRACT-mikrotik_dns_site = dns,packet.*question:\s(?<site1>[^:]+):(?<site_type>[^:]+):(?<site_direction>[^:]+)
EXTRACT-mikrotik_dns_record_1 = dns.*query from\s(?<src_ip>[^:]+):\s#(?<ses_id>\d+)\s(?<site>\S+)\.\s(?<record_type>\S+)
EXTRACT-mikrotik_dns_record_2 = dns,packet.*\s<(?<site2>[^:]+):(?<record_type>[^:]+):(?<record_id>[^=]+)=(?<record_info>[^>]+)
EXTRACT-mikrotik_dns_record_3 = dns.* done query:\s#(?<ses_id>\d+)\s(?<site>\S+)\s(?<dest_ip>\S+)

# EXTRACT-mikrotik_firewall_info1 = firewall,info\s[Mm]ikro[Tt]ik:\s(?:(?<rule>[^:]+)\s)?(?<chain>.+?):\sin:(?<in_if>.*?)\sout:(?<out_if>[^,]+),(?:\ssrc-mac\s(?<src_mac>[^,]+),)?\sproto\s(?<protocol>\S+)(?:\s\((?<flag>[^\)]*)\))?,\s\[?(?<src_ip>(?:\d+\.\d+\.\d+\.\d+|[^\]]+))\]?(?::(?<src_port>[^-]+))?->\[?(?<dest_ip>(?:\d+\.\d+\.\d+\.\d+|[^\]]+))(?:\]?:(?<dest_port>[^,]+))?,\s(?:NAT.*)?len\s(?<length>\d+)
EXTRACT-mikrotik_firewall_info1 = ^firewall,info\s[Mm]ikro[Tt]ik:\s(?:(?<rule>[^:]+)\s)?(?<chain>.+?):\sin:(?<in_if>.*?)\sout:(?<out_if>[^,]+),(?:\sconnection-mark:(?<connection_mark>\S+))?(?:\sconnection-state:(?<connection_state>\S+))?(?:\ssrc-mac\s(?<src_mac>[^,]+),)?\sproto\s(?<protocol>\S+)(?:\s\((?<flag>[^\)]*)\))?,\s\[?(?<src_ip>(?:\d+\.\d+\.\d+\.\d+|[^\]]+))\]?(?::(?<src_port>[^-]+))?->\[?(?<dest_ip>(?:\d+\.\d+\.\d+\.\d+|[^\]]+))(?:\]?:(?<dest_port>[^,]+))?,\s(?:NAT[^,]+, )?(?:prio\s(?<prio>[^,]+),\s)?len\s(?<length>\d+)


EXTRACT-mikrotik_hotspot_user_scrip_mac = hotspot[^:]+:\s(?<user>\S+)\s\(?:(?:(?<src_ip>\d+\.\d+\.\d+\.\d+)|(?<mac>(?:..:){5}..))\)
EXTRACT-mikrotik_hotspot_user_login_type = hotspot.*trying to log in by (?<log_in_by>\S+)

EXTRACT-mikrotik_interface = interface,info.*? (?<int>\S+) link (?<change>\S+)(?: \(speed (?<speed>[^,]+), (?<duplex>\S+) duplex)?

EXTRACT-mikrotik_ip_accounting = ^\d+\s+(?<src_ip>\d+\.\d+\.\d+\.\d+)\s+(?<dest_ip>\d+\.\d+\.\d+\.\d+)\s+(?<packet>\d+)\s+(?<byte>\d+)(?:\s+(?<src_user>\S+)\s+(?<dest_user>\S+))?

EXTRACT-mikrotik_ipsec_ip_1 = ipsec,error.*? (?<src_ip>\d+\.\d+\.\d+\.\d+) (?:failed to|parsing|phase1)
EXTRACT-mikrotik_ipsec_ip_2 = Invalid exchange type \d+ from\s(?<src_ip>[^[]+)
EXTRACT-mikrotik_ipsec_ip_3 = ipsec.*? not registered for (?<src_ip>[^[]+)
EXTRACT-mikrotik_ipsec_ip_4 = ipsec,error.*? phase1 negotiation failed.*?(?<dest_ip>\d+\.\d+\.\d+\.\d+).*?>(?<src_ip>\d+\.\d+\.\d+\.\d+)

EXTRACT-mikrotik_l2tp_src_ip = first L2TP UDP packet received from\s(?<src_ip>\S+)
EXTRACT-mikrotik_l2tp_user1 = l2tp,ppp,info.*? (?<user>\S+) logged
EXTRACT-mikrotik_l2tp_user2 = l2tp,ppp,info.*? <l2tp-(?<user>[^>]+)>:\s

EXTRACT-mikrotik_modul_status = ^(?:.*?<\d+>)?(?<module>[^\s,]+),?(?<info1>.*?)(?:,(?<severity>(?:debug|info|warning|error|critical)))?(?:,(?<info2>(?:packet|account|state|calc|event)))?\s

EXTRACT-mikrotik_pppoe = pppoe.*?(?<user>\S+) logged (?<logged>[^,]+), (?<src_ip>\d+\.\d+\.\d+\.\d+)?(?:(?<time>\d+) (?<rcv_bytes>\d+) (?<sent_bytes>\d+) (?<rcv_packets>\d+) (?<sent_packet>\d+))?

EXTRACT-mikrotik_pptp_src_ip = TCP connection established from\s(?<src_ip>\S+)

EXTRACT-mikrotik_session = (?<user>\S+)\slogged out, (?<seconds>\d+) (?<bytes_in>\d+) (?<bytes_out>\d+) (?<packets_in>\d+) (?<packets_out>\d+)

EXTRACT-mikrotik_ssh_user = ssh,debug .*(?:user|auth req):\s(?<user>\S+)\s

EXTRACT-mikrotik_system_action = system,info .*:\s(?<change>.*)\s(?<action>[\S]+)\sby\s(?<user>\S+)
EXTRACT-mikrotik_system_info = system,info,account .*user\s(?<user>\S+)\slogged in from\s(?<user_ip>\S+)\svia\s(?<system>\S+)

EXTRACT-mikrotik_upnp_service = script,info .*nextid.*: (?<service>[^;]+);

EXTRACT-mikrotik_user_logged_in_1 = (?<user>\S+)\slogged (?:in(?:,| )|out (?:from)?)(?: (?<user_ip>\S+))?(?:\s?via\s(?<system>\S+))?
EXTRACT-mikrotik_user_logged_in_2 = login failure for user\s(?<user>\S+)\sfrom\s(?<user_ip>\S+)(?:\svia\s(?<system>\S+))?
EXTRACT-mikrotik_user_logged_in_3 = user\s(?<user>\S+)\sauthentication

EXTRACT-mikrotik_web-proxy = web-proxy,account\s\S+\s(?<src_ip>\d+\.\d+\.\d+\.\d+)\s(?<status>\w+)(?:\s(?<id>\d+))?\s(?<url>\S+)

EXTRACT-mikrotik_wireless_1 = wireless,info (?:\w+:\s)?(?<mac>\w\w:\w\w:\w\w:\w\w:\w\w:\w\w)@(?<int>[^:]+):\s(?<status>\w+)(?:, signal strength\s(?<strength>\S+))?
EXTRACT-mikrotik_wireless_strenght = signal-strength=(?<signal_strength>-\d+).*tx-rate=(?<tx_rate>[\d.]+)

EXTRACT-mikrotik_wireguard_error = wireguard,debug\s\S+\s(?<interface>\S+)\s(?<public_key>\S+)\s(?<error>.*?)\s\(


EVAL-channel = (frequency-if(match(standard,"a"),5000,2407))/5
EVAL-src_port = if(isnull(src_port) AND module=="firewall","na",src_port)
EVAL-src_mac = if(isnull(src_mac) AND module=="firewall","na",src_mac)
EVAL-dest_port = if(isnull(dest_port) AND module=="firewall","na",dest_port)
EVAL-rule = case(isnull(rule) AND module=="firewall","missing_or_too_long_Prefix_max_20_characters",len(rule)>20 AND module=="firewall","too_long_Prefix_max_20_characters",1=1,rule)

LOOKUP-automatic_device_table = device_table host

LOOKUP-automatic_dhcp_table = dhcp_table mac OUTPUTNEW
Great @Jotne - it works ![]()
Thanks. Hope I can contribute something good in the future.
Since I renewed the props.conf I can’t see the firewall logs anymore. They were there before the change - do you have an idea?
I guess you have upgrade the router as well. There are new connection state/mark fields in 7.4+ logs. When I am done testing som Routing protocol BGP/OSPF, I will release next version. You can try this dashboard and see if it works:
<form version="3.7" theme="dark">
<label>MikroTik Firewall Rules</label>
<description>Data collected from Syslog</description>
<!--Version
2.4.1 Fixed error with src_port in dest_ip dropdown
2.5.1 Changed to "Coalesce"
2.6.1 Sourt by count
2.7.1 Cleaned searh
2.7.2 useother=false to remove base level
2.7.3 Added counters
2.8.1 Added "output" color
2.9.0 Added identity
3.0.0 Fixed missing identity
3.1.0 Added Free text search
3.2.0 Added source port
3.3.0 Fixed missing City
3.3.1 Change from table to fields
3.4.0 Fixed missing color
3.7.0 Added dashboard version
3.7.1 Added connection state/mark
######################################################
#
# Mikrotik Add-On for Splunk
#
# Copyright (C) 2022 Jotne
# All Rights Reserved
#
######################################################
-->
<search id="base_search">
<query>
`index`
sourcetype=mikrotik
module=firewall
$Free$
host="$host$"
rule="$rule$"
chain="$chain$"
in_if="$in_if$"
out_if="$out_if$"
src_mac="$src_mac$"
protocol="$protocol$"
src_ip="$src_ip$"
src_port="$src_port$"
dest_ip="$dest_ip$"
dest_port="$dest_port$"
| fillnull value="-"
| search
connection_state="$connection_state$"
connection_mark="$connection_mark$"
| eval host_name=coalesce(identity,host)
| fields _time host rule chain in_if out_if src_mac protocol src_ip dest_ip src_port dest_port host_name connection_state connection_mark
</query>
</search>
<search base="base_search">
<query>
| stats dc(dest_port) as count1 dc(src_ip) as count2 count as count3
</query>
<finalized>
<set token="DestPort_count">$result.count1$</set>
<set token="SrcIP_count">$result.count2$</set>
<set token="Total_count">$result.count3$</set>
</finalized>
</search>
<fieldset submitButton="false">
<input type="time">
<label>Time Range</label>
<default>
<earliest>-15m</earliest>
<latest>now</latest>
</default>
</input>
<input type="dropdown" token="host">
<label>Host</label>
<search base="base_search">
<query>
| eval data=host
| stats count by data host_name
| eval info=host_name."-".data." (".count.")"
| sort -count
</query>
</search>
<choice value="*">All</choice>
<default>*</default>
<fieldForLabel>info</fieldForLabel>
<fieldForValue>data</fieldForValue>
</input>
<input type="dropdown" token="rule">
<label>Rule</label>
<search base="base_search">
<query>
| eval data=rule
| stats count by data
| eval info=data." (".count.")"
| sort -count
</query>
</search>
<choice value="*">All</choice>
<default>*</default>
<fieldForLabel>info</fieldForLabel>
<fieldForValue>data</fieldForValue>
</input>
<input type="dropdown" token="chain">
<label>Chain</label>
<search base="base_search">
<query>
| eval data=chain
| stats count by data
| eval info=data." (".count.")"
| sort -count
</query>
</search>
<choice value="*">All</choice>
<default>*</default>
<fieldForLabel>info</fieldForLabel>
<fieldForValue>data</fieldForValue>
</input>
<input type="dropdown" token="in_if">
<label>Input Interface</label>
<search base="base_search">
<query>
| eval data=in_if
| stats count by data
| eval info=data." (".count.")"
| sort -count
</query>
</search>
<choice value="*">All</choice>
<default>*</default>
<fieldForLabel>info</fieldForLabel>
<fieldForValue>data</fieldForValue>
</input>
<input type="dropdown" token="out_if">
<label>Output Interface</label>
<search base="base_search">
<query>
| eval data=out_if
| stats count by data
| eval info=data." (".count.")"
| sort -count
</query>
</search>
<choice value="*">All</choice>
<default>*</default>
<fieldForLabel>info</fieldForLabel>
<fieldForValue>data</fieldForValue>
</input>
<input type="dropdown" token="src_mac">
<label>Source MAC</label>
<search base="base_search">
<query>
| eval data=src_mac
| stats count by data
| eval info=data." (".count.")"
| sort -count
</query>
</search>
<choice value="*">All</choice>
<default>*</default>
<fieldForLabel>info</fieldForLabel>
<fieldForValue>data</fieldForValue>
</input>
<input type="dropdown" token="protocol">
<label>Protocol</label>
<search base="base_search">
<query>
| eval data=protocol
| stats count by data
| eval info=data." (".count.")"
| sort -count
</query>
</search>
<choice value="*">All</choice>
<default>*</default>
<fieldForLabel>info</fieldForLabel>
<fieldForValue>data</fieldForValue>
</input>
<input type="dropdown" token="src_ip">
<label>Source IP</label>
<search base="base_search">
<query>
| eval data=src_ip
| stats count by data
| eval info=data." (".count.")"
| sort -count
</query>
</search>
<choice value="*">All</choice>
<default>*</default>
<fieldForLabel>info</fieldForLabel>
<fieldForValue>data</fieldForValue>
</input>
<input type="dropdown" token="src_port">
<label>Source port</label>
<search base="base_search">
<query>
| eval data=src_port
| stats count by data
| eval info=data." (".count.")"
| sort -count
</query>
</search>
<choice value="*">All</choice>
<default>*</default>
<fieldForLabel>info</fieldForLabel>
<fieldForValue>data</fieldForValue>
</input>
<input type="dropdown" token="dest_ip">
<label>Destination IP</label>
<search base="base_search">
<query>
| eval data=dest_ip
| stats count by data
| eval info=data." (".count.")"
| sort -count
</query>
</search>
<choice value="*">All</choice>
<default>*</default>
<fieldForLabel>info</fieldForLabel>
<fieldForValue>data</fieldForValue>
</input>
<input type="dropdown" token="dest_port">
<label>Destination port</label>
<search base="base_search">
<query>
| eval data=dest_port
| stats count by data
| eval info=data." (".count.")"
| sort -count
</query>
</search>
<choice value="*">All</choice>
<default>*</default>
<fieldForLabel>info</fieldForLabel>
<fieldForValue>data</fieldForValue>
</input>
<input type="dropdown" token="connection_state">
<label>Connection State</label>
<search base="base_search">
<query>
| eval data=connection_state
| stats count by data
| eval info=data." (".count.")"
| sort -count
</query>
</search>
<choice value="*">All</choice>
<default>*</default>
<fieldForLabel>info</fieldForLabel>
<fieldForValue>data</fieldForValue>
</input>
<input type="dropdown" token="connection_mark">
<label>Connection Mark</label>
<search base="base_search">
<query>
| eval data=connection_mark
| stats count by data
| eval info=data." (".count.")"
| sort -count
</query>
</search>
<choice value="*">All</choice>
<default>*</default>
<fieldForLabel>info</fieldForLabel>
<fieldForValue>data</fieldForValue>
</input>
<input type="text" token="Free">
<label>Free Text</label>
<default>*</default>
</input>
</fieldset>
<row>
<panel>
<chart>
<title>src_ip #$SrcIP_count$</title>
<search base="base_search">
<query>
| timechart count by src_ip limit=20 useother=false
</query>
</search>
<option name="charting.axisTitleX.visibility">collapsed</option>
<option name="charting.chart">column</option>
<option name="charting.chart.stackMode">stacked</option>
<option name="charting.drilldown">none</option>
</chart>
</panel>
<panel>
<chart>
<title>dest_port #$DestPort_count$</title>
<search base="base_search">
<query>
| timechart count by dest_port limit=20 useother=false
</query>
</search>
<option name="charting.axisTitleX.visibility">collapsed</option>
<option name="charting.chart">column</option>
<option name="charting.chart.stackMode">stacked</option>
<option name="charting.drilldown">none</option>
</chart>
</panel>
</row>
<row>
<panel>
<table>
<title>Number of entries #$Total_count$</title>
<search base="base_search">
<query>
| iplocation src_ip
| eval City=if(City="","Unknown",City)
| rex field=rule "^(?<type>.)(?<dir>.)_(?<act>.+?)_"
| table _time type dir act rule chain in_if out_if src_mac protocol src_ip src_port dest_ip dest_port connection_state connection_mark City Country
| sort -_time</query>
</search>
<option name="count">50</option>
<option name="wrap">false</option>
<format type="color" field="chain">
<colorPalette type="map">{"input":#F8BE34,"dstnat":#6DB7C6,"forward":#53A051,"output":#006D9C,"srcnat":#AF575A,"prerouting":#F1813F}</colorPalette>
</format>
<format type="color" field="protocol">
<colorPalette type="map">{"47":#006D9C,"TCP":#65A637,"UDP":#D93F3C,"ICMP":#F8BE34}</colorPalette>
</format>
<format type="color" field="rule">
<colorPalette type="sharedList"></colorPalette>
<scale type="sharedCategory"></scale>
</format>
<format type="color" field="in_if">
<colorPalette type="sharedList"></colorPalette>
<scale type="sharedCategory"></scale>
</format>
<format type="color" field="out_if">
<colorPalette type="sharedList"></colorPalette>
<scale type="sharedCategory"></scale>
</format>
<format type="color" field="src_ip">
<colorPalette type="sharedList"></colorPalette>
<scale type="sharedCategory"></scale>
</format>
<format type="color" field="src_port">
<colorPalette type="sharedList"></colorPalette>
<scale type="sharedCategory"></scale>
</format>
<format type="color" field="dest_ip">
<colorPalette type="sharedList"></colorPalette>
<scale type="sharedCategory"></scale>
</format>
<format type="color" field="dest_port">
<colorPalette type="sharedList"></colorPalette>
<scale type="sharedCategory"></scale>
</format>
<format type="color" field="City">
<colorPalette type="sharedList"></colorPalette>
<scale type="sharedCategory"></scale>
</format>
<format type="color" field="Country">
<colorPalette type="sharedList"></colorPalette>
<scale type="sharedCategory"></scale>
</format>
<format type="color" field="src_mac">
<colorPalette type="sharedList"></colorPalette>
<scale type="sharedCategory"></scale>
</format>
<format type="color" field="type">
<colorPalette type="map">{"F":#53A051,"R":#006D9C,"N":#F8BE34,"M":#AF575A}</colorPalette>
</format>
<format type="color" field="act">
<colorPalette type="map">{"D":#DC4E41,"RE":#DC4E41,"T":#DC4E41,"DE":#62B3B2,"M":#006D9C,"J":#F8BE34,"AS":#5A4575,"A":#53A051,"L":#FFFFFF}</colorPalette>
</format>
<format type="color" field="dir">
<colorPalette type="map">{"I":#F8BE34,"F":#53A051,"O":#B6C75A,"D":#53A051,"X":#006D9C,"S":#AF575A,"P":#F1813F}</colorPalette>
</format>
<format type="color" field="connection_state">
<colorPalette type="sharedList"></colorPalette>
<scale type="sharedCategory"></scale>
</format>
<format type="color" field="connection_mark">
<colorPalette type="sharedList"></colorPalette>
<scale type="sharedCategory"></scale>
</format>
</table>
</panel>
</row>
</form>
@jotne
I see some strange things happen …
1 of my devices stops displaying in splunk after approx 7 days of working fine.
Only a reboot of the device and a restart of splunk (docker on synology) makes everything work again.
6 other devices don’t show this behaviour. All devices run ROS 7.4 or 7.4.1. All devices run the 3.6 scripts
any suggestions ?
I have seen sometimes syslog stops working. Not sure if its syslog server not receiving or device not able to send.
What syslog server do you use? Splunk/514? rsyslog? other?
splunk is listening on udp/3514 (514 is in use by syno itself, rsyslog is running on 2514)
on the syno :
# netstat -aunp | grep 514
udp        0      0 0.0.0.0:2514            0.0.0.0:*                           31440/syslog-ng
udp        0      0 0.0.0.0:3514            0.0.0.0:*                           21088/splunkd
6 devices are still working, the 7th (my gateway) stops beining visible in splunk.
the gateway still logs to rsyslog (udp/2514)