You can try this dashboard and see if it works
Thanks - unfortunately it does not work.
You can try this dashboard and see if it works
Thanks - unfortunately it does not work.
I will soon release 3.7 You can try that and see if it fixes you problem.
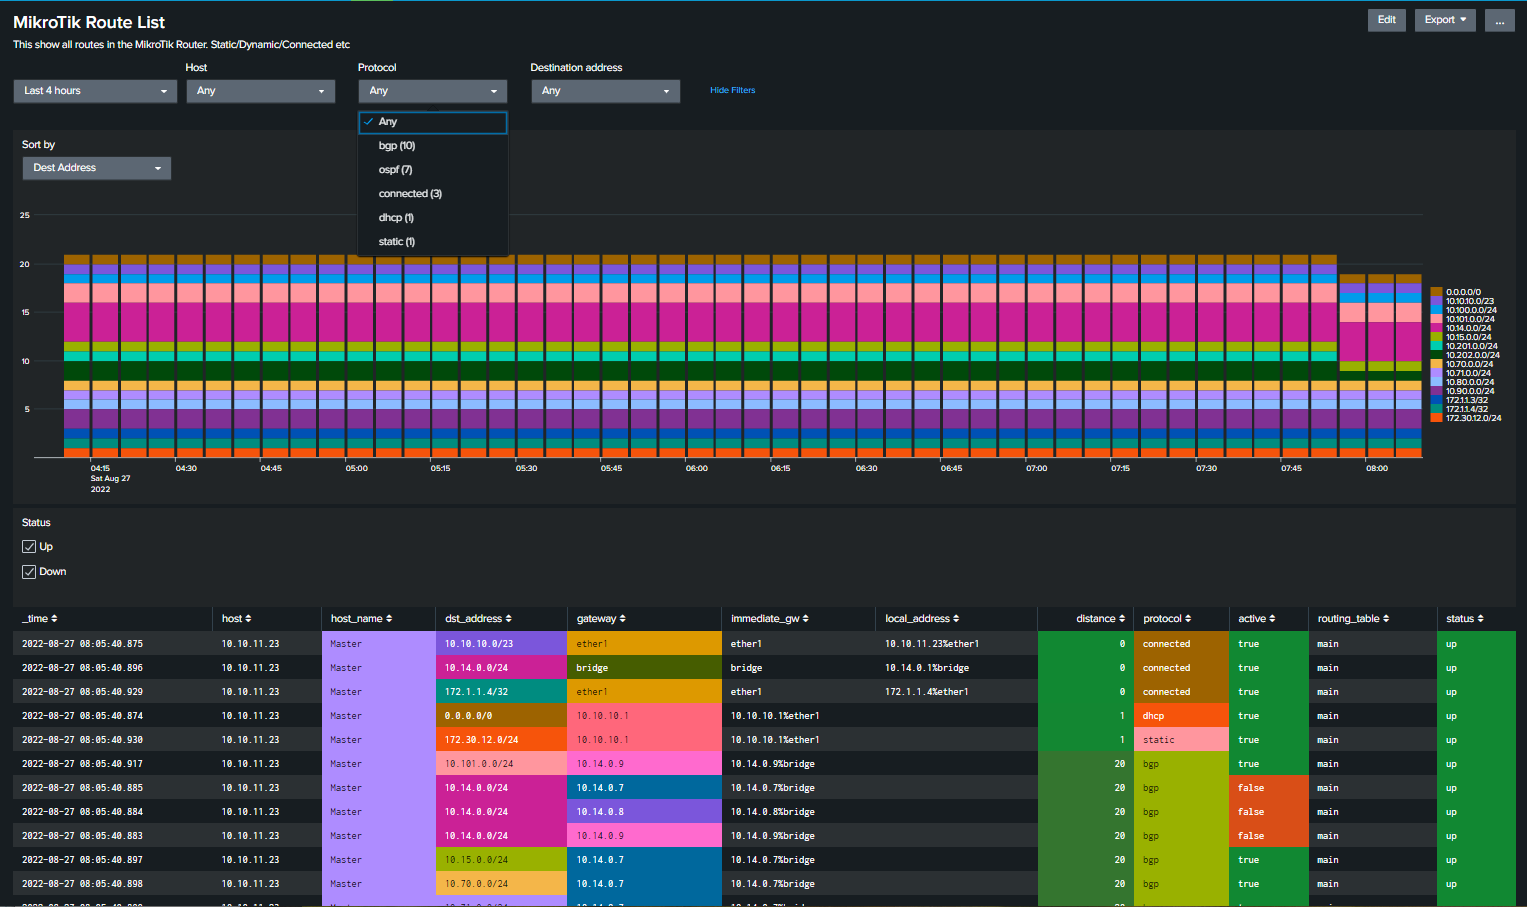
Here is a view of the routing dashboard. It will show all type of routes that are used. Separate dashboards for OSPF and BGP will be included.
.
The new routing dashboard looks very good.
I will wait (I am still not on routeros 7.4.2) - I hope I will find some time at this weekend, maybe I can figure something out.
Min script in first post updated to 4.9 (needed to work with 3.7 MikroTik app for Splunk)
Script can be updated regardless of if you update main app or not.
EXTRACT-mikrotik_firewall_info1 = ^firewall,info\s[Mm]ikro[Tt]ik:\s(?:(?<rule>[^:]+)\s)?(?<chain>.+?):\sin:(?<in_if>.*?)\sout:(?<out_if>[^,]+),(?:\sconnection-mark:(?<connection_mark>\S+))?(?:\sconnection-state:(?<connection_state>\S+))?(?:\ssrc-mac\s(?<src_mac>[^,]+),)?\sproto\s(?<protocol>\S+)(?:\s\((?<flag>[^\)]*)\))?,\s\[?(?<src_ip>(?:\d+\.\d+\.\d+\.\d+|[^\]]+))\]?(?::(?<src_port>[^-]+))?->\[?(?<dest_ip>(?:\d+\.\d+\.\d+\.\d+|[^\]]+))(?:\]?:(?<dest_port>[^,]+))?,\s(?:NAT[^,]+, )?(?:prio\s(?<prio>[^,]+),\s)?len\s(?<length>\d+)
In the current props.conf the EXTRACT-mikrotik_firewall_info1 section changed. Is there a way, how I can manually verify the filter? I can not get any data based on it.
If I add the old filter to the new props.conf it also does not work anymore.
EXTRACT-mikrotik_firewall_info1 = firewall,info\sMikroTik:\s((?<rule>[^:]+)\s)?(?<chain>.+?):\sin:(?<in_if>.*?)\sout:(?<out_if>[^,]+),(\ssrc-mac\s(?<src_mac>[^,]+),)?\sproto\s(?<protocol>\S+)(\s\((?<flag>[^\)]*)\))?,\s\[?(?<src_ip>(\d+\.\d+\.\d+\.\d+|[^\]]+))\]?(:(?<src_port>[^-]+))?->\[?(?<dest_ip>(\d+\.\d+\.\d+\.\d+|[^\]]+))(\]?:(?<dest_port>[^,]+))?,\s(NAT.*)?len\s(?<length>\d+)
This is in the logs:
2022-08-27T13:25:40.391228+02:00 <13>firewall,info MikroTik: FI_D_port-test input: in:pppoe-out1 out:(unknown 0), proto TCP (SYN), XX.YY.165.97:52819->C.A.B.172:34975, len 44
Just remove the ^ in front of the regex and it will work. I see you have the date info still in the log line.
I will make sure 3.7 works with and without the added front info since it may vary some from one syslog server to another.
To see how it works:
https://regex101.com/r/1Kzr3b/1
And here to see the complexity:
https://www.debuggex.com/r/cFElMmqQa5sYVgYW
Version 3.7 is now released.
Mayor changes in this release are the new routing dashboards. Since I do not have a high lever knowledge of routing there may be various bugs or stuff that are missing. Test and creation of dashboard was done using EVE-NG. So if you have OSPF or BGP routing please test this out give me feedback. i you are using other routing protocol that should be included, shout out and we can look inn to it. For personal question or stuff that you do not like to post public use this email degire4559@xitudy.com
New file are found under section 1g
Download, extract and replace old app (if you have not med personal changes)
PS Main script needs to be updated to 4.9 to get routing information.
What has changes since 3.6
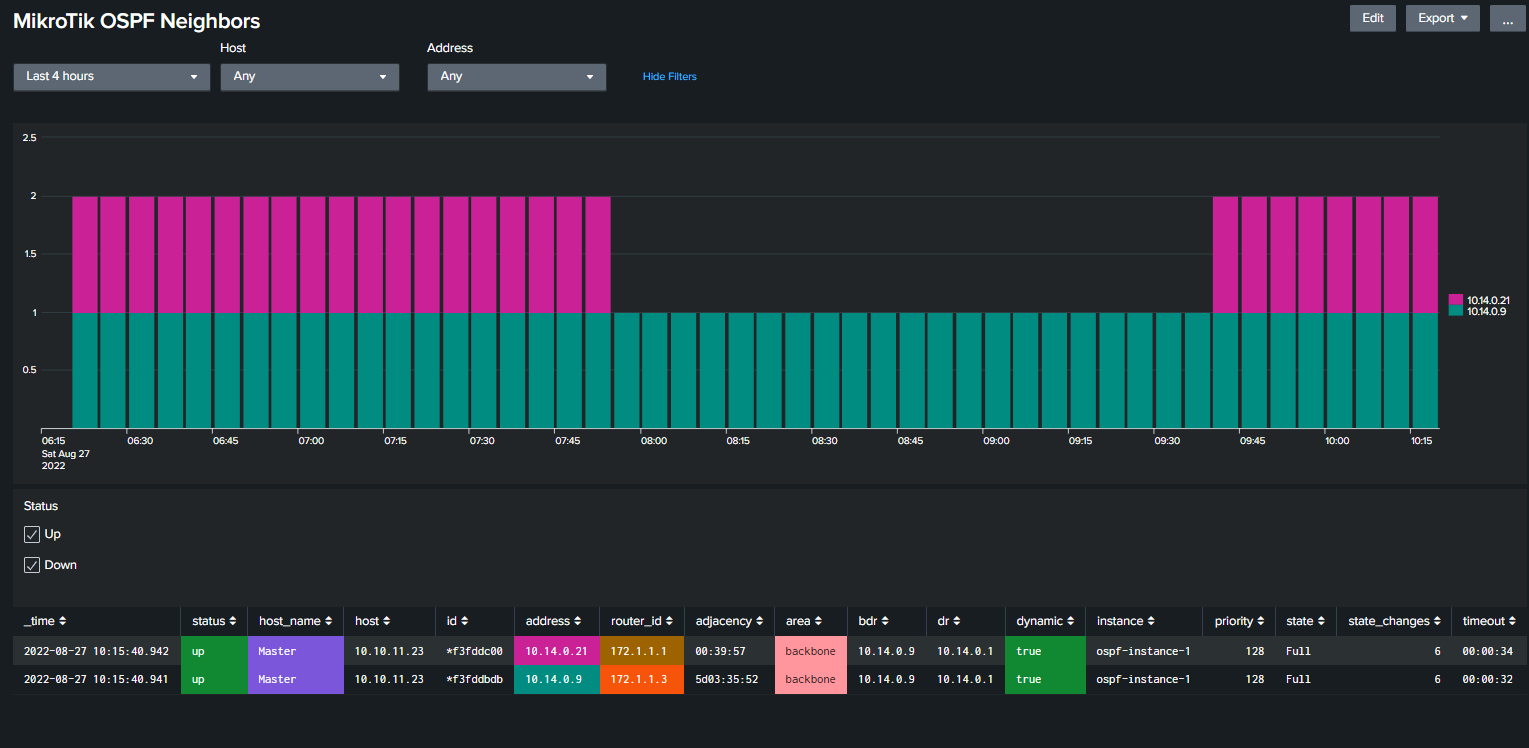
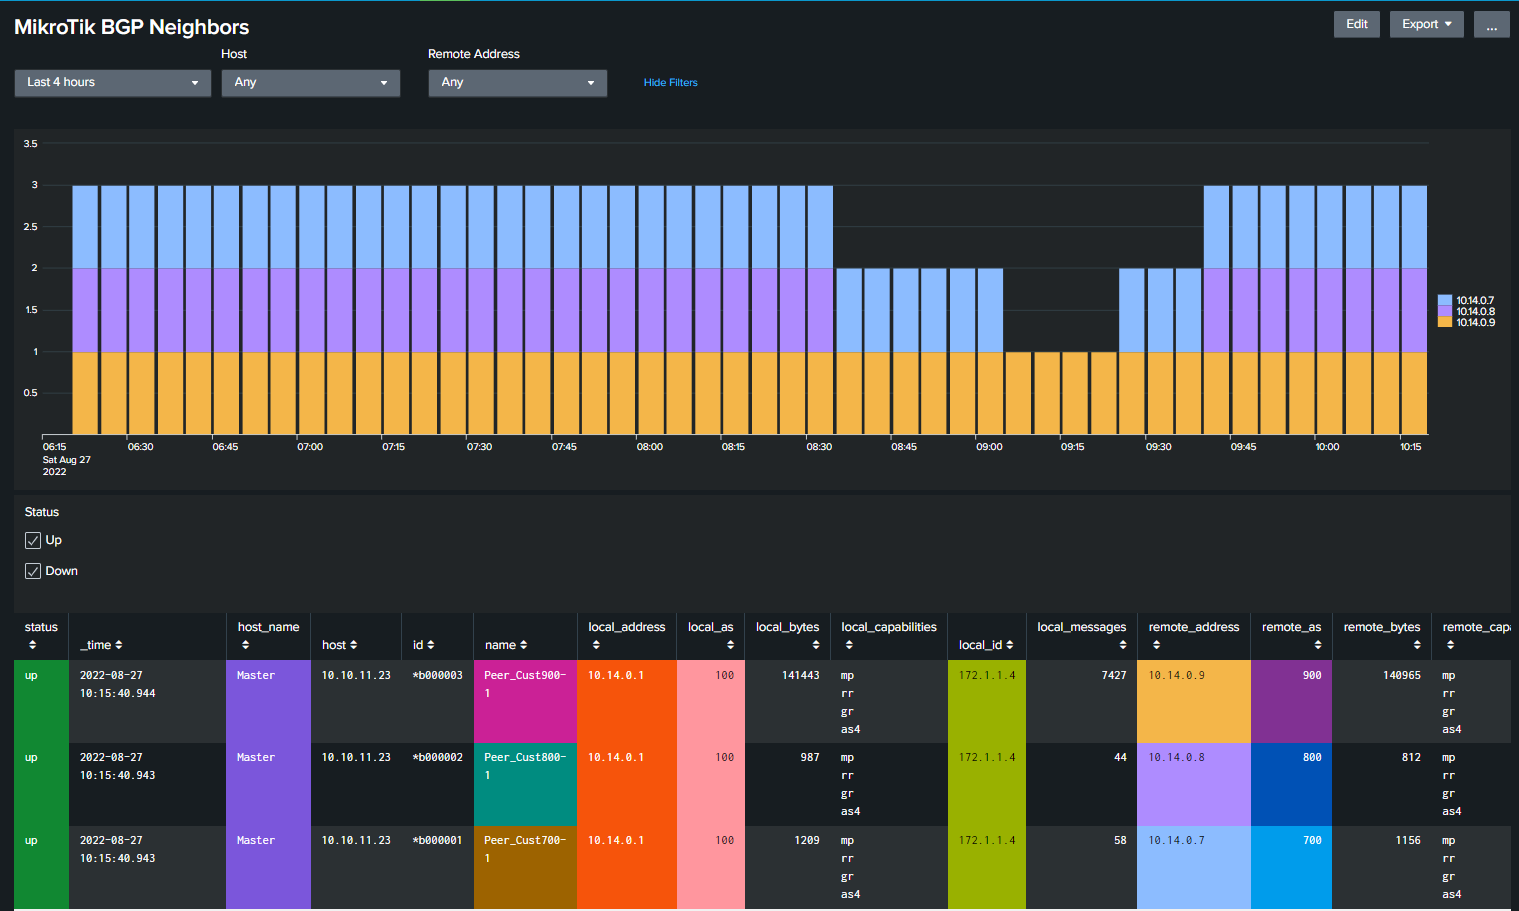
Here are Routing, OSPF and BGP dashboards.
.
Thanks @Jotne. Looks very good.
Firewall rules logs are working again (thanks for the hint to the regex site, I already knew it but I have not thought enough).
Routing dashboard is cool.
Have a nice day.
thanks @jotne
I just updated the .spl and the script on my main gateway. Look good
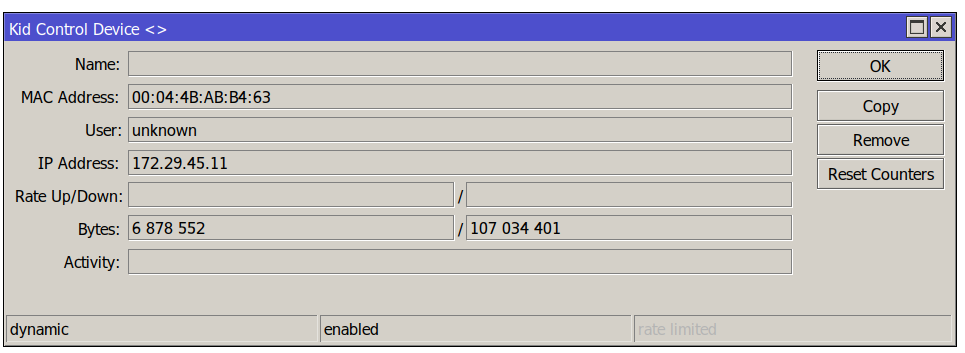
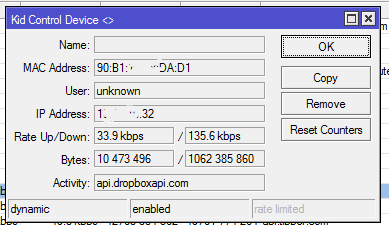
Too bad the “Kid Control” is actually not accurate on my 7.4.1 box.
Not too sure what is happening, but the use-case is simple. On my ShieldTV I’ve just watched a 16Gbytes movie. This is served from my NAS.
So it only recorded 107 megabytes of data…
The 4K movie runs at an average of 24megabit/sec … so …we’re not going to cut it with 107MB ![]()
We’ll I’ll do some reference-testing with iperf between hosts and see if counters represent reality…then I’ll open a case for that.
Even with this fine set of dashboards ; crap in = crap out ![]()
I have not testet on 7.4.1 but on 7.2.3 and other version it works fine.
Here I did download a 1GB file from here:
https://speed.hetzner.de/
and the result looks great.
.
It may be fail in config or maybe your device?
Not seen other complains about this.
Could it be some like fasttrack enabled?
Where I can find the capsman script?
Section
2f) Main Collector Script
in first post.
I mean this part, it invoke a “capsman” script
Test if CAPsMANN is installed, if yes, run capsmann script.
----------------------------------
:if ( ([:len [/interface find where type=“cap”]] > 0) and $CAPsMANN) do={ /system script run capsman }
My fault. It was missing (again)
Added to section 2g.
If I have had a CAPSman setup, I maybe could have added this part to the main script.
Don’t know what is wrong, after a couple of days that all works as expected, devices stop being visible in spluk …
Only restarting splunk seems to help.
I’ve ran a couple of iperf3 testing and indeed the accounting/KidControl-data seems to match! So I’m not sure what happened here to draw my false conclusion ![]()
Carry on ![]()
I do not say its a docker problem, but I always runs Splunk on clean Ubuntu (18.04 or newer) and its very stable.
@Jotne,
Can you include in your next release the version-tag ?
![]()
Its already included in 3.7 that was released some day ago.
If you still se it, in what dashboard?
You can just edit dashboard select source and change first line from:
<form theme="dark">
to
This is just a stupid warning that was added in splunk 9.0 that was released in juni. You can ignore it.