so guys, i am struggling quite some time with my tunnels(ipsec).
Status is established, but there is no traffic allowed, I must disable/enable to get that working.
So, what is first step, what to do?
What i tried?
I have several tunnels Mikrotik - Mikrotik, and I change it to Mikrotik - PFSense router and seems same.
hq have mikrotik and remote locations also, but those locations are connected through openvpn to pfsense. JUst to have image in head what is where connected and what are those tunnels for.
Also, i can make two MikroTik to have tunnels, one in HQ and another instead of Pfsense is in another HQ, so i can do it like that, but results are the same, in some random time, there is problemwith connecting to remote shops, no ping, cant connect to routers, etc.
So i just disable/enable.
I cant put some scripts to ping, because local subnet in HQ are on core switches.
A blind shot here would be a mismatch of PFS settings, causing the first rekeying of the SAs to fail (so the tunnel would work for just about 25 minutes after establishing if default lifetime=30m is set in /ip ipsec proposal).
Another blind shot would be that pinholes in some external firewall on the path between the two devices expire as no traffic passes through them for an extended period of time, but this would only be relevant if both IPsec peers are running on public IPs so the NAT traversal mechanism is not activated - keepalives are part of that mechanism.
For starters, can you post the configuration exports of the two Mikrotiks which suffer from this issue? Follow the hint in my automatic signature below to remove the sensitive information without breaking the internal logic of the configuration, i.e. substitute eventual public IPs and eventual domain names by the same strings in both exports.
lifetime on pfsense is 1800sec,and on mikrotik is 30 min.
relevant if both IPsec peers are running on public IPs
yes, both are directly public IPs on interfaces.
I think i hide everything and not copying not important stuff
# oct/02/2020 23:21:32 by RouterOS 6.46.6
# software id = QDC5-RJ3Y
#
# model = CCR1009-8G-1S
# serial number = 606B0516C93B
/interface bridge
add name=bridgeVN
/interface ethernet
set [ find default-name=ether1 ] name=ether1-mgt-backup speed=100Mbps
set [ find default-name=ether2 ] name=ether2-mng-int speed=100Mbps
set [ find default-name=ether3 ] name=ether3_HQCAM speed=100Mbps
set [ find default-name=ether4 ] l2mtu=1576 name="ether4 - Paradox" speed=\
    100Mbps
set [ find default-name=ether5 ] advertise=\
    10M-half,10M-full,100M-half,100M-full,1000M-half,1000M-full l2mtu=1572 \
    speed=100Mbps
set [ find default-name=ether6 ] speed=100Mbps
set [ find default-name=ether7 ] speed=100Mbps
set [ find default-name=ether8 ] speed=100Mbps
set [ find default-name=sfp1 ] advertise=10M-full,100M-full,1000M-full
/interface vrrp
add interface=ether8 name=vrrp_LAN
add interface=ether1-mgt-backup name=vrrp_WAN_1
add interface=ether2-mng-int name=vrrp_WAN_2
/interface vlan
add disabled=yes interface=ether5 name=vlan2-sw-mgt vlan-id=2
add disabled=yes interface=ether5 name=vlan10 vlan-id=10
add disabled=yes interface=ether5 name=vlan20 vlan-id=20
add disabled=yes interface=ether5 name=vlan30 vlan-id=30
add disabled=yes interface=ether5 name=vlan80 vlan-id=80
add disabled=yes interface=ether5 name=vlan100 vlan-id=100
add disabled=yes interface=ether5 name=vlan200 vlan-id=200
add disabled=yes interface=ether5 name=vlan201 vlan-id=201
add disabled=yes interface=ether5 name=vlan202 vlan-id=202
add disabled=yes interface=ether5 name=vlan210 vlan-id=210
add disabled=yes interface=ether5 name=vlan250 vlan-id=250
add disabled=yes interface=ether5 name=vlan300 vlan-id=300
add comment="   - internet" disabled=yes interface=sfp1 name=vlan301 vlan-id=\
    301
add comment="   - l3 vpn" disabled=yes interface=sfp1 name=vlan303 vlan-id=\
    303
add comment="ex intretnet 2" disabled=yes interface=sfp1 name=vlan307 \
    vlan-id=307
add comment="Mng internet" disabled=yes interface=sfp1 name=vlan337 vlan-id=\
    337
add disabled=yes interface=ether5 name=vlan400 vlan-id=400
add disabled=yes interface=ether5 name=vlan500 vlan-id=500
add disabled=yes interface=ether5 name=vlan600 vlan-id=600
add disabled=yes interface=ether5 name=vlan700 vlan-id=700
add disabled=yes interface=ether5 name=vlan800 vlan-id=800
add disabled=yes interface=ether5 name=vlan900 vlan-id=900
add disabled=yes interface=ether5 name=vlan950 vlan-id=950
add disabled=yes interface=ether5 name=vlan1000 vlan-id=1000
/interface list
add name=WAN
/interface wireless security-profiles
set [ find default=yes ] supplicant-identity=MikroTik
/ip dhcp-server option
add code=43 name=unifi value=0x0104c0a83223
/ip firewall layer7-protocol
add name=torrent-wwws regexp="^.*(get|GET).+(torrent|thepiratebay|1337xto.to|i\
    sohunt|entertane|demonoid|btjunkie|mininova|flixflux|torrentz|vertor|h33t|\
    btscene|bitunity|bittoxic|thunderbytes|entertane|zoozle|vcdq|bitnova|bitso\
    up|meganova|fulldls|btbot|flixflux|seedpeer|fenopy|gpirate|commonbits).*\$\
    "
add name=torrent-dns regexp="^.+(torrent|thepiratebay|isohunt|entertane|demono\
    id|btjunkie|mininova|flixflux|torrentz|vertor|h33t|btscene|bitunity|bittox\
    ic|thunderbytes|entertane|zoozle|vcdq|bitnova|bitsoup|meganova|fulldls|btb\
    ot|flixflux|seedpeer|fenopy|gpirate|commonbits).*\$"
add comment="Block Bit Torrent" name=layer7-bittorrent-exp regexp="^(\\x13bitt\
    orrent protocol|azver\\x01\$|get /scrape\\\?info_hash=get /announce\\\?inf\
    o_hash=|get /client/bitcomet/|GET /data\\\?fid=)|d1:ad2:id20:|\\x08'7P\\)[\
    RP]"
/ip ipsec profile
add dh-group=modp1024 enc-algorithm=3des hash-algorithm=md5 name=profile_1 \
    nat-traversal=no
add dh-group=modp1024 enc-algorithm=3des hash-algorithm=md5 name=profile_2 \
    nat-traversal=no
add enc-algorithm=aes-256,aes-128 name=profile_3 nat-traversal=no
add dh-group=modp1024 enc-algorithm=aes-256,aes-128 name=profile_4
add dh-group=modp1024 dpd-interval=10s dpd-maximum-failures=15 enc-algorithm=\
    3des hash-algorithm=md5 name=profile_10
add enc-algorithm=aes-256,aes-128 name=profile_12 nat-traversal=no
add dh-group=modp1024 dpd-interval=10s enc-algorithm=aes-256 lifetime=8h \
    name=profile_13
add dh-group=modp1024 dpd-interval=10s dpd-maximum-failures=15 enc-algorithm=\
    3des name=profile_14
add dh-group=modp1024 enc-algorithm=aes-256 name=profile_15 nat-traversal=no
/ip ipsec peer
add address=SOME_WAN2/32 disabled=yes local-address=WAN1_ISP_PUBLIC_IP.253 name=\
    peer6 profile=profile_2
add address=SOME_WAN3/32 disabled=yes local-address=WAN1_ISP_PUBLIC_IP.253 name=\
    peer5 profile=profile_1 send-initial-contact=no
add address=routerHQ.main/32 comment=@vn local-address=secondIP.wan name=\
    peer87 profile=profile_15
add address=routerHQ.main/32 local-address=routerHQ.main2 name=peer13 \
    profile=profile_4
add address=routerHQ.main/32 comment=vpn disabled=yes exchange-mode=\
    aggressive name=peer86 profile=profile_14
add address=pfSense.IP/32 name=peer84 profile=profile_13
add address=SOME_WAN/32 name=peer9 profile=profile_3
add comment=Company exchange-mode=aggressive name=peer80 passive=yes profile=\
    profile_10
/ip ipsec proposal
set [ find default=yes ] enc-algorithms=aes-256-cbc,aes-128-cbc,3des \
    lifetime=5m
add auth-algorithms=md5 enc-algorithms=3des lifetime=1d name=proposal1 \
    pfs-group=none
add auth-algorithms=md5 enc-algorithms=3des lifetime=1h name=proposal2 \
    pfs-group=none
add enc-algorithms=3des name=Company
add enc-algorithms=3des name=Company2
add enc-algorithms=aes-256-cbc lifetime=1h name=NS2BG pfs-group=none
add enc-algorithms=aes-256-cbc name=NC-proposal pfs-group=none

/ip firewall connection tracking
set tcp-established-timeout=3h
/ip settings
set rp-filter=loose tcp-syncookies=yes
/interface l2tp-server server
set authentication=mschap1,mschap2 default-profile=l2tp_Company enabled=yes \
    use-ipsec=yes
/interface list member
add interface=vrrp_WAN_1 list=WAN
add interface=vrrp_WAN_2 list=WAN
/interface pptp-server server
set enabled=yes
/ip address
add address=routerHQ.main2/30 comment=INTERNET interface=vrrp_WAN_1 network=\
    WAN1-NETWORK
add address=WAN_PUBLIC IPs.dedicated comment=Public_IP disabled=yes interface=vlan10 \
    network=WAN_PUBLIC IP-NETWORK
add address=10.10.88.1/24 comment=MGT-BACKUP-LOCAL disabled=yes interface=\
    ether1-mgt-backup network=10.10.88.0
add address=hqIPs.126/28 disabled=yes interface=vlan30 network=\
    hqIPs.112
add address=WAN1_ISP_PUBLIC_IP.249/29 disabled=yes network=WAN1_ISP_PUBLIC_IP.248
add address=WAN1_ISP_PUBLIC_IP.253/29 comment=IPSec disabled=yes network=WAN1_ISP_PUBLIC_IP.248
add address=172.16.20.2/24 interface=ether1-mgt-backup network=172.16.20.0
add address=10.99.99.2/24 interface=ether8 network=10.99.99.0
add address=10.99.99.1/24 interface=vrrp_LAN network=10.99.99.0
add address=172.16.10.2/24 interface=ether2-mng-int network=172.16.10.0
add address=secondIP.wan/30 interface=vrrp_WAN_2 network=\
    secondIP.network
add address=192.168.90.1/24 interface=ether3_HQCAM network=\
    192.168.90.0
/ip arp
add address=192.168.50.235 interface=vrrp_LAN mac-address=9E:29:CC:D7:98:F8

/ip dns
set allow-remote-requests=yes servers=1.1.1.1,8.8.8.8
/ip firewall filter
add action=drop chain=forward comment="@Server drop Locations" \
    disabled=yes dst-address=10.0.0.0/8 src-address=192.168.50.144
add action=drop chain=forward comment="@Server drop Locations" \
    dst-address=192.168.200.0/24 src-address=10.98.0.0/24
add action=fasttrack-connection chain=forward dst-port=53 protocol=tcp \
    src-address=192.168.50.0/24
add action=fasttrack-connection chain=forward dst-port=53 protocol=udp \
    src-address=192.168.50.0/24
add action=drop chain=forward disabled=yes src-mac-address=2C:FD:A1:71:E3:B4
add action=drop chain=input disabled=yes src-mac-address=2C:FD:A1:71:E3:B4
add action=drop chain=input disabled=yes packet-size=200-65535 protocol=icmp
add action=accept chain=forward dst-address=10.11.0.0/16 src-address=\
    192.168.30.0/24
add action=accept chain=input dst-address=10.11.0.0/16 src-address=\
    192.168.30.0/24
add action=drop chain=forward disabled=yes packet-size=200-65535 protocol=\
    icmp
add action=jump chain=forward comment="SYN Flood protect FORWARD" \
    connection-state=new disabled=yes jump-target=syn-attack protocol=tcp \
    tcp-flags=syn
add action=jump chain=input comment="SYN Flood protect INPUT" \
    connection-state=new disabled=yes jump-target=syn-attack protocol=tcp \
    tcp-flags=syn
add action=accept chain=syn-attack connection-state=new disabled=yes limit=\
    400,5:packet protocol=tcp tcp-flags=syn
add action=drop chain=syn-attack connection-state=new disabled=yes protocol=\
    tcp tcp-flags=syn
add action=accept chain=forward disabled=yes dst-address-list=Remote_2_IPSEC \
    src-address-list=Local_2_IPSEC
add action=accept chain=forward disabled=yes dst-address-list=Local_2_IPSEC \
    src-address-list=Remote_2_IPSEC
add action=fasttrack-connection chain=forward disabled=yes
add action=drop chain=forward comment="Drop Inv." connection-state=invalid
add action=accept chain=forward dst-address=10.98.0.0/24 src-address=\
    192.168.2.0/24
add action=accept chain=input dst-address=10.98.0.0/24 src-address=\
    192.168.2.0/24
add action=accept chain=input in-interface=vrrp_WAN_1 protocol=icmp
add action=accept chain=input comment=\
    "permit from local ip DNS reuqest udp 53" dst-port=53 protocol=udp \
    src-address-list=local_ip
add action=reject chain=forward comment="@FB FORBID" dst-port=443 protocol=\
    tcp reject-with=icmp-network-unreachable src-address-list=!Social \
    tls-host=*.facebook.com
add action=reject chain=forward comment=@TeamVforbid disabled=yes dst-port=\
    443 protocol=tcp reject-with=icmp-network-unreachable src-address=\
    !192.168.0.0/16 tls-host=*.teamviewer.com
add action=reject chain=forward comment=@Anydesk disabled=yes dst-port=443 \
    protocol=tcp reject-with=icmp-network-unreachable src-address=\
    !192.168.50.0/24 tls-host=*.anydesk.com
add action=accept chain=forward dst-address=192.168.200.0/24 src-address=\
    192.168.23.0/24
add action=accept chain=forward dst-address=192.168.200.0/24 src-address=\
    172.16.2.0/24
add action=accept chain=forward dst-address=192.168.200.0/24 src-address=\
    192.168.30.0/24
add action=accept chain=input dst-address=192.168.200.0/24 src-address=\
    192.168.23.0/24
add action=reject chain=input comment="Drop !DNS" dst-port=53 protocol=udp \
    reject-with=icmp-network-unreachable
add action=reject chain=input comment="Drop !DNS" dst-port=53 protocol=tcp \
    reject-with=icmp-network-unreachable
add action=accept chain=forward connection-state=established,related
add action=accept chain=input connection-state=established,related
add action=accept chain=input comment=SSH dst-port=4777 protocol=tcp \
    src-address-list=HQ1addresses
add action=accept chain=input comment=SSH dst-port=4777 protocol=tcp \
    src-address-list=HQ2addresses
add action=accept chain=input comment=WinBox dst-port=8291 protocol=tcp \
    src-address-list=HQ2addresses
add action=accept chain=input comment=WinBox dst-port=8291 protocol=tcp \
    src-address-list=HQ1addresses
add action=accept chain=input comment="Allow ICMP" protocol=icmp \
    src-address-list=HQ1addresses
add action=accept chain=input comment="Allow ICMP" protocol=icmp \
    src-address-list=HQ2addresses
add action=drop chain=input comment="Drop Inv." connection-state=invalid
add action=reject chain=input comment="Drop !DNS" dst-port=53 protocol=tcp \
    reject-with=icmp-network-unreachable src-address-list=!DNS
add action=reject chain=input comment="Drop !DNS" dst-port=53 protocol=udp \
    reject-with=icmp-network-unreachable src-address-list=!DNS
add action=accept chain=output comment="OUT-Pusti PMTUD" icmp-options=3:4 \
    protocol=icmp
add action=accept chain=input comment="IN-Pusti PMTUD" icmp-options=3:4 \
    protocol=icmp
add action=accept chain=input comment="IN-Propusti ping 1468b do 5 u sekundi" \
    limit=5,1:packet packet-size=1468 protocol=icmp
add action=add-src-to-address-list address-list=pingeri address-list-timeout=\
    1d chain=input comment="IN-Listuj ICMP koji ne matchuje kriterijum" \
    dst-address-list=!HQ2addresses in-interface-list=WAN log-prefix=Ping@IN \
    protocol=icmp src-address-list=!HQ2addresses
add action=add-src-to-address-list address-list=@Services_Phase1 \
    address-list-timeout=30m chain=input comment=IN-Services_Phase1 \
    dst-address-list=!HQ2addresses dst-port=21,22,23,69,80,443,5060,8080 \
    in-interface-list=WAN protocol=tcp src-address-list=!HQ2addresses
add action=add-src-to-address-list address-list=@Services_Phase1 \
    address-list-timeout=30m chain=input comment=IN-Services_Phase1-UDP \
    dst-address-list=!HQ2addresses dst-port=21,22,23,69,80,443,5060,8080 \
    in-interface-list=WAN protocol=udp src-address-list=!HQ2addresses
add action=add-src-to-address-list address-list=@Services_Phase2 \
    address-list-timeout=30m chain=input comment=IN-Services_Phase2 dst-port=\
    21,22,23,69,80,443,5060,8080 in-interface-list=WAN protocol=tcp \
    src-address-list=@Services_Phase1
add action=add-src-to-address-list address-list=@Services_Phase2 \
    address-list-timeout=30m chain=input comment=IN-Services_Phase2-UDP \
    dst-port=21,22,23,69,80,443,5060,8080 in-interface-list=WAN protocol=udp \
    src-address-list=@Services_Phase1
add action=add-src-to-address-list address-list=@Services_Phase3 \
    address-list-timeout=1w chain=input comment=IN-Services_Phase3 dst-port=\
    21,22,23,69,80,443,5060,8080 in-interface-list=WAN protocol=tcp \
    src-address-list=@Services_Phase2
add action=add-src-to-address-list address-list=@Services_Phase3 \
    address-list-timeout=1w chain=input comment=IN-Services_Phase3-UDP \
    dst-port=21,22,23,69,80,443,5060,8080 in-interface-list=WAN protocol=udp \
    src-address-list=@Services_Phase2
add action=drop chain=input comment=IN-Phase3_dropRAW src-address-list=\
    @Services_Phase3
add action=drop chain=input comment="IN-Blokiraj Shodan" src-address-list=\
    shodan
add action=drop chain=input comment="IN-Brani se od pingera" \
    src-address-list=pingeri
add action=jump chain=forward comment="SYN Flood protect FORWARD" \
    connection-state=new disabled=yes jump-target=syn-attack protocol=tcp \
    tcp-flags=syn
add action=jump chain=input comment="SYN Flood protect INPUT" \
    connection-state=new disabled=yes jump-target=syn-attack protocol=tcp \
    tcp-flags=syn
add action=accept chain=input dst-port=161 protocol=udp
add action=accept chain=forward dst-port=161 protocol=udp
add action=accept chain=output dst-port=161 protocol=udp

/ip firewall nat
add action=dst-nat chain=dstnat disabled=yes dst-address=secondIP.wan \
    dst-port=16001 in-interface=ether2-mng-int protocol=udp to-addresses=\
    192.168.90.250 to-ports=16001
add action=dst-nat chain=dstnat disabled=yes dst-port=16001 in-interface=\
    ether2-mng-int protocol=udp to-addresses=192.168.90.250 to-ports=16001
add action=netmap chain=dstnat comment=@SomeServer disabled=yes dst-address=\
    hqIPs.119 protocol=tcp to-addresses=192.168.50.144
add action=dst-nat chain=dstnat dst-address=secondIP.wan dst-port=16001 \
    in-interface=vrrp_WAN_2 protocol=udp to-addresses=192.168.90.250 \
    to-ports=16001
add action=dst-nat chain=dstnat comment="@server!" disabled=yes \
    dst-address=hqIPs.119 dst-port=22 protocol=tcp to-addresses=\
    192.168.50.144 to-ports=22
add action=dst-nat chain=dstnat comment="@server!" disabled=yes \
    dst-address=hqIPs.119 dst-port=3306 protocol=tcp to-addresses=\
    192.168.50.144 to-ports=3306
add action=accept chain=srcnat dst-address=10.11.0.0/16 src-address=\
    192.168.30.0/24
add action=accept chain=srcnat dst-address=192.168.200.0/24 src-address=\
    10.98.0.0/24
add action=netmap chain=srcnat disabled=yes src-address=192.168.90.250 \
    to-addresses=secondIP.wan
add action=accept chain=srcnat dst-address=192.168.200.0/24 src-address=\
    192.168.36.0/24
add action=accept chain=srcnat dst-address=192.168.200.0/24 src-address=\
    192.168.30.0/24
add action=accept chain=srcnat dst-address=192.168.200.0/24 src-address=\
    172.16.2.0/24
add action=dst-nat chain=dstnat dst-address=192.168.0.10 dst-port=10003 \
    protocol=tcp to-addresses=192.168.200.11 to-ports=10003
add action=accept chain=srcnat dst-address=10.100.0.0/16 src-address=\
    192.168.50.0/24
add action=accept chain=srcnat dst-address=192.168.50.0/24 src-address=\
    10.100.0.0/16
add action=accept chain=srcnat dst-address=10.30.0.0/16 src-address=\
    192.168.50.0/24
add action=accept chain=srcnat dst-address=10.40.0.0/16 src-address=\
    192.168.50.0/24
add action=accept chain=srcnat dst-address=192.168.31.0/24 src-address=\
    192.168.90.0/24
add action=accept chain=srcnat dst-address=192.168.41.0/24 src-address=\
    192.168.90.0/24
add action=accept chain=srcnat dst-address=192.168.23.0/24 src-address=\
    192.168.90.0/24
add action=accept chain=srcnat dst-address=192.168.30.0/24 src-address=\
    192.168.90.0/24
add action=accept chain=srcnat dst-address=192.168.50.0/24 src-address=\
    192.168.90.0/24
add action=accept chain=srcnat dst-address=10.11.0.0/16 src-address=\
    192.168.90.0/24
add action=accept chain=srcnat dst-address=10.10.0.0/16 src-address=\
    192.168.90.0/24
add action=accept chain=srcnat disabled=yes dst-address=10.11.0.0/16 \
    src-address=192.168.50.0/24
add action=accept chain=srcnat disabled=yes dst-address=150.10.0.0/16 \
    src-address=192.168.50.0/24
add action=accept chain=srcnat comment=@Company-NS-IT dst-address=172.16.223.9 \
    src-address=192.168.50.0/24
add action=accept chain=srcnat comment=@Company-NS-IT dst-address=\
    192.168.90.0/24 src-address=192.168.50.0/24
add action=accept chain=srcnat comment=@Company-NS-IT dst-address=\
    192.168.50.0/24 src-address=172.16.223.9
add action=accept chain=srcnat comment=BgL2tp-NS_2.3_server dst-address=\
    192.168.5.0/24 src-address=192.168.2.0/24
add action=accept chain=srcnat dst-address=150.11.0.0/16 src-address=\
    192.168.0.0/16
add action=accept chain=srcnat dst-address=150.10.0.0/16 src-address=\
    192.168.0.0/16
add action=accept chain=srcnat dst-address=150.20.0.0/16 src-address=\
    192.168.0.0/16
add action=accept chain=srcnat dst-address=10.10.0.0/16 src-address=\
    192.168.0.0/16
add action=accept chain=srcnat dst-address=10.11.0.0/16 src-address=\
    192.168.0.0/16
add action=accept chain=srcnat dst-address=10.20.0.0/16 src-address=\
    192.168.0.0/16
add action=accept chain=srcnat dst-address=10.100.0.0/16 src-address=\
    192.168.50.0/24
add action=accept chain=srcnat dst-address=10.100.0.0/16 src-address=\
    192.168.23.0/24
add action=accept chain=srcnat dst-address=10.100.0.0/16 src-address=\
    192.168.90.0/24
add action=accept chain=srcnat dst-address=192.168.200.0/24 src-address=\
    192.168.50.0/24
add action=accept chain=srcnat comment="NO NAT LOCAL IP TO LOCAL IP" \
    dst-address-list=local_ip src-address-list=local_ip
add action=dst-nat chain=dstnat in-interface=vrrp_WAN_1 protocol=tcp \
    src-port=58291 to-addresses=10.99.99.3 to-ports=8291
add action=netmap chain=dstnat comment="@Server" dst-address=\
    hqIPs.119 to-addresses=192.168.50.144
add action=netmap chain=dstnat comment="@pfSense.IP - ServerSOME" dst-address=\
    hqIPs.115 to-addresses=192.168.50.20
add action=netmap chain=dstnat comment=mis disabled=yes dst-address=\
    hqIPs.117 to-addresses=192.168.50.32
add action=dst-nat chain=dstnat dst-address=hqIPs.114 to-addresses=\
    192.168.50.123
add action=dst-nat chain=dstnat comment="UnifyAP 4 Remote" dst-address=\
    hqIPs.116 dst-port=8443 protocol=tcp to-addresses=192.168.50.35
add action=dst-nat chain=dstnat comment="UnifyAP 4 Remote" dst-address=\
    hqIPs.116 dst-port=3478 protocol=udp to-addresses=192.168.50.35
add action=dst-nat chain=dstnat comment="UnifyAP 4 Remote" dst-address=\
    hqIPs.116 dst-port=8080 protocol=tcp to-addresses=192.168.50.35
add action=dst-nat chain=dstnat comment=betEx dst-address=hqIPs.118 \
    to-addresses=192.168.50.197
add action=dst-nat chain=dstnat dst-address=routerHQ.main2 dst-port=8080 \
    protocol=tcp to-addresses=192.168.2.3 to-ports=8080
add action=dst-nat chain=dstnat dst-address=routerHQ.main2 dst-port=9182 \
    protocol=tcp to-addresses=192.168.2.3 to-ports=9182
add action=dst-nat chain=dstnat dst-address=routerHQ.main2 dst-port=8081 \
    protocol=tcp to-addresses=192.168.2.3 to-ports=8081
add action=dst-nat chain=dstnat dst-address=routerHQ.main2 dst-port=9080 \
    protocol=tcp to-addresses=192.168.2.3 to-ports=9080
add action=masquerade chain=srcnat out-interface=vrrp_WAN_1
add action=masquerade chain=srcnat out-interface=vrrp_WAN_2
add action=masquerade chain=srcnat src-address=10.10.10.0/24
add action=masquerade chain=srcnat src-address=172.16.0.0/12
add action=masquerade chain=srcnat src-address=192.168.0.0/16
add action=dst-nat chain=dstnat comment=@SomeServer disabled=yes \
    dst-port=16001 in-interface=vrrp_WAN_2 protocol=tcp to-addresses=\
    192.168.90.250 to-ports=16001
add action=dst-nat chain=dstnat disabled=yes dst-port=16001 in-interface=\
    vrrp_WAN_2 protocol=udp to-addresses=192.168.90.250 to-ports=16001
/ip firewall raw
add action=drop chain=prerouting comment="IN-Drop Phase3Raw" disabled=yes \
    log=yes log-prefix=raw src-address-list=@Services_Phase3
/ip ipsec identity
add peer=peer5
add peer=peer6
add peer=peer9
add my-id=address:routerHQ.main2 peer=peer13
add peer=peer86
add peer=peer87
add my-id=address:192.168.50.99 peer=peer84
add peer=peer80
/ip ipsec policy
add comment=l2tp@cms dst-address=192.168.200.0/24 level=unique peer=peer13 \
    proposal=Company sa-dst-address=routerHQ.main sa-src-address=\
    routerHQ.main2 src-address=172.16.2.0/24 tunnel=yes
add comment=l2tp@cms disabled=yes dst-address=192.168.200.0/24 level=unique \
    peer=peer13 proposal=Company sa-dst-address=routerHQ.main \
    sa-src-address=routerHQ.main2 src-address=192.168.100.246/32 tunnel=yes
add dst-address=192.168.200.0/24 level=unique peer=peer13 proposal=Company \
    sa-dst-address=routerHQ.main sa-src-address=routerHQ.main2 src-address=\
    192.168.34.0/24 tunnel=yes
add dst-address=192.168.200.0/24 level=unique peer=peer13 proposal=Company \
    sa-dst-address=routerHQ.main sa-src-address=routerHQ.main2 src-address=\
    192.168.36.0/24 tunnel=yes
add disabled=yes dst-address=192.168.200.0/24 level=unique peer=peer13 \
    proposal=Company sa-dst-address=routerHQ.main sa-src-address=\
    routerHQ.main2 src-address=10.98.0.0/24 tunnel=yes
add comment="IT-SOME_SERVER INTERNAL" dst-address=192.168.47.0/24 level=unique peer=\
    peer13 proposal=Company sa-dst-address=routerHQ.main sa-src-address=\
    routerHQ.main2 src-address=192.168.50.0/24 tunnel=yes
add comment=BG2NS dst-address=10.100.0.0/16 level=unique peer=peer84 \
    proposal=NS2BG sa-dst-address=pfSense.IP sa-src-address=routerHQ.main2 \
    src-address=192.168.50.0/24 tunnel=yes
add comment=BG2NS dst-address=10.100.0.0/16 level=unique peer=peer84 \
    proposal=NS2BG sa-dst-address=pfSense.IP sa-src-address=routerHQ.main2 \
    src-address=192.168.30.0/24 tunnel=yes
add comment=BG2NS disabled=yes dst-address=10.100.0.0/16 level=unique peer=\
    peer84 proposal=NS2BG sa-dst-address=pfSense.IP sa-src-address=\
    routerHQ.main2 src-address=10.98.0.0/24 tunnel=yes
add comment=BG2NS dst-address=10.100.0.0/16 level=unique peer=peer84 \
    proposal=NS2BG sa-dst-address=pfSense.IP sa-src-address=routerHQ.main2 \
    src-address=192.168.23.0/24 tunnel=yes
add comment=BG2NS dst-address=10.100.0.0/16 level=unique peer=peer84 \
    proposal=NS2BG sa-dst-address=pfSense.IP sa-src-address=routerHQ.main2 \
    src-address=192.168.2.0/24 tunnel=yes
add comment=BG2NS-IT2Shops dst-address=10.10.0.0/16 level=unique peer=\
    peer84 proposal=NS2BG sa-dst-address=pfSense.IP sa-src-address=\
    routerHQ.main2 src-address=192.168.50.0/24 tunnel=yes
add comment=BG2NS-IT2Shops dst-address=10.50.0.0/16 level=unique peer=\
    peer84 proposal=NS2BG sa-dst-address=pfSense.IP sa-src-address=\
    routerHQ.main2 src-address=192.168.30.0/24 tunnel=yes
add comment=BG2NS-IT2Shops dst-address=192.168.5.0/24 level=unique peer=\
    peer84 proposal=NS2BG sa-dst-address=pfSense.IP sa-src-address=\
    routerHQ.main2 src-address=192.168.50.0/24 tunnel=yes
add comment=BG2NS-IT2Shops dst-address=10.10.0.0/16 level=unique peer=\
    peer84 proposal=NS2BG sa-dst-address=pfSense.IP sa-src-address=\
    routerHQ.main2 src-address=192.168.30.0/24 tunnel=yes
add comment=BG2NS dst-address=192.168.200.0/24 level=unique peer=peer84 \
    proposal=NS2BG sa-dst-address=pfSense.IP sa-src-address=routerHQ.main2 \
    src-address=192.168.50.0/24 tunnel=yes
add comment=BG2NS dst-address=192.168.202.0/24 level=unique peer=peer84 \
    proposal=NS2BG sa-dst-address=pfSense.IP sa-src-address=routerHQ.main2 \
    src-address=192.168.50.0/24 tunnel=yes
add comment=BG2NS dst-address=192.168.200.0/24 level=unique peer=peer84 \
    proposal=NS2BG sa-dst-address=pfSense.IP sa-src-address=routerHQ.main2 \
    src-address=192.168.23.0/24 tunnel=yes
add comment=BG2NS dst-address=192.168.200.0/24 level=unique peer=peer84 \
    proposal=NS2BG sa-dst-address=pfSense.IP sa-src-address=routerHQ.main2 \
    src-address=192.168.30.0/24 tunnel=yes
add comment=BG2NS-IT2Shops dst-address=10.11.0.0/16 level=unique peer=\
    peer84 proposal=NS2BG sa-dst-address=pfSense.IP sa-src-address=\
    routerHQ.main2 src-address=192.168.50.0/24 tunnel=yes
add comment=BG2NS-IT2Shops dst-address=10.11.0.0/16 level=unique peer=\
    peer84 proposal=NS2BG sa-dst-address=pfSense.IP sa-src-address=\
    routerHQ.main2 src-address=192.168.30.0/24 tunnel=yes
add comment=BG2NS-IT2Shops dst-address=10.30.0.0/16 level=unique peer=\
    peer84 proposal=NS2BG sa-dst-address=pfSense.IP sa-src-address=\
    routerHQ.main2 src-address=192.168.50.0/24 tunnel=yes
add comment=BG2NS-IT2Shops dst-address=10.40.0.0/16 level=unique peer=\
    peer84 proposal=NS2BG sa-dst-address=pfSense.IP sa-src-address=\
    routerHQ.main2 src-address=192.168.50.0/24 tunnel=yes
add comment=BG2NS-IT2Shops dst-address=10.20.0.0/16 level=unique peer=\
    peer84 proposal=NS2BG sa-dst-address=pfSense.IP sa-src-address=\
    routerHQ.main2 src-address=192.168.50.0/24 tunnel=yes
add comment=BG2NS-IT2Shops dst-address=150.10.0.0/16 level=unique peer=\
    peer84 proposal=NS2BG sa-dst-address=pfSense.IP sa-src-address=\
    routerHQ.main2 src-address=192.168.50.0/24 tunnel=yes
add comment=BG2NS-IT2Shops dst-address=150.10.0.0/16 level=unique peer=\
    peer84 proposal=NS2BG sa-dst-address=pfSense.IP sa-src-address=\
    routerHQ.main2 src-address=192.168.30.0/24 tunnel=yes
add comment=BG2NS-IT2Shops disabled=yes dst-address=192.168.200.0/24 \
    level=unique peer=peer84 proposal=NS2BG sa-dst-address=pfSense.IP \
    sa-src-address=routerHQ.main2 src-address=10.98.0.0/24 tunnel=yes
add comment=BG2NS-IT2Shops dst-address=10.10.0.0/16 level=unique peer=\
    peer84 proposal=NS2BG sa-dst-address=pfSense.IP sa-src-address=\
    routerHQ.main2 src-address=192.168.2.0/24 tunnel=yes
add comment=BG2NS-IT2Shops dst-address=10.11.0.0/16 level=unique peer=\
    peer84 proposal=NS2BG sa-dst-address=pfSense.IP sa-src-address=\
    routerHQ.main2 src-address=192.168.2.0/24 tunnel=yes
add comment=BG2NS-IT2Shops dst-address=192.168.5.0/24 level=unique peer=\
    peer84 proposal=NS2BG sa-dst-address=pfSense.IP sa-src-address=\
    routerHQ.main2 src-address=192.168.2.0/24 tunnel=yes
add dst-address=10.10.0.0/16 level=unique peer=peer84 proposal=NS2BG \
    sa-dst-address=pfSense.IP sa-src-address=routerHQ.main2 src-address=\
    192.168.90.0/24 tunnel=yes
add dst-address=10.11.0.0/16 level=unique peer=peer84 proposal=NS2BG \
    sa-dst-address=pfSense.IP sa-src-address=routerHQ.main2 src-address=\
    192.168.90.0/24 tunnel=yes
add dst-address=150.10.0.0/16 level=unique peer=peer84 proposal=NS2BG \
    sa-dst-address=pfSense.IP sa-src-address=routerHQ.main2 src-address=\
    192.168.90.0/24 tunnel=yes
add dst-address=10.100.100.0/24 level=unique peer=peer84 proposal=NS2BG \
    sa-dst-address=pfSense.IP sa-src-address=routerHQ.main2 src-address=\
    192.168.90.0/24 tunnel=yes
add comment=SIP dst-address=172.16.223.9/32 peer=peer9 proposal=NC-proposal \
    sa-dst-address=SOME_WAN sa-src-address=routerHQ.main2 src-address=\
    192.168.0.0/17 tunnel=yes
add comment=OpenBG-MIS disabled=yes dst-address=10.50.0.0/16 level=unique \
    peer=peer84 proposal=NS2BG sa-dst-address=pfSense.IP sa-src-address=\
    routerHQ.main2 src-address=192.168.2.0/24 tunnel=yes
/ip route
add distance=2 gateway=WAN2_IPSS routing-mark=HQCAM
add distance=4 gateway=WAN2_IPSS routing-mark=raspTemp
add distance=1 gateway=PUBLIC_IPS.21 routing-mark=mng-int
add comment=ISP_WAN1 distance=1 gateway=82.117.203.61
add comment=ISP_WAN2 distance=3 gateway=WAN2_IPSS
add distance=1 dst-address=172.16.0.0/24 gateway=172.16.255.2
add distance=1 dst-address=172.29.0.0/24 gateway=10.10.88.2
add distance=1 dst-address=192.168.0.0/24 gateway=192.168.30.10
add distance=1 dst-address=192.168.2.0/28 gateway=10.99.99.254
add distance=1 dst-address=192.168.3.0/24 gateway=192.168.30.10
add distance=1 dst-address=192.168.12.0/24 gateway=10.99.99.254
add distance=1 dst-address=192.168.21.0/24 gateway=10.99.99.254
add distance=1 dst-address=192.168.22.0/24 gateway=10.99.99.254
add distance=1 dst-address=192.168.23.0/24 gateway=10.99.99.254
add distance=1 dst-address=192.168.24.0/24 gateway=10.99.99.254
add distance=1 dst-address=192.168.25.0/24 gateway=10.99.99.254
add distance=1 dst-address=192.168.30.0/24 gateway=10.99.99.254
add disabled=yes distance=1 dst-address=192.168.30.0/24 gateway=192.168.50.99
add distance=1 dst-address=192.168.31.0/24 gateway=10.99.99.254
add distance=1 dst-address=192.168.32.0/24 gateway=10.99.99.254
add distance=1 dst-address=192.168.33.0/24 gateway=10.99.99.254
add distance=1 dst-address=192.168.34.0/24 gateway=10.99.99.254
add distance=1 dst-address=192.168.35.0/24 gateway=10.99.99.254
add distance=1 dst-address=192.168.36.0/24 gateway=10.99.99.254
add distance=1 dst-address=192.168.37.0/24 gateway=10.99.99.254
add distance=1 dst-address=192.168.41.0/24 gateway=10.99.99.254
add distance=1 dst-address=192.168.42.0/24 gateway=10.99.99.254
add distance=1 dst-address=192.168.43.0/24 gateway=10.99.99.254
add distance=1 dst-address=192.168.44.0/24 gateway=10.99.99.254
add distance=1 dst-address=192.168.50.0/24 gateway=10.99.99.254
add distance=1 dst-address=192.168.100.0/24 gateway=10.99.99.254
add distance=1 dst-address=192.168.200.0/24 gateway=192.168.50.99
add distance=1 dst-address=192.168.240.0/20 gateway=192.168.50.2
/ip route vrf
add interfaces=ether2-mng-int,vlan337 routing-mark=mng-int

/queue simple
add disabled=yes max-limit=700M/700M name=internet2 queue=\
    ethernet-default/ethernet-default target=*4 total-queue=ethernet-default


/system identity
set name="Company CCR_Master"
/system leds
set 0 interface=sfp1
/system logging
add disabled=yes topics=ipsec
add action=remote topics=critical
add action=remote topics=warning
add action=remote topics=write
add action=remote disabled=yes topics=ipsec
add topics=critical
add action=echo disabled=yes topics=ipsec
add disabled=yes topics=pptp
/system ntp client
set enabled=yes primary-ntp=176.56.236.23 secondary-ntp=147.91.26.20
peer84 is MikroTik hq1- PFSENSE - most of the problems come from this peer
and peer13 is Mikrotik hq1- Mikrotik hq2 this peer is been used just for some subnets, but in the first time there was a tunnels only from this peer and also didnt work as well
Hey Tomislav91,
If you successfully establish both VPN tunnels but still experience connectivity issues, then: Check for network ACLs in your VPC that prevent the attached VPN from establishing a connection. Verify that the security group rules assigned to the EC2 instances in your VPC allow appropriate access.
Regards,
Mika Hawkins
I’ve only mentioned the lifetime as a troubleshooting hint - if the connections break in 80-100 % of the SA lifetime configured after the connection establishes, it makes sense to look at the PFS settings, as the first rekeying takes place at this time, and on that the mismatch of PFS settings causes the SA to become unusable.
If the pfSense can trigger SA rekey also on number of bytes transported (which RouterOS cannot), it may happen even sooner.
But as you’ve got pfs-group=none on all /ip ipsec proposal rows in the configuration of the single Mikrotik you’ve chosen to post, I assume that it’s the same at the other Mikrotik(s) and therefore at least at the links between two Mikrotiks, this is not the reason why they fail.
OK. That means that the NAT traversal mechanism is not in use (you have even forbidden its use in the /ip ipsec profile settings), and this practically means the following:
- whereas the control packets (IKE) are sent as UDP packets on port 500, the transport packets of the SAs are bare ESP packets
- as no pinholes (tracked connections) are expected to need to be forcifully kept open, no keepalives packets are sent
As a consequence, if no traffic is sent using the SA, no ESP packets are sent. So if there is a firewall somewhere between the devices or on one of them which closes the pinhole if no traffic passes through it for some time, the pinhole closes. Since the traffic works for a while after connection re-establishment, ESP traffic in one direction must be capable of opening the pinholes on all the path, otherwise it would not work at all. But if the pinhole is closed and the request in the payload goes in the “wrong” direction, the ESP packet carrying it never makes it to the destination, so no response to that request is ever generated, and thus the pinhole never can be re-created (until eventually a request in the payload would be sent from the “proper” side).
The firewall at the router whose configuration you have posted is complex and leaky, it seems you have missed the fact that the default handling in all chains is “accept”, i.e. packets which do not match any rule are accepted. It’s best seen in chain=output where you have two action=accept rules but no action=drop one, which just burns CPU on every packet sent by the router but it has no actual effect - everything gets through anyway.
In the context of the above, this means that SA traffic initiated from this router is allowed to be sent (it is accepted in chain=output), creates a tracked connection (pinhole) as there is a couple of rules which refer to connection-state so connection tracking is activated, and therefore the packets in the opposite direction of the SA are accepted by the “accept established,related” rule in chain=input, so even if you added a “drop the rest” rule to the end of chain=input, the firewall at this router would still accept them. As there is no “drop the rest” rule in chain=input, nor any rule selectively dropping the ESP packets from the remote peer, this router’s firewall doesn’t explain why the IPsec connections break.
But it may not be the case on the other routers. That’s why I’ve asked you for a configuration of both Mikrotiks between which you encounter the issue, not just a single one.
But it may not be the case on the other routers
Firewall od the other router are the same, it has just more src or dst nat there, so rules which are for us interesting are the same. But now at this point, tunnel is established thorugh pfsense and there is no much rules on the WAN side except one that we are using for internal purpoeses
dropping the ESP packets from the remote peer, this router’s firewall doesn’t explain why the IPsec connections break.
How can i upgrade firewall on mikrotik side to tell me more for this problem. I am quite annoyed with this issue, and i am not sure even if tunnel is MikroTik-MikroTik or Mikrotik - PfSense still is a issue of connection to those peers. We are speaking about 350+ peers. Two Subnets are full 10.10 and 10.11 is at half, so you understand the math there. Also with 192.168.200, also is a problem with all subnets from HQ side 192.168.50, 192.168.23, 192.168.30 and so on.
Just to understand better, under MiKroTik L3 core switch and lower are l2 in the branches.
What tunnel are you talking about above? You’ve said that the issue exists on multiple ones or even on all, so why do you now concentrate on one which uses a pfSense?
action=log firewall rules won’t help you much in diagnosing an issue which occurs only randomly. I’ve mentioned the firewall because I started looking at it just to see whether it might cause the outages after a long period of bi-directional silence, and found that the one you’ve posted cannot be blamed for this. But I have also found that it is leaky and allows access to the router from outside (you have created a complex state automaton I haven’t understood completely to protect ftp,ssh,telnet,tftp etc., but it doesn’t deal with the API service and maybe other ones, and none of the services is disabled), and also slightly inefficient as you have several selective action=accept rules before the “accept established&related” one (so every single packet has to be checked against through those rules).
If you can pinpoint a peer where the issue occurs regularly, I would sniff on the public address of that peer as well as the LAN addresses of it on the CCR1009, so that both the transport packets and the payload packets would be sniffed, and do the same at the peer Mikrotik itself. The purpose is to find out whether there is a gap in the payload traffic or some rekey failure or whether the SA just stops working without a visible reason, so due to a software bug or CPU overload on one of the devices.
You can either sniff into a file on the router’s flashdisk itself (but the volume of data until the issue occurs may be too high to fit on the disk, so an external flash drive connected via USB is a better option), or you can connect an external PC with tcpdump or Wireshark’s dumpcap and use mangle rules with action=sniff-tzsp to copy the packets of interest there.
Sending IPsec logs into a file on the peer in the branch office would also be helpful - or also to the external PC running tcpdump using action=syslog in /system logging. The IPsec logs only log the IKE/IKEv2 processing, not the actual transport of encrypted data, but they are still very verbose and there’s no way to restrict the logging to a particular peer. So on the CCR, it has to be done using syslog or to an external USB disk.
What’s the CPU load (/system profile)? The CCR1009-8G-1S should support hardware accelerated encryption according to the IPsec manual, does it really, i.e. is the H mark shown in /ip ipsec installed-sa print?
What do you mean by “lower are L2”? Are you using the CRS line at the branches, meaning their CPUs are of the SOHO grade, like mipsbe at 400 MHz? That should not matter much if there is just a single tunnel on each of these devices and the traffic volume through the tunnel is in the range of few Mbps. But sure, /tool profile on these should also be looked at.
On what hardware do you run the pfSense?
I would sniff on the public address of that peer as well as the LAN addresses of it on the CCR1009
So if the public IP of the Mikrotik 1009 “live” on ether1 I will add that ether1 to sniffer? You say LAN addresses, but those vlan are not on CCR, they are on cisco core switch. So I can maybe add VRRP_LAN interface? Where is option to put it on USB. I tried to stream to server from this tutorial https://www.wizzycom.net/traffic-capture-from-a-mikrotik-device-to-wireshark/ but nothing happend in wireshark, it is maybe due to fact that when i try to ping my IP 192.168.50.13 there is no ping to this IP?
I noticed that sniffer burn my CPU, so to left it a couple of days to check when problem appear, hm, maybe not good idea, i am not sure. Maybe the best idea is to put it on usb 64GB and let it running and tell support to notice me when problem appears, just cant find the option to put it on external media.
What do you mean by “lower are L2”
So this is our infrastructure:
Two HQ.
One have MikroTik and its our local IPs from where support “go” and solve problem to remote shops. Below that MikroTik are switches, L3 main one(more than one, but thats only for HSRP, not relevant to this problem) and floor switches L2 which have tagged vlans to the offices. One office is most important, it is office from where support works.
So this MikroTik have a tunnel between PfSense from another HQ and on that PfSense is created openvpn servers which are remote shops connection (they are using mikrotiks also, but smaller ones, not CCR). And this is how we communicate with those shops.
Can you help me with commands to put those logs working? Is it good to put it like this
/system logging action add name=usb target=disk disk-file-name=usb1/log
and then just tell ipsec log to go to usb?
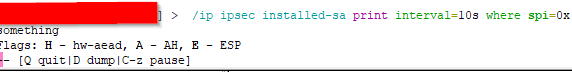
ipsec installed-sa print
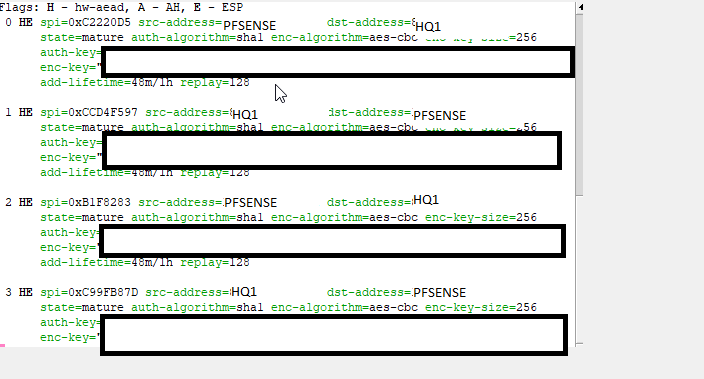
CPU is at 20% at Hq1 ccr 1009.
Razmišljam da nebi bio razgovor po telefonu mnogo brži…
So if I get you right, there is not an IPsec tunnel to each remote shop, but there is one fat pipe to the pfSense machine which concentrates those 350+ OpenVPN tunnels from the remote shops? I was wondering where the 350 IPsec identities went missing from the configuration export ![]() So when you mentioned “lower are L2”, I thought you talk about lower grade Mikrotiks in the remote shops.
So when you mentioned “lower are L2”, I thought you talk about lower grade Mikrotiks in the remote shops.
- I did mean using the IP addresses, not the interface names, as the sniffing filter. The thing is that you need to have both the payload packets (between local LAN subnet and remote LAN subnet) as well as the IPsec transport packets carrying them in the same .pcap to be able to make some conclusion. So on the HQ machine, you have to filter on the LAN subnet of the remote machine and on the public IP of the remote machine, and vice versa on the remote shop machine (where you need to sniff on any remote address to/from which a traffic may go via the IPsec tunnel). But as there are not 350 small remote machines (one per remote shop) but just the single big one running towards the pfSense, it looks like a mission impossible, as you have to sniff almost all the traffic of the CCR1009

- as for Wireshark not receiving the TZSP packets, it is more likely that a firewall/antivirus software blocks the TZSP packets as they are unexpected (there is no related connection initiated by the PC). I had a case where I had to disable AVG, allowing the TZSP destination port in the Windows firewall wasn’t sufficient.
- sniffing to USB disk would be fine if it was fast enough - as the CCR1009-8G-1S uses the mini AB connector, it has only USB2.0 and hence 480 Mbit/s raw bitrate, which may not be enough depending on the traffic volume to&from the peer (and each packet appears at least twice in the sniff; if they pass through a bridge, then even more times, once from the physical interface and once from the bridge. As you say that the CPU is at 20% during normal operation (no sniffing), I’m afraid the throughput of the USB won’t be sufficient unless the traffic to the remote shops is only a fraction of the total one (i.e. unless most of the traffic is inter-VLAN routing at the HQ itself)
Yes, this is exactly what I had in mind - first that, and then
/system logging add topics=ipsec,!packet action=usb.
But when defining the logging action, it is probably better to allow more lines per file and more files to rotate than the defaults, as we don’t know in advance how big the log will become.
Razmišljam da nebi bio razgovor po telefonu mnogo brži…
Mozemo i tako ako je lakse ![]() posle ovde okaciti resenje
posle ovde okaciti resenje ![]()
So if I get you right, there is not an IPsec tunnel to each remote shop, but there is one fat pipe to the pfSense machine which concentrates those 350+ OpenVPN tunnels from the remote shops? I was wondering where the 350 IPsec identities went missing from the configuration export
So when you mentioned “lower are L2”, I thought you talk about lower > grade > Mikrotiks in the remote shops.
firstly, we did it like that, but this for us is better solution, to have one ipsec to pfsense and that pfsense create openvpn servers for those shops. This is not a big deal really, but it is annoying, because i cant figure out where is break point.
it looks like a mission impossible
so, what we can do than?
Maybe the best start is to switch on logging of the IPsec and to run a netwatch pinging through the tunnel which will log failures (on-down={:log warning message=“ping through tunnel down”}) to see in the logs whether the issue is correlated with a rekey or not.
If it turns out not to be correlated, I’d say the only way ahead is to make the Wireshark work (better using mangle rules with action=sniff-tzsp to send just a small amount of traffic to it first), and once that’s done, add more and more traffic until we either have it all or the CPU usage reaches, say, 60 % - after that I think it isn’t safe to continue.
Another way to determine the traffic volume in advance is to run /ip ipsec installed-sa print interval=10s where spi=0xsomething for a while and get bytes per second as a 1/10 of the average of the differences between the current-bytes figures - provided that the traffic is more or less even all the time. This is the transport traffic in one direction, and if sniffing also the payload using the mangle rules, we avoid multiplicated packets in case of bridging, so the bandwidth of the sniff will be just double the bandwidth of the IPsec transport packets.
In general, I know there was an issue in Mikrotik’s IPsec interworking with Strongswan (but does the pfSense use Strongswan?), I can see cases where the connection fails for some minutes and then starts working again, but I can’t tell you right now which Strongswan version I’m running there, and I’m using IKEv2 at that link. Until 6.43.something, even IKEv2 connections between two Mikrotiks were showing similar symptoms, caused by an error in the rekey procedure - the next automatic rekey was fixing it. BTW, the rekey procedure differs in IKE(v1) and IKEv2, so maybe in your case, switching from IKE/aggressive to IKEv2 could help.
Maybe the best start is to switch on logging of the IPsec
I enabled ipsec logging memory.
and to run a netwatch pinging through the tunnel
i cant ping from mikrotik because vlans are on the cisco below mikrotik, not on router itself.
/ip ipsec installed-sa print interval=10s where spi=0xsomething
where I run this, nothing append
BTW, the rekey procedure differs in IKE(v1) and IKEv2,
on the pfsense it is IKE1, i will try to change to IKEv2
How can you forward traffic using IPsec if the Mikrotik isn’t configured as a gateway, i.e. if it doesn’t have an IP address in the sender’s subnet? The 'Tik must first receive the packet in order to match it to a policy and send it via an SA… what am I missing here?
sure, you have to replace “something” with the actual SPI value - they are dynamic so you have to look for one first. You can even use spi~“0x(value1|value2)” to watch multiple SAs at a time (it’s a normal regexp applied on the parameter value converted to a string)
so i will first get spi value where src is pfsense and dst is mikrotik and vice versa? two spi?
Which one spi to choose? I have a bunch of spi’s with state dying and state mature.
l suppose to use those mature?
Yes, the mature ones are in use. And yes, you need one per direction. The dying ones should not exist for more than a couple of seconds, so if they do, it is already weird (or the traffic volume is so low - the dying SA is normally there after a rekey until the first packet arrives through the new SA and then the dying one can be safely dropped.
The /ip ipsec installed-sa print is not as easy as I’ve expected, it overwrites the old results on the screen, and if you run it with file=somename append, the interval is ignored. So you have to use a script to run it every 10 seconds (or every minute), indicating the file and the append (so that the contents of the file was not overwritten).
i will try to make script with this two mature ones, from command you provide to me (value1|value2) and edit this post when i did it
i tried to make like this
:set time [/system clock get time]
:local file [/ip ipsec installed-sa print]:local contents [/file get $file contents]
:set contents ($contents . “\n” . $time)
/file set $file contents=$contents
}
but from some reason, nothing been created in the file section. There is no ipsec file when I run script.
The bad news is that RouterOS is not great when it comes to file manipulation, but the good news is that the timestamp is part of every print “job”. So just do
/ip ipsec installed-sa print file=somefilename append
periodically, and each list of SAs will begin with a comment block which will include the timestamp.
But you cannot open the file in RouterOS as soon as it exceeds some size (which is not really big), so you’ll have to download it somewhere.
:set time [/system clock get time]
:local file [/ip ipsec installed-sa print file=ipsec append]:local contents [/file get $file contents]
:set contents ($contents . “\n” . $time)
/file set $file contents=$contents
}
i did like this and i run script mannualy, but there is no ipsec file in the Files?
there should be somefilename.txt if you followed my suggestion literally… what exact command did you type?