Hi
I have Tx Queue Drops on the SFP interface, and I don’t really understand where to start digging and what can cause this. Is it okay? Is it a problem?
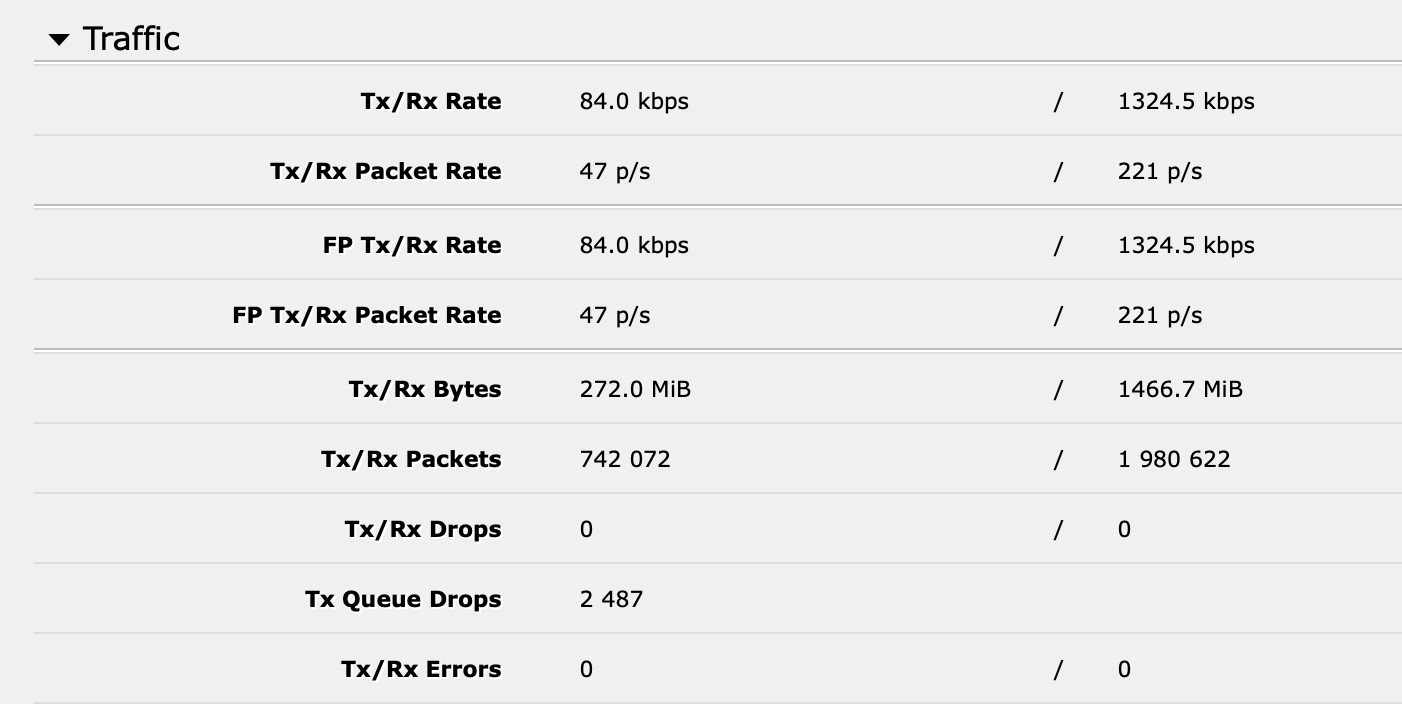
Screen from SFP inside Mikrotik:
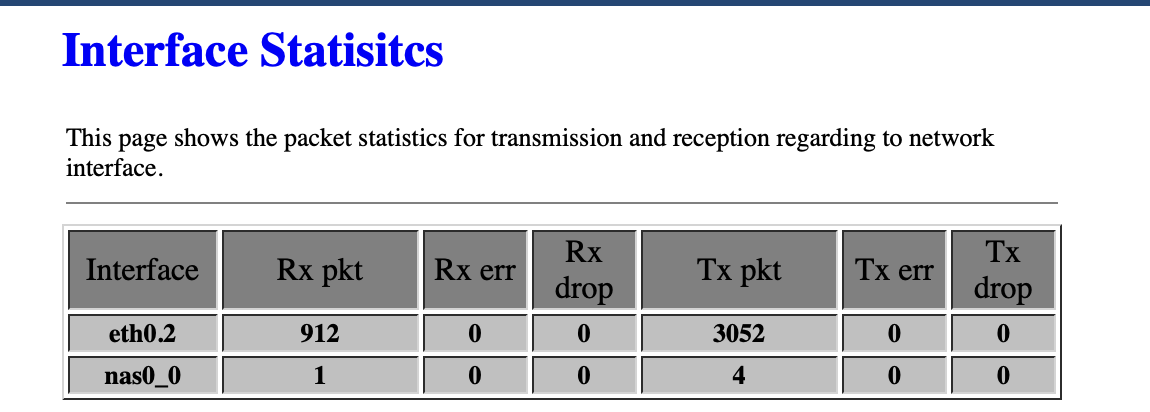
Screens from GPON SFP stick:
SFP is ODI DFP-34X-2C2

Hi
I have Tx Queue Drops on the SFP interface, and I don’t really understand where to start digging and what can cause this. Is it okay? Is it a problem?
Screen from SFP inside Mikrotik:
Screens from GPON SFP stick:
SFP is ODI DFP-34X-2C2
Tx queue drops mean drops caused by Tx buffer being full because port could not transmit frames fast enough to keep the pace with rate of frames being queued for transmission. This kind of errors is not due to state of physical link and thus receiver (in this case it’s SFP) can not see any sign of them.
Understood.
But why is this happening?
There are plenty of reasons, so it’s hard to tell why. One thing might be that SFP link between ROS and SFP module runs at 1Gbps but cumulative data rate, heading towards that particular SFP module, is higher. Some of data can be buffered in Tx queue, the rest is simply discarded. The sustainable rate towards module might be even lower and you’d still see smilar statistics if flow control was doing the job (which means that SFP module can temporarily pause packet flow, causing Tx queue to get full as well).
Did I get it correctly: when this drop happens, actual packet loss happens on the SFP stick, and it could affect general connection stability?
At the same time, I don’t have any drops on the PPPOE interface, which is run over SFP (but should I if it already was dropped here?).
Actual loss happens on mikrotik … packet somehow arrives at port Tx queue (another name for FIFO buffer) where it’s discarded. So it’s never attempted to pass to SFP and SFP knows nothing about it (not even that it was dropped).
PPPoE is, in this case, payload of discarded packet. PPPoE interface doesn’t know that packet got discarded at some point as PPPoE is unacknowledged transport protocol. The only entity that can discover that some packets are missing, is PPPoE server … but doesn’t care either, PPPoE doesn’t do fragmentation (IP layer has to if PPPoE link MTU is too small and IP de-fragmentation is then done by final recipient of packets … when a fragment is missing, IP stack discards the incomplete packet) so it’s whole IP packets gone missing. PPPoE also doesn’t provide feedback to client so any detected missing PPPoE frames stats is kept secret from you.
Next instance noticing packet drops is actually TCP/UDP stack. UDP doesn’t care about it either while TCP requests retransmission. If you’d be able to look into retransmission stats, you’d probably see some non-zero number there. Iperf tests provide with such stats (for UDP as well because application itself does detection). For TCP the consequence is reduced throughput, each retransmission causes reduction of “TCP window size” and that is important on all links where round trip latency is not negligible (i.e. all links. Period.)
In short: there are not many places where you could notice dropped packets apart from counters at the place of drops and on application layer (but this one can’t tell you where packets get dropped). And dropped packet is counted as such only at the place where it’s dropped.
So. Is this a problem at all? I still can see these packets. But everything works fine. Not sure where this drop occurs and under what circumstances. Can it be dropped by firewall?
These Tx drops are only a problem if you perceive them as such ![]()
No, they are not due to firewall, if firewall drops packets, they are counted by acting rule counters.
Go to Queues/Interface Queues.
Select your interface and set the queue type to “multi-queue-ethernet-default”
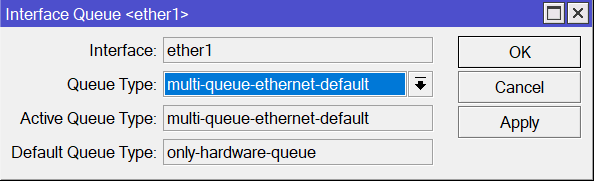
Repeat for all interfaces showing tx queue drops.
It’s works. Tks!
Well i must now confess after months of trying to figure out the issue on mikrotik RoS V7 x86_64 with SFP+ NiC i was getting this issue from one machine to another x86_64 routerOS… on bandwidth test millions of txt-queue-drops.. after enabling this on both mikrotiks.. now i have 0 errors.. that worked.. now just need to fix the other issue where i cannot change L2MTU it stays the same i put on the MTU.
EDIT: after several days of changing the multi-queue-ethernet… the TX Queue Drops zeroed… but now i have some TX/RX Errors.. 5 days running average traffic os 2gbps on peak-times i am getting 4105 Rx Errors so far.. any ideas on where to start looking?
running intel X520 card dual port 10G..
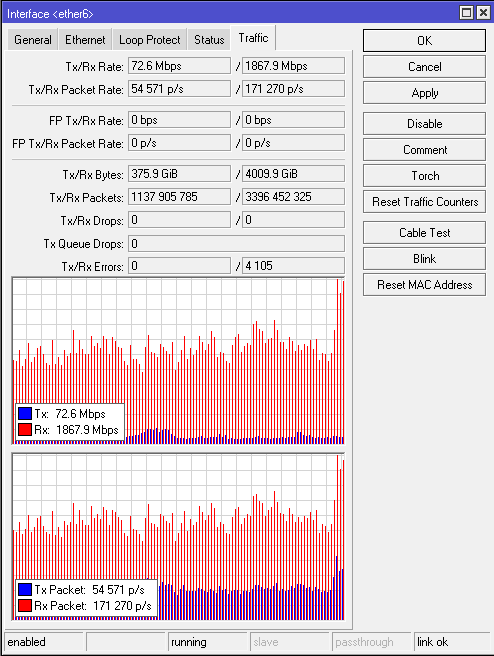
i am using gbic sfp+ intel dual LC multimode version with patch cord 3mts.. the gbic is up to 150mts distance.. 850nm.. could it be the GBIC now? or perhpaps something else?
Hi guys..
so further testing done, on the same server we have Mellanox ConnectX4 CX4121 model, and on this dual interface sfp+ NIC we don´t get any tx-queues Drops rx-drops..
but on the same server we have intel x520 da2 we see the rx-drops only… but we have left ping cmd for hours running on external server ip address and no packet loss detected…
so i am wondering how and where from this errors are comming.. on irq we can see all multi cpus beeing distributed even on the packets from the interfaces..
so it all leads to some issue on drivers with the intel x520 and intel 8299xx models and intel x710 models.. as all of them throw RX-ERROr on TX QUEUE-DROPS rx-errors only.
but the mellanox running on both servers BGP and PPPOE don´t show any errors.. using different versions of routerOS v7..
i guess the next stage will be replacing all the intel cards for sure. as i am running original intel gbic on this intel cards.. just for the sake of compatibility issues.. as this cards do not run with 3rd party gbics unless they get unlocked first.. and also this cards have been upgraded with latest firmware from intel available 2024..
Hello, PortalNET.
I have the same problem with X520, but after changing the queue type, I see problems in the bandwidth test (tcp, both directions): everything is fine for 30 seconds, but then the speed degrades to 2.5 Gbps, if I stop the test and start it again, everything repeats. When testing in only one direction, the problem is not observed.