Wi-Fi channels cheatsheet

The internet is full of complex, detailed and confusing information about Wi-Fi, very often mixing together the ETSI regulations with the FCC/US ones and it is really not easy to understand fully the implications of choosing one channel instead of another.

2.4 GHz is relatively easy, once you know that channels may overlap and that at the end of the day the only "good" configuration is using channels 1, 6 and 11.

5 GHz is a nightmare, already with 20 MHz wide channels due to DFS, CAC, TPC and what not.

When you go for wider channels, 40, 80 and 160 MHz, the probabilities of making a "wrong" choice multiply.

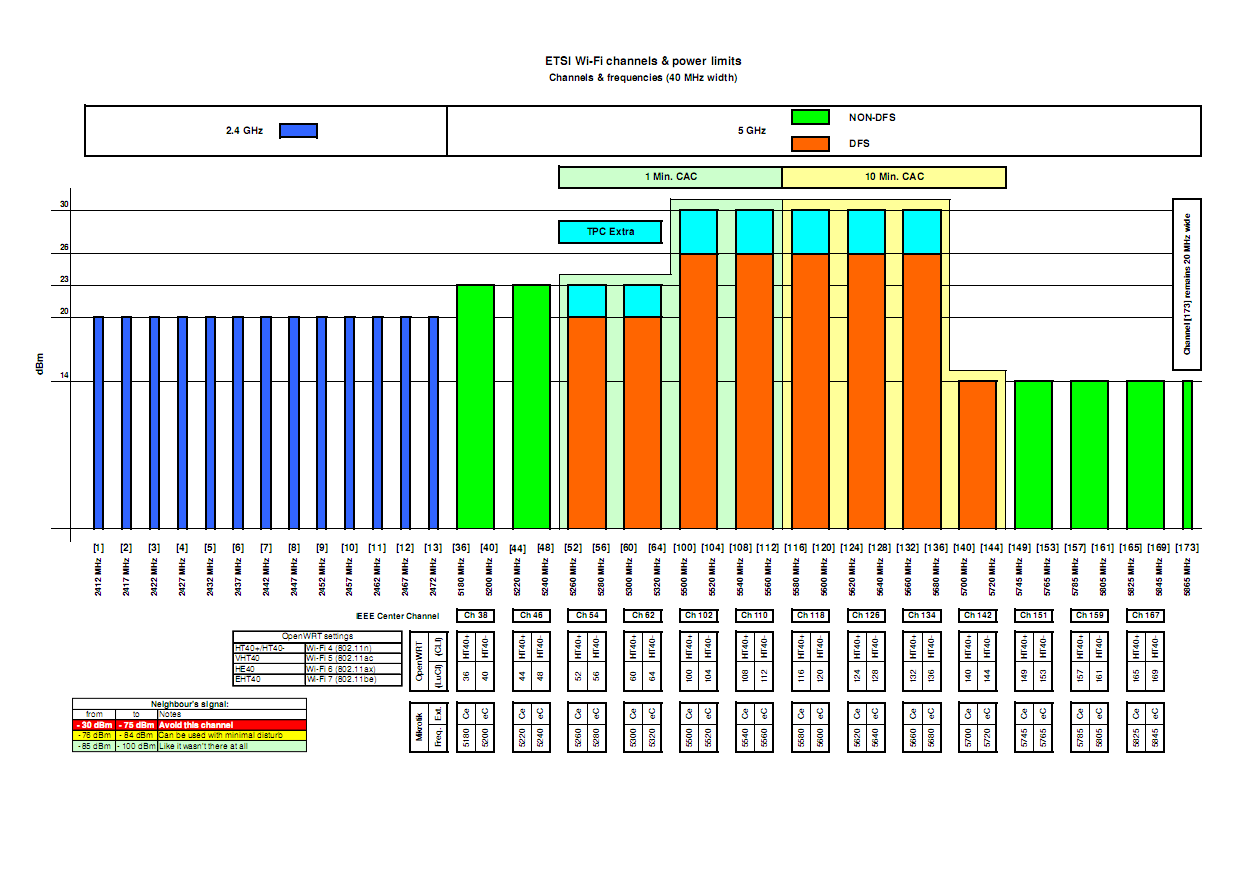
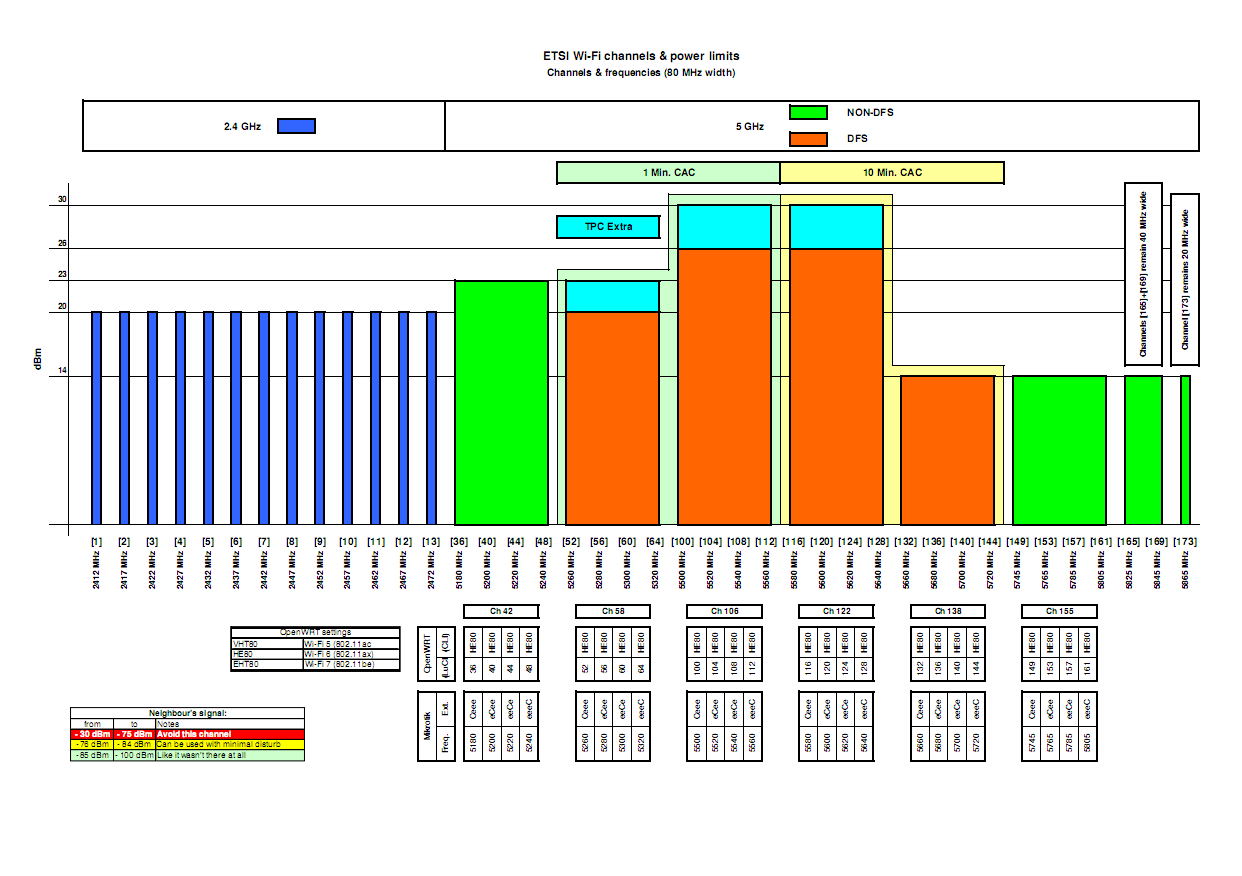
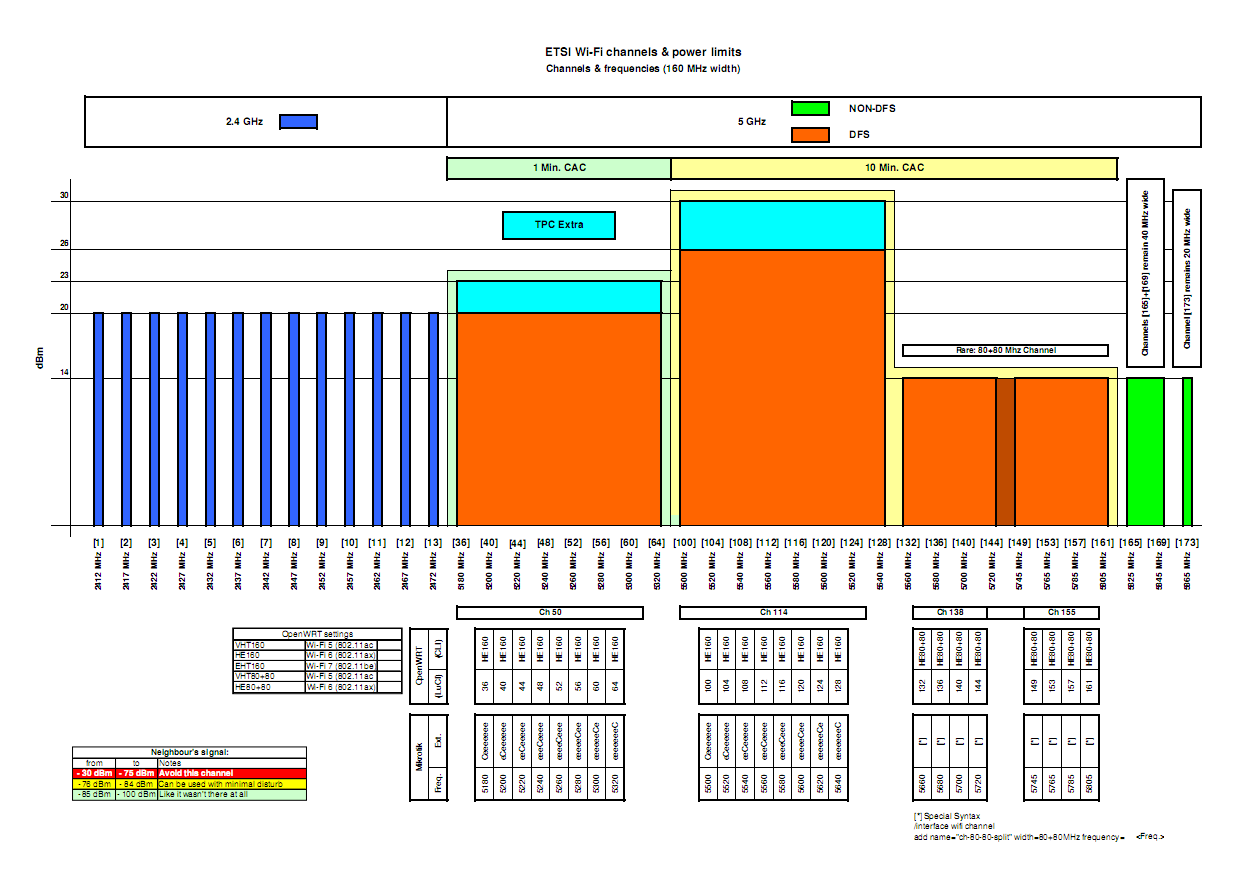
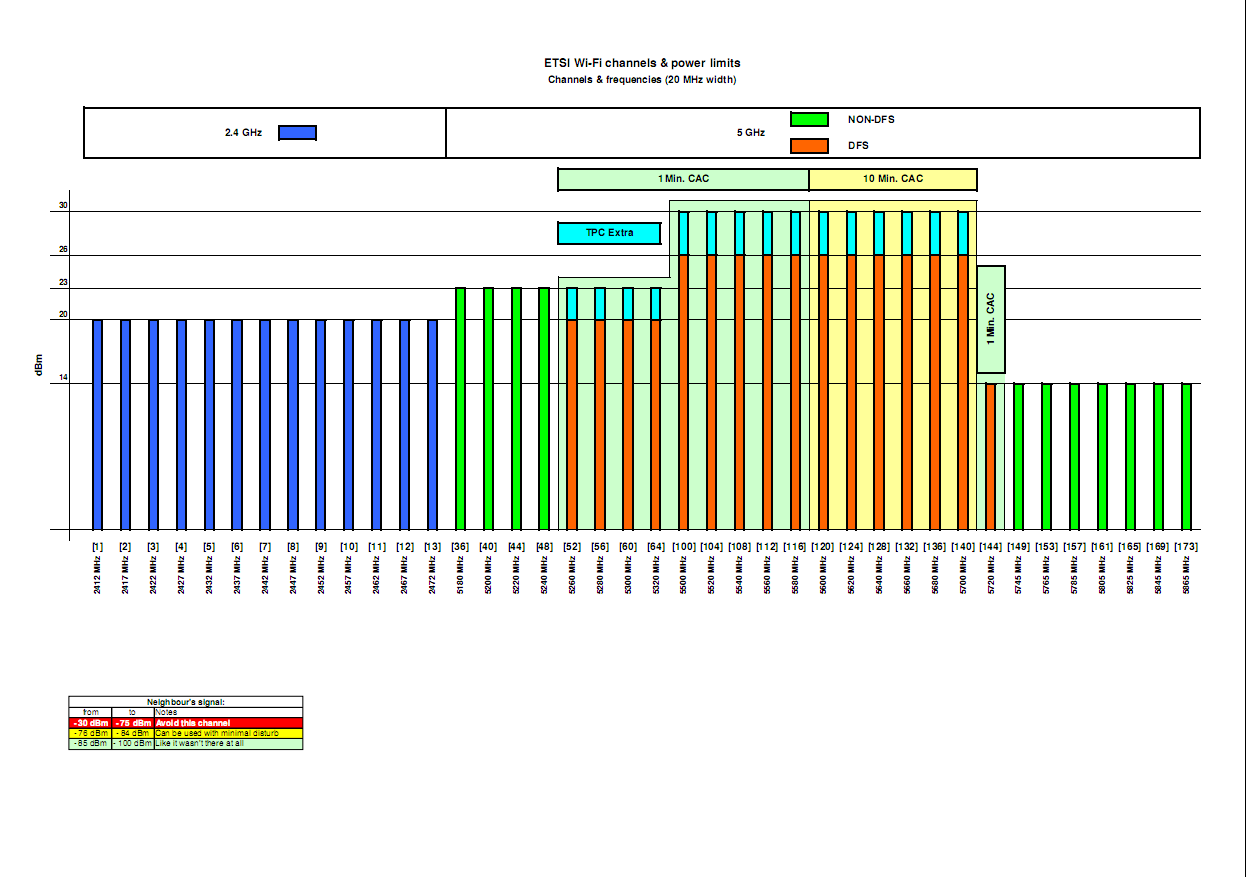
I wasn't able to find a complete and easily understandable table of channels so I made one, actually 4 of them, one each for 20/40/80/160 Mhz wide channels.

Here we use ETSI, our good friends across the pond (as well as those in other countries with different regulations) may well take the .xls and adapt it to their local situation.

I am attaching the spreadsheet as a .xls (inside a .zip) and as a .pdf as a 4 page A3 pdf print, together with (relatively poor) .png images, so that they are immediately visible.

As always ideas, corrections, proposal for additions are welcome.

wifi_channels.zip (21.9 KB)
wifi_channels.pdf (44.0 KB)


EDIT:

  1. 25/07/2026 Fixed first 80 MHz 5 GHz channel (was wrongly #38, now it is correct #42)
  2. 28/07/2026 Fixed max power of 5GHz high channels to 14 dBm (was 13)
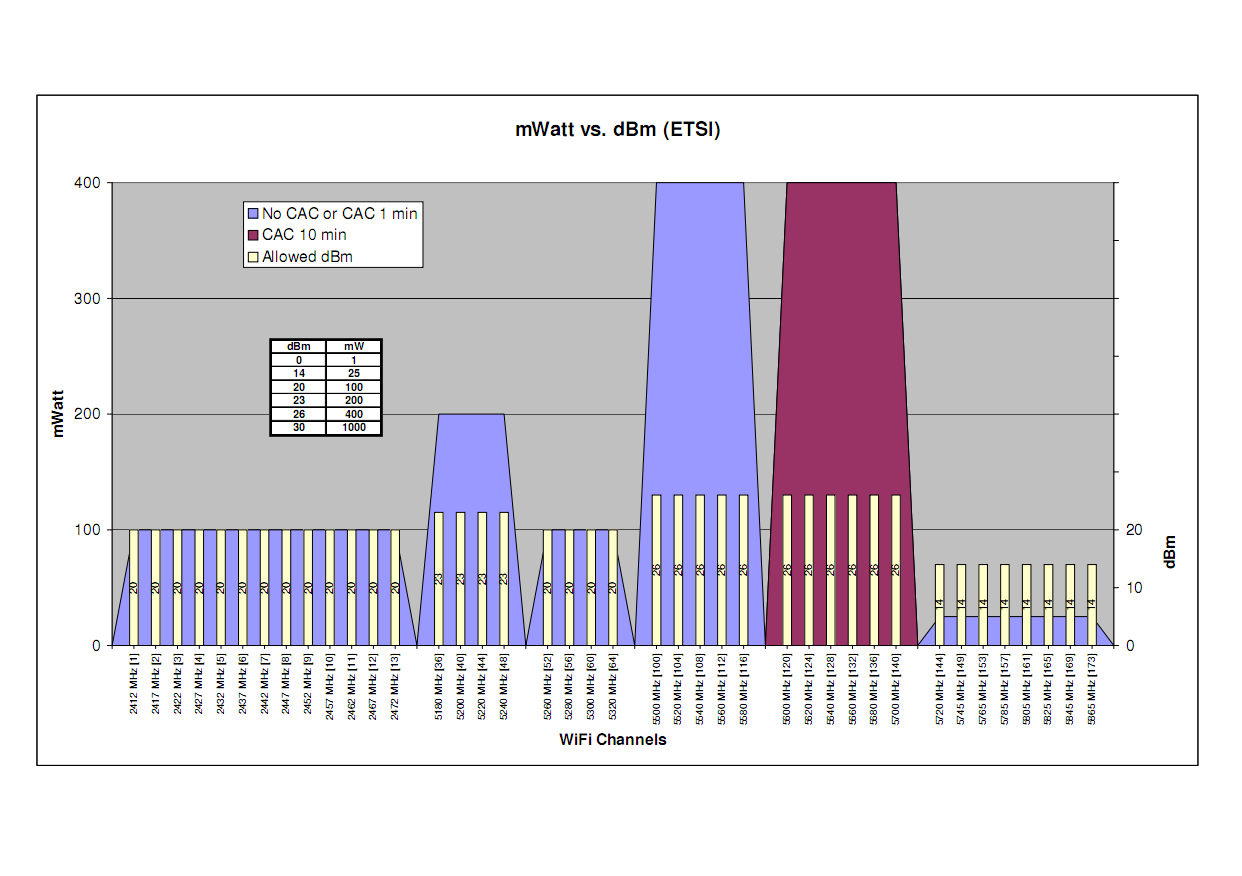
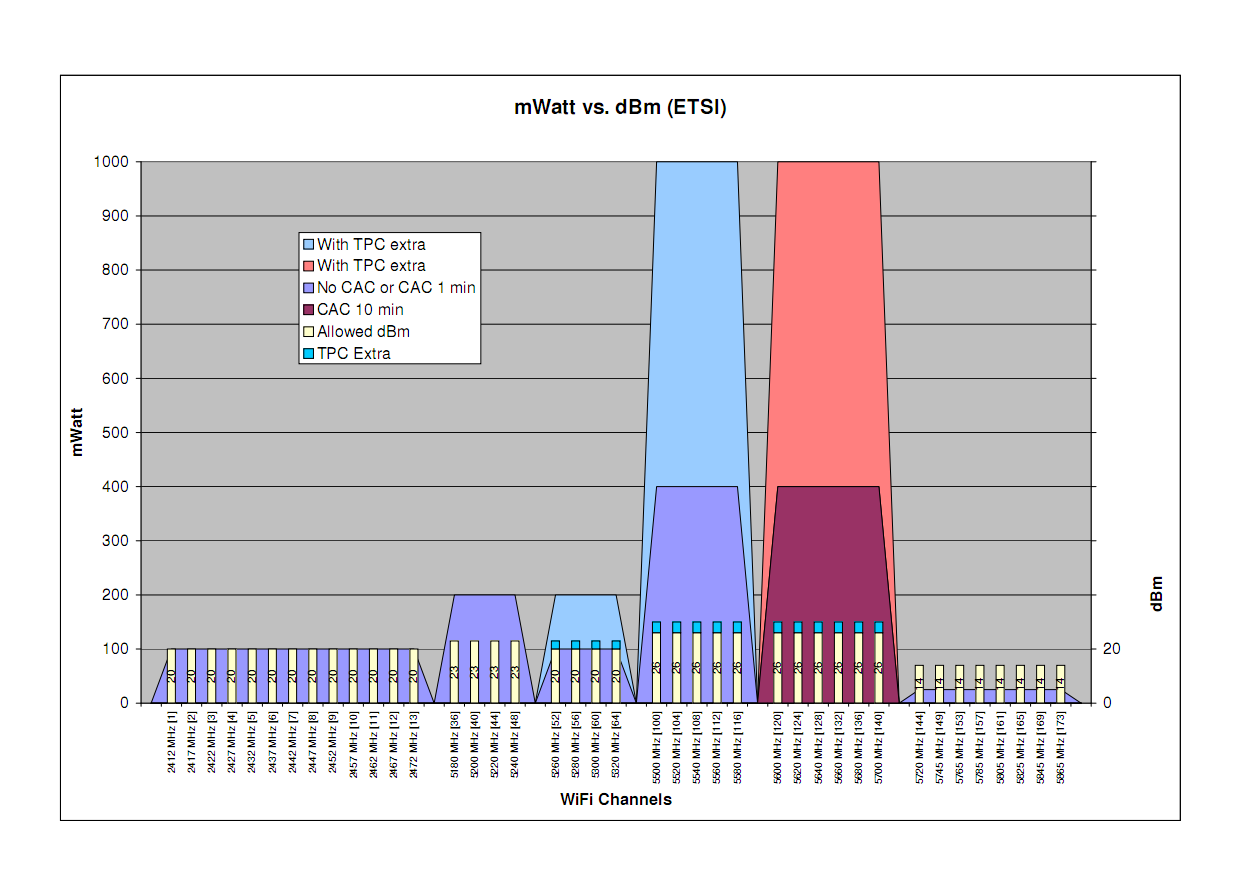
Due to the logarithmic nature of dBm measurements, it is often not immediate to understand how a difference of 3 dBm means halving or doubling the transmission power in mWatts.

The attached graphic attempts to visually evidence this, the yellow bars in foreground are dBm's per ETSI regulations, the background areas represent the corresponding transmission power.

The yellow bars are dBm.
The areas are mWatt.
The "centering" is done at 20 dBm=100 mW.
The idea is to convey visually how large is the difference of 3 dBm in terms of power.

This is the "max 400 mW" version (you won't anyway get to 1000 mW):


mWatt_to_dBm_400.pdf (10.7 KB)

And this is the "Full" (up to 1000 mW) version, it is a bit more confusing and it is essentially an exercise in futility, still it is even better to represent what you thought you have avaialble but that you actually don't have:


mWatt_to_dBm_1000.pdf (10.6 KB)

Wait, isn't 30 dBm 1 Watt? It looks like 150 mW in your chart?

EDIT: ah, the chart is quite misleading when both axes represent the same measurement but are scaled completely differently.

Bro, do you even WiFi? You can't just smash logarithmic dBm onto a linear mWatt grid. That’s how you end up with a chart claiming 30 dBm is 150 mW right next to a table that says it’s 1,000.

Oh, yes I can :slightly_smiling_face:, you may not like the result, but I can.

The yellow bars are dBm.
The areas are mWatt.
The "centering" is done at 20 dBm=100 mW.
The idea is to convey visually how large is the difference of 3 dBm in terms of power.

Let's see if this other version is less confusing.

EDIT: Removed graphic, added to post #2

My brain refuses to process a graph in which 23 and 26 dBm are under 150mW.
Sorry, maybe we just have different backgrounds.

dbm scale is on the right. left is mW. You probably seen this. I am no statistics guy either, but at least I can extract the information. What bothers me, the graph is clipped at 400mW, why??

I can extend it to 1000 mW allright.
I have to find a way to add the TPC extra power.

MikroTik wireless engineers got lost on quest for TPC

Yep.
But not only them, hence the 1000 mW is something like the holy grail.

And now the graphic is confusing.

EDIT: Removed graphic, added to post #2

Now the diagram illustrates it perfectly when people come to the forum and complain about "poor mikrotik wifi signal". Old devices not honoring regulatory is one side of the coin, but comparing TPC capable devices with Mikrotik devices just crushes them.

Yep, that was the idea, have something to show that can be visually appreciated.

Now all it remains to be confirmed is whether it is correct to keep the 26 dBm as max allowed in practice or if in the graphics it should be set to the theoretical limit (30-3=27).

If the AP allows DSSS modulation to be completely disabled so only OFDM is used there are four non-overlapping channels (1, 5, 9, 13)

Mikrotik (all except old wireless) do not have that possibility.