What are the default thresholds for a netwatch script to mark a check as UP? I have found forum responses where it seems there used to be netwatch attributes such as success-count but these do not seem to be available in rOS 7.
I have my netwatch “up-script” set to:
:local details ( "sent-count=" . ($"sent-count") . " response-count=" . ($"response-count"))
:log info "PRIMARY INET UP $details"
:if (($"response-count") = ($"sent-count")) do={
/ip route set distance=1 number=[find comment="primary_route"]
}
but realised that if the response-count was less then sent-count (say, if the link is not yet reliable) the primary_route distance will never be set, netwatch marks as UP and may flap DOWN/UP. I need a way to set my primary_route only if the UP condition is reliable and not just a single successful ICMP result.
I can’t find documentation on how routerOS determines the netwatch UP condition.
I thought it may just be the reverse of the DOWN threshold ie, in my case (I’m using the netwatch ICMP probe type):
The netwatch ICMP is (IMHO) complex and mis- or under- documented.
However (from what I understand) the logic seems to be like a double negation, UP is “NOT down”.
But then I don’t understand why you are comparing response-count against sent-count.
If they are equal, it should be the same as thr-loss-count=0.
But then setting appropriate values for packet-count and thr-loss-count probes there should be no need for a comparison within the UP (or DOWN) script, the condition is already checked (and in case triggers the up or down states) by the netwatch.
The problems seem to me to be caused by the other probes settings that are seemingly very difficult to “tune” correctly.
Thanks - I did look at his script but I still can’t work out how netwatch transitions to “up” state. I ended up writing my own failover script to schedule. Will post in the forums for discussion.
For ICMP check… what’s likely going on is that all values have defaults (which docs DO show) — so if something unset/empty/blank, a default is used, and that default will be used to UP/DOWN.
So for an “icmp” check ALL of the thr-* (like thr-rtt) value MUST be below either what you set OR, imporantly, the default thr-* value. But often it’s the “hidden default” that causes an unexpected down.
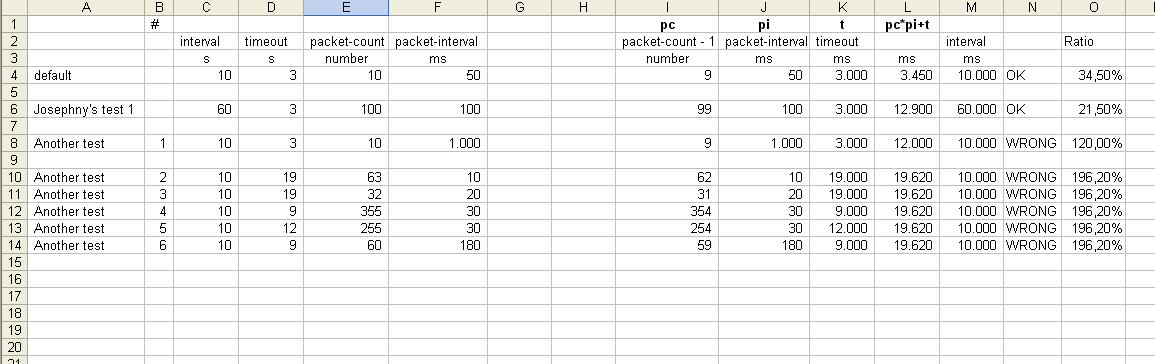
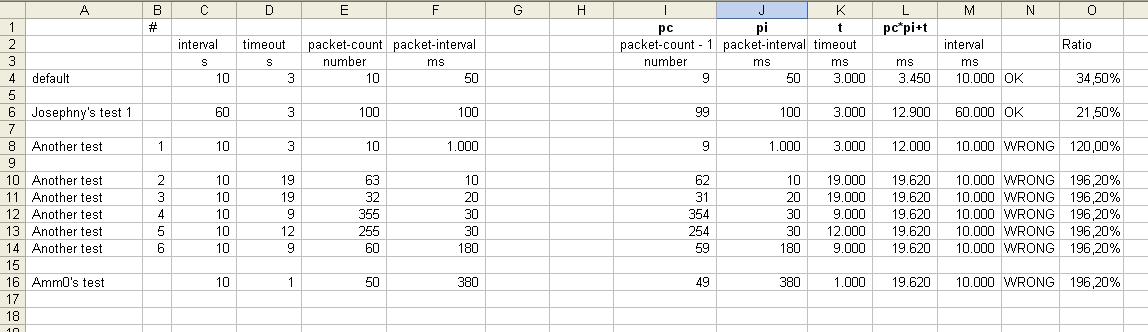
The UP/DOWN for icmp check is determined after number of packets sent every . By defaults, that means it runs for 500ms (1050ms), and that’s when netwatch test will compare ALL of the thr- stuff like thr-loss-percent etc over the collection of pings. Another check is run again at next that applies to all tests. Also * should be below BOTH the “global” and that apply to all netwatch types.
To troubleshoot, it may be easier to look at a failure and compare the thr-* values with the default values shown in docs. If any are higher than default, then set your netwatch to use a higher value for one of the thr-* in your config.
There is also the “simple” check, where you avoid all the thr-* values that determine the results. So idea of the “icmp” check is that you do want to monitor (and fail) if ping was “slow”, not just not responding. But what “slow” means does vary, thus all the options to configure the icmp check. But that does mean you need to define them in a lot of cases. (And to re-itererate the default values are used to determine success/failure, so an empty/unset value is still part of the ICMP check).
The point about:
"< packet-count > * < packet-interval > should be below BOTH the “global” < interval > and < timeout > that apply to all netwatch types. "
is interesting, never actually thought about it.
The defaults are:
General properties:
interval=10s
timeout=3s
ICMP specific probe options:
packet-interval=50ms
packet-count=10
If we use a fictional “my-packet-time” defined as:
my-packet-time=packet-interval*packet-count
the default is
my-packet-time=0.05 * 10=0.50s
So BOTH:
my-packet-time<interval = 0.50<10
and
my-packet-time<timeout = 0.50<3
are true.
The default packet-interval of 50ms does at first sight sound a lot like hammering[1], so it is understandable that ilum007 increased it to 500ms.
But that, combined with the increased number of packets from 10 to 15 makes the my-packet-interval=0.5 * 15=7.5s that will probably be less than interval, but larger than timeout.
[1] the default ping timeout in Windows is 4 seconds and in Linux the -i default parameter is 1 second
I dunno actually, thus the advice (“should”)… is to avoid having to know. Again the docs aren’t clear.
Anyway that ICMP packet-interval= is very different from interval= was why I mentioned (and potentially confusing). And I guess, the minor point was there may be some value in align them to “spread” the pings across the interval= by adjusting the packet-interval=. Although multiple interval-ish things do require some understanding… i.e. it’s nice you can really customize everything — but it not easy to know what you’re checking .
Yep, but until someone manages to “decrypt” the documentation, translating it from Mikrotikish to plain English and adding some commentaries, all this flexibility is counterproductive.
BTW (only as a side-side note) the
thr-loss-percent (Default: 85.0%)
is curious, in the sense that if one leaves the packet count to the default 10, it should mean that 9 is up, but 8 is down, so is the threshold actually 85% or it is 80%?
Do values between 81% and 89% all the same, or are they 80% to 89% (or 81% to 90%)?
I.e. is it the comparison against threshold values made with > or with >=?
One has to imagine netwatch is implemented in C, so internally netwatch can do floating point… Now it’s an open question whether thr-loss-percent is inclusive or not (i.e. == or >= )
However, @ilium007 is correct user scripting does not do floating point… so scripting thr-loss-percent= requires the above trick.
If in that formula 91% comes out as 10, it is not really-really rounding, it is something else, using that formula also 81=9.
Mathematical rounding should be a formula where 80=8, 84=8 and 85=9, that formula instead is as if in a spreadsheet you use int:
=int(((10*91)+99)/100) → 10
so the value when something changes is not 85%, it is 81% (and 81% up to 90% all come out as 9).
With integer limitations, the easier formula would be:
(80+5)/10=8
(81+5)/10=8
(82+5)/10=8
(83+5)/10=8
(84+5)/10=8
(85+5)/10=9
(86+5)/10=9
(87+5)/10=9
(88+5)/10=9
(89+5)/10=9
(90+5)/10=9
(91+5)/10=9
Do I understand this correctly that the following code will check the host once every 1 minute by sending out 100 packets with a 100ms interval between packets and return a ‘HOST-IS-DOWN’ result if the average response time of those 100 packets is greater than 400ms AND the total packet loss rate is 90% or above (i.e., 90 or more packets fail to elicit a response from the host)?
The goal for me here, BTW, is to not wake up to a screen full of notifications about down hosts when the ISP does some 1 minute flapping in the middle of the night.
That looks right to me. As I said, I’d compare the “Status” to make sure all the other RTT things are well within the defaults. If not, or even close, specifically set the various thr-* higher.
If you temporary enable topics=netwatch in /system/logging, it will log both the values got, and the “threshold” amount so you can see how close you are too. You’d likely want to disable netwatch in logging after testing (or use different log than default “memory”), as that could fill your log. But the logging will show pretty clearly how “close” you are to the limits.
WinBox4 with 7.19rc1 (perhaps earlier, didn’t check) will give you a warning that it adjusts interval= to match. They give the formula for that.
@Amm0
I guess that writing that formula in the documentation was just too much work?
Seriously, which parameters lead to 19s620ms?
@Josepny
Using in scripts variables with the same name of ROS parameters/values/commands/etc. is usually not a good idea.
point #16 here: http://forum.mikrotik.com/t/gp-csa-for-mikrotik-devices/182176/1
use (say) my_ prefix, i.e. my_status, my_comment, etc.