True, I’ve added it manually so no problem for me. I know its just cosmetic thing.
Indeed I’ve started seeing it since running Splunk 9.x release.
my docker splunk was updated to 9.0.1 on 2022-09-01
@jotne
really strange, restarting the splunk container fixed displaying my gateway router in splunk.
just that 1 disappears, all other devices do not show this behaviour.
Not sure why. Are some device at different distanse? (passing other routers etc)
No, not really, all the same class C network here @home …
Some passing thru a switch, some directly connected.
The gateway that is stops being visible is producing the most traffic, that is the only difference
the gateway stopped again after 23 times … not visible in Splunk right now.
@jotne any suggestions ?
gateway is functioning normally, sending syslog to an other remote syslog thru udp/2514
splunk is listening on udp/3514
at least 6 other devices are sending to that port and are visible in splunk
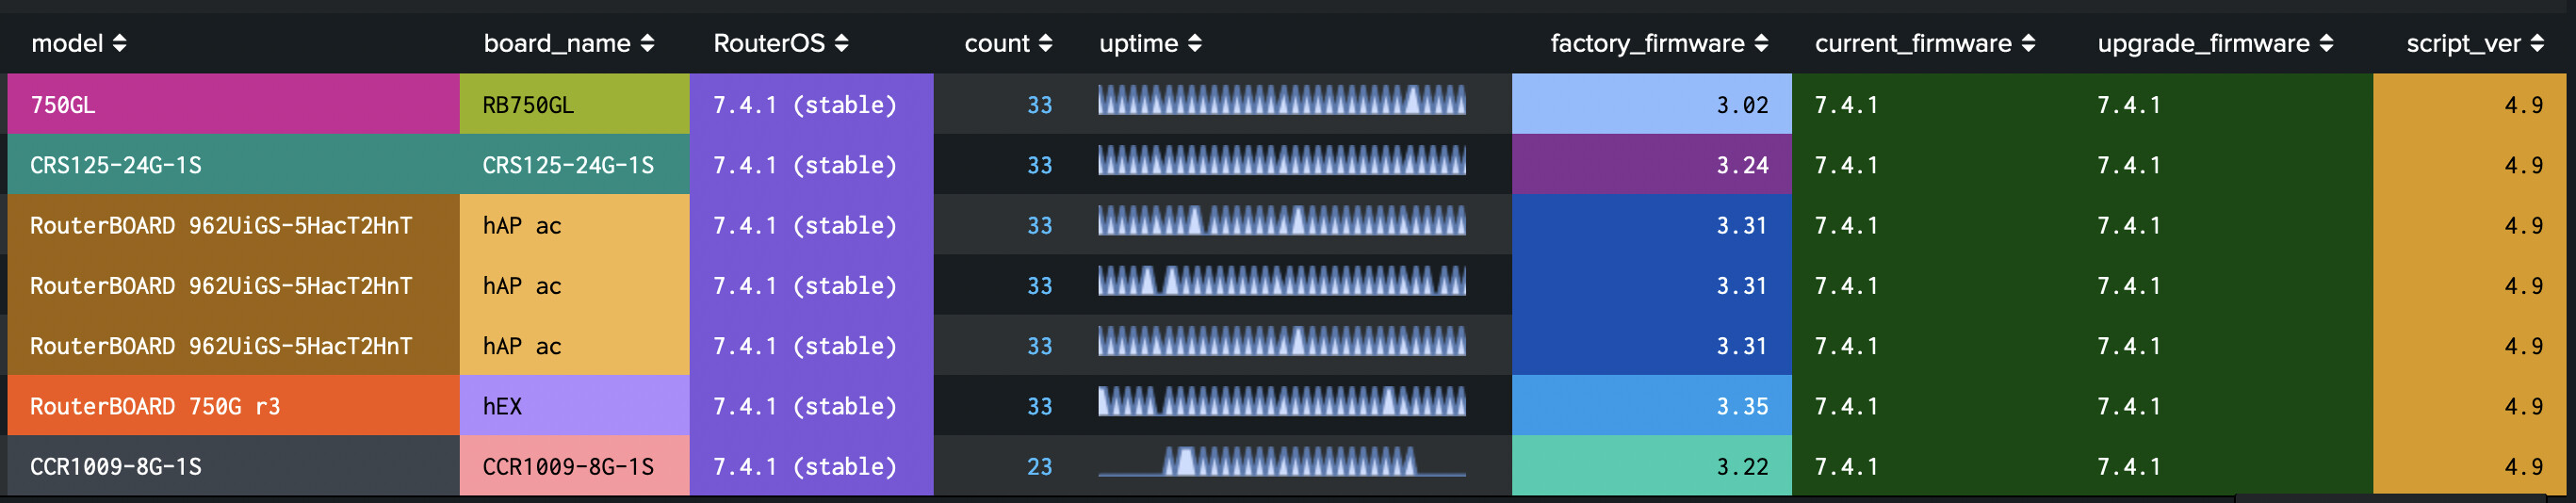
screenshot from last 32hours …
Set up an Ubuntu server (No container) add rsylog. Then on the gateway send syslog to New rsylog and Splunk to see if on or both stops recieving data.
If you use my post to setup syslog, you can see if it recieve data by looking in folder /data/syslog/udp/ip of device/file
tnx for the suggestion. I am not going to that for now. I don’t have any hardware to run this on.
I am running this in in docker on my synology DS420+ for several reasons and I am not going to use more hardware.
I had no problems before, have to learn to live with this,
tnx for your effort so far.
It is very possible that Kid Control does not properly account for traffic that is bridged, and not routed. If your NAS is on the same subnet as your ShieldTV, this traffic would be bridged, and might not be included in the Kid Control statistics. However, this traffic also would not probably be included in the older RouterOS v6 IP accounting statistics, since I believe it had the same limitation.
Although I updated the script and application today, I have always felt that the visualization of interface traffic is not very good. Where should I adjust it?
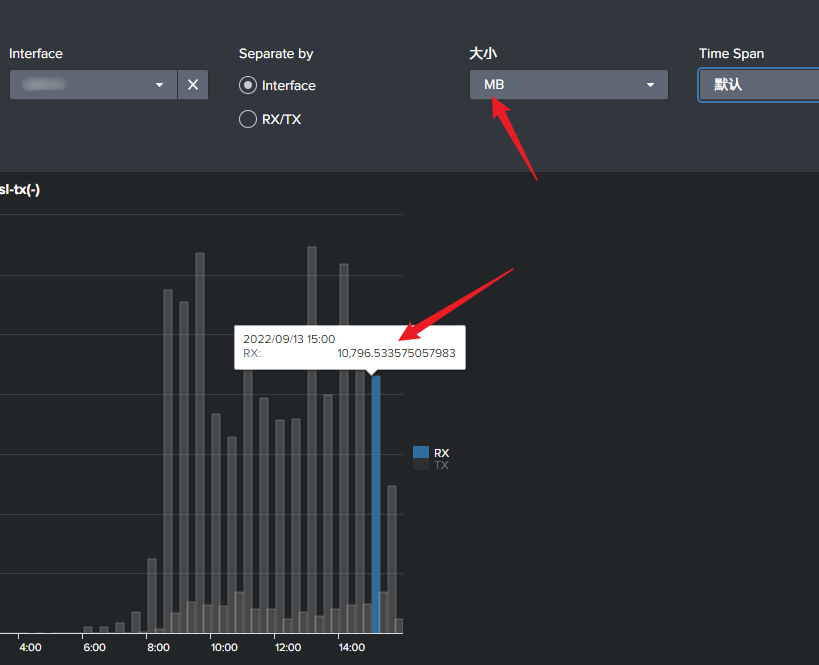
Not sure what you like to change. I am always open for improvement ![]()
It show 10,796.5 = 10GB I may round the data to not show so many decimal.
From your picture it seems that you have already changed some, like title the size has modded text and graph some compare the what I do see.
.
Hi
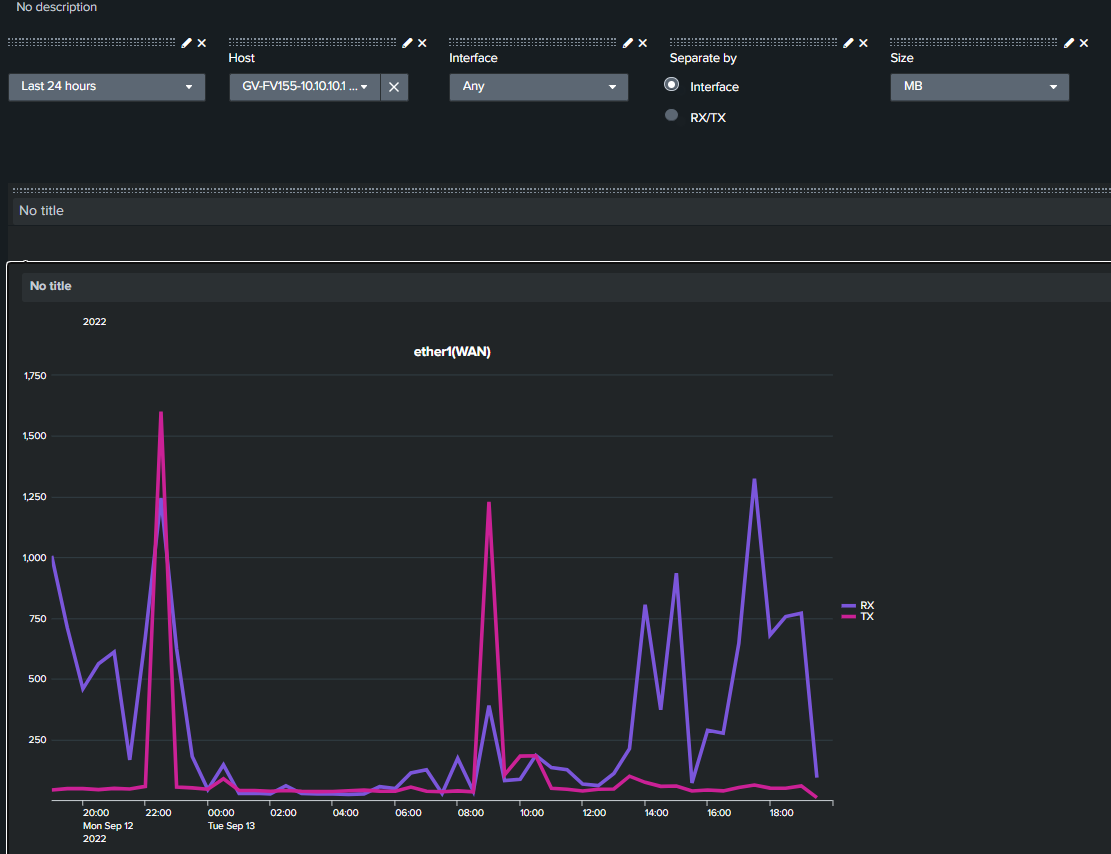
I’m trying to log current interface traffic - current usage.
This is my script:
:if ($Traffic) do={
	:foreach id in=[/interface find] do={
        :local output "$[/interface monitor-traffic [find where .id=$id] once as-value]"
		:set ( "$output"->"script" ) "traffic"
		:log info message="$output"
	}
}
Problem is that I copied Interface Traffic page to new one (cloned) but I’m not getting all of the interfaces on the list. I changed only few things but I get only half of them. As I can see, all interfaces with large amount of traffic aren’t listed.
Just started with this so I’m still learning…
I use only fp_rx_bits_per_second and fp_tx_bits_per_second values from response.
Is there maybe anyone who can create page for that?
Thanks.
EDIT
I think that problem is 6.45.9 MT version. On 6.49.6 everything works ok. I’ll try to upgrade…
You should at least upgrade. 6.45.9 is more then 2 years old. ![]()
You said:
Using Splunk to monitor and graph various data from our MikroTik Routers is a nice and free way to help you showing what is going on in your network.
Splunk is free to use for logging up to 500MB pr day.
But I can’t seem to find an option at the site that show this. Too many products/services/pricing models. Maybe it its there and I just missed it.
I’m looking at getting monitoring going on my small WISP so this is of interest. I’m working with The Dude as well - curious to compare - just don’t need another bill right now.
See section about free license in the link:
https://docs.splunk.com/Documentation/Splunk/latest/Admin/TypesofSplunklicenses
More here and how to convert to free license:
https://docs.splunk.com/Documentation/Splunk/latest/Admin/MoreaboutSplunkFree#Switching_to_Free_from_an_Enterprise_Trial_License
Only thing its not very clear about is that if you do not convert to Free license before 60 days, you will get inn to big problem with your splunk.
So if you like to use splunk free, you NEEEED to convert it before 60 days has gone.
PS links was found quickly using google search ![]()
Did change the first post to reflect that its 60 days to convert not 30 as before.
Main script updated to 5.1 (see section 2g)
Added CAPsMANN to script (no need for separate CapsMANNScript)
Added more Routing information
Removed on-error by useing main RouterOS version to run correct script
Version 3.8 is now released.
More remote connection dashboards. Fixed problem in firewall rules when packet mark was added to logging by Mikrotik.
Lots of other small fixes.
New file are found under section 1g
Download, extract and replace old app (if you have not med personal changes)
PS Main script needs to be updated to at least 4.9 to get routing information. (latest is 5.1)
What has changes since 3.7
3.8 (27.11.2022)
Added new dashboard "MikroTik IPsec connections"
Added new dashboard "MikroTik PPP connections"
Change from bytes to delta_bytes in table in "MikroTik Device Traffic"
Removed 0 fields to make math correct in "MikroTik Device Traffic"
Hide parameter list in "MikroTik DHCP request"
Change transaction to 100ms in "MikroTik DHCP request"
Set dropdown to request as default in "MikroTik DHCP request"
Added packet mark in "MikroTik Firewall Rules"
Added new panel with optional input in "MikroTik Firewall Rules"
Fixed missing packet-marking i firewall extraction
Added disabled status and added VPN route in "MikroTik Route List"
Fixed "Device table updater" to better follow firmware upgrade/downgrade
Fixed saved search rights to not show up everywhere
Thanks Jotne! for this new release. Both updated 5.1 script & 3.8 Splunk-app are working fine over here!
Hi Jotne,
Awesome thread and really appreciate the work you have put into the script. I would like to test out the logging for myself, would it be okay if I made a video on your script if I get everything working correctly? I will definitely give you a shoutout and put links to this thread in a YouTube video. Here is a link to my YouTube channel where I cover various other MikroTik configurations (https://www.youtube.com/c/thenetworkberg). Another custom script I covered a few years ago was Nathan1’s HA script. I just don’t want to create a video if you are planning on doing that yourself or feel unhappy with someone else doing it. Hoping to hear back from you soon, wanted to send you a message but couldn’t seem to do that on your profile. Have a great evening/day
Kind Regards,
Hi
I am not much of a video guy, nor do I have equipment for that. So If you like to do it, you are welcome to do so.
Have seen your videos that are very good, so looking forward to see the result ![]()
PS If you like to get in contact with me for question, you can reach me at this temp mail coribi3326@xegge.com